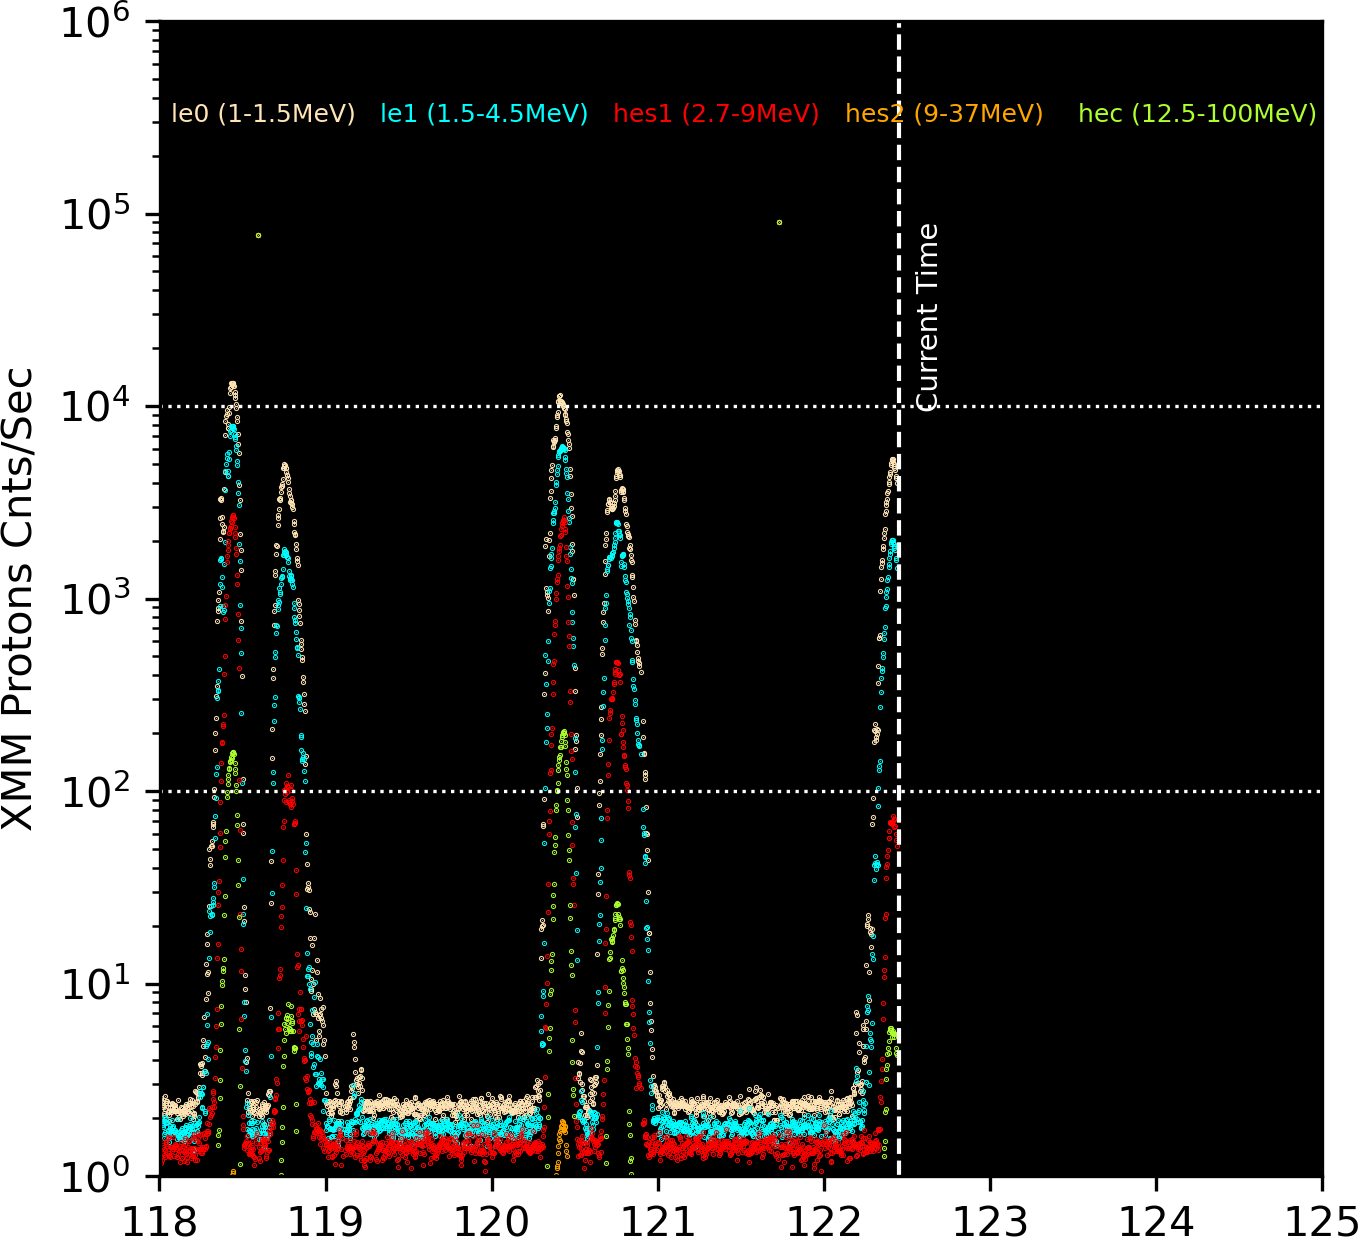
                                        Most recent XMM radiation observations
                                 Differential Flux particles/cm2-s-ster-MeV

 UT Date   Time    ---------------------------------- Protons MeV -------------------------------
                          LE1          LE2         HES1         HES2         HESC
  YR MO DA HHMM          1-1.5       1.5-4.5       2.7-9        9-37       12.5-100
2026-Feb22-15:30        4.686        0.381        1.640        0.395        0.396
2026-Feb22-16:30        1.352        0.429        1.135        0.427        0.339
2026-Feb22-17:30        1.376        0.391        1.120        0.379        0.340
2026-Feb22-18:30        1.406        0.405        1.141        0.391        0.342
2026-Feb22-19:30       36.549        0.357        1.107        0.395        0.386
2026-Feb22-20:30        2.475        0.360        1.063        0.411        0.337
2026-Feb22-21:30      525.494        0.384        5.519        0.413        0.634
2026-Feb22-22:30     1634.358        0.401       43.556        0.431        3.318
2026-Feb22-23:30      702.104        0.383       38.971        0.444        2.977
2026-Feb23-00:30      593.733        0.394       64.875        0.456        4.901
2026-Feb23-01:30      242.948        0.377       16.856        0.410        1.207
2026-Feb23-02:30       53.157        0.402        3.402        0.439        0.456
2026-Feb23-03:30        2.412        0.377        1.318        0.402        0.360
2026-Feb23-04:30        7.945        0.419        1.175        0.410        0.346
2026-Feb23-05:30       59.044        0.366        1.216        0.415        0.355
2026-Feb23-06:30        3.386        0.368        1.170        0.392        0.357
2026-Feb23-07:30        1.498        0.392        1.140        0.399        0.365
2026-Feb23-08:30        1.502        0.383        1.077        0.437        0.361
2026-Feb23-09:30        1.426        0.376        1.153        0.418        0.366
2026-Feb23-10:30        1.482        0.420        1.139        0.394        0.347
2026-Feb23-11:30        1.447        0.413        1.151        0.442        0.356
2026-Feb23-12:30        1.457        0.356        1.196        0.457        0.359
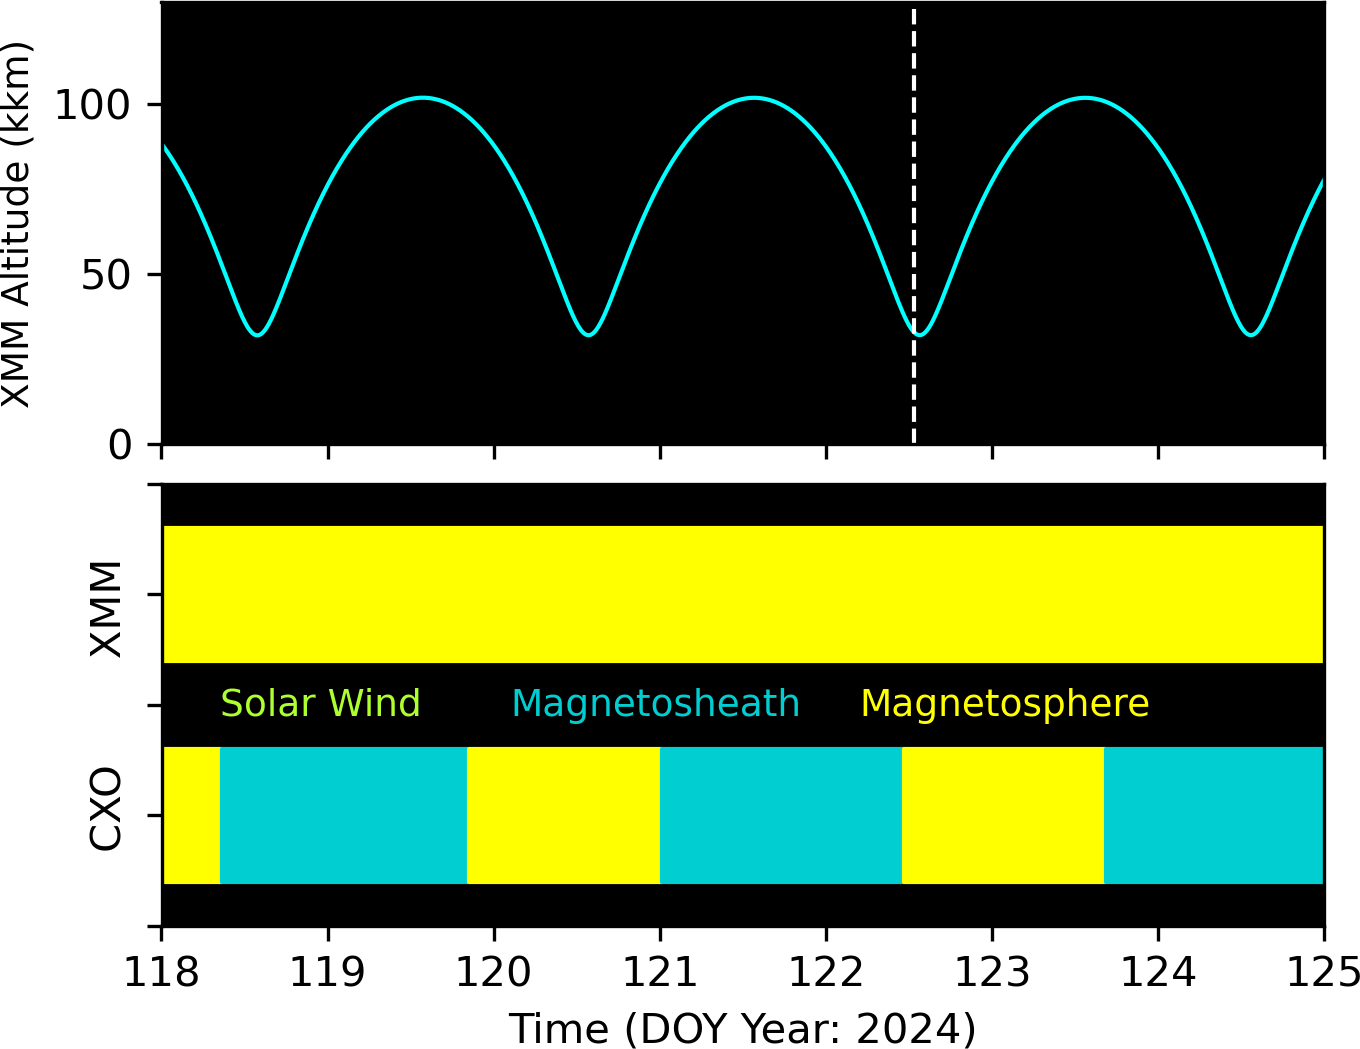
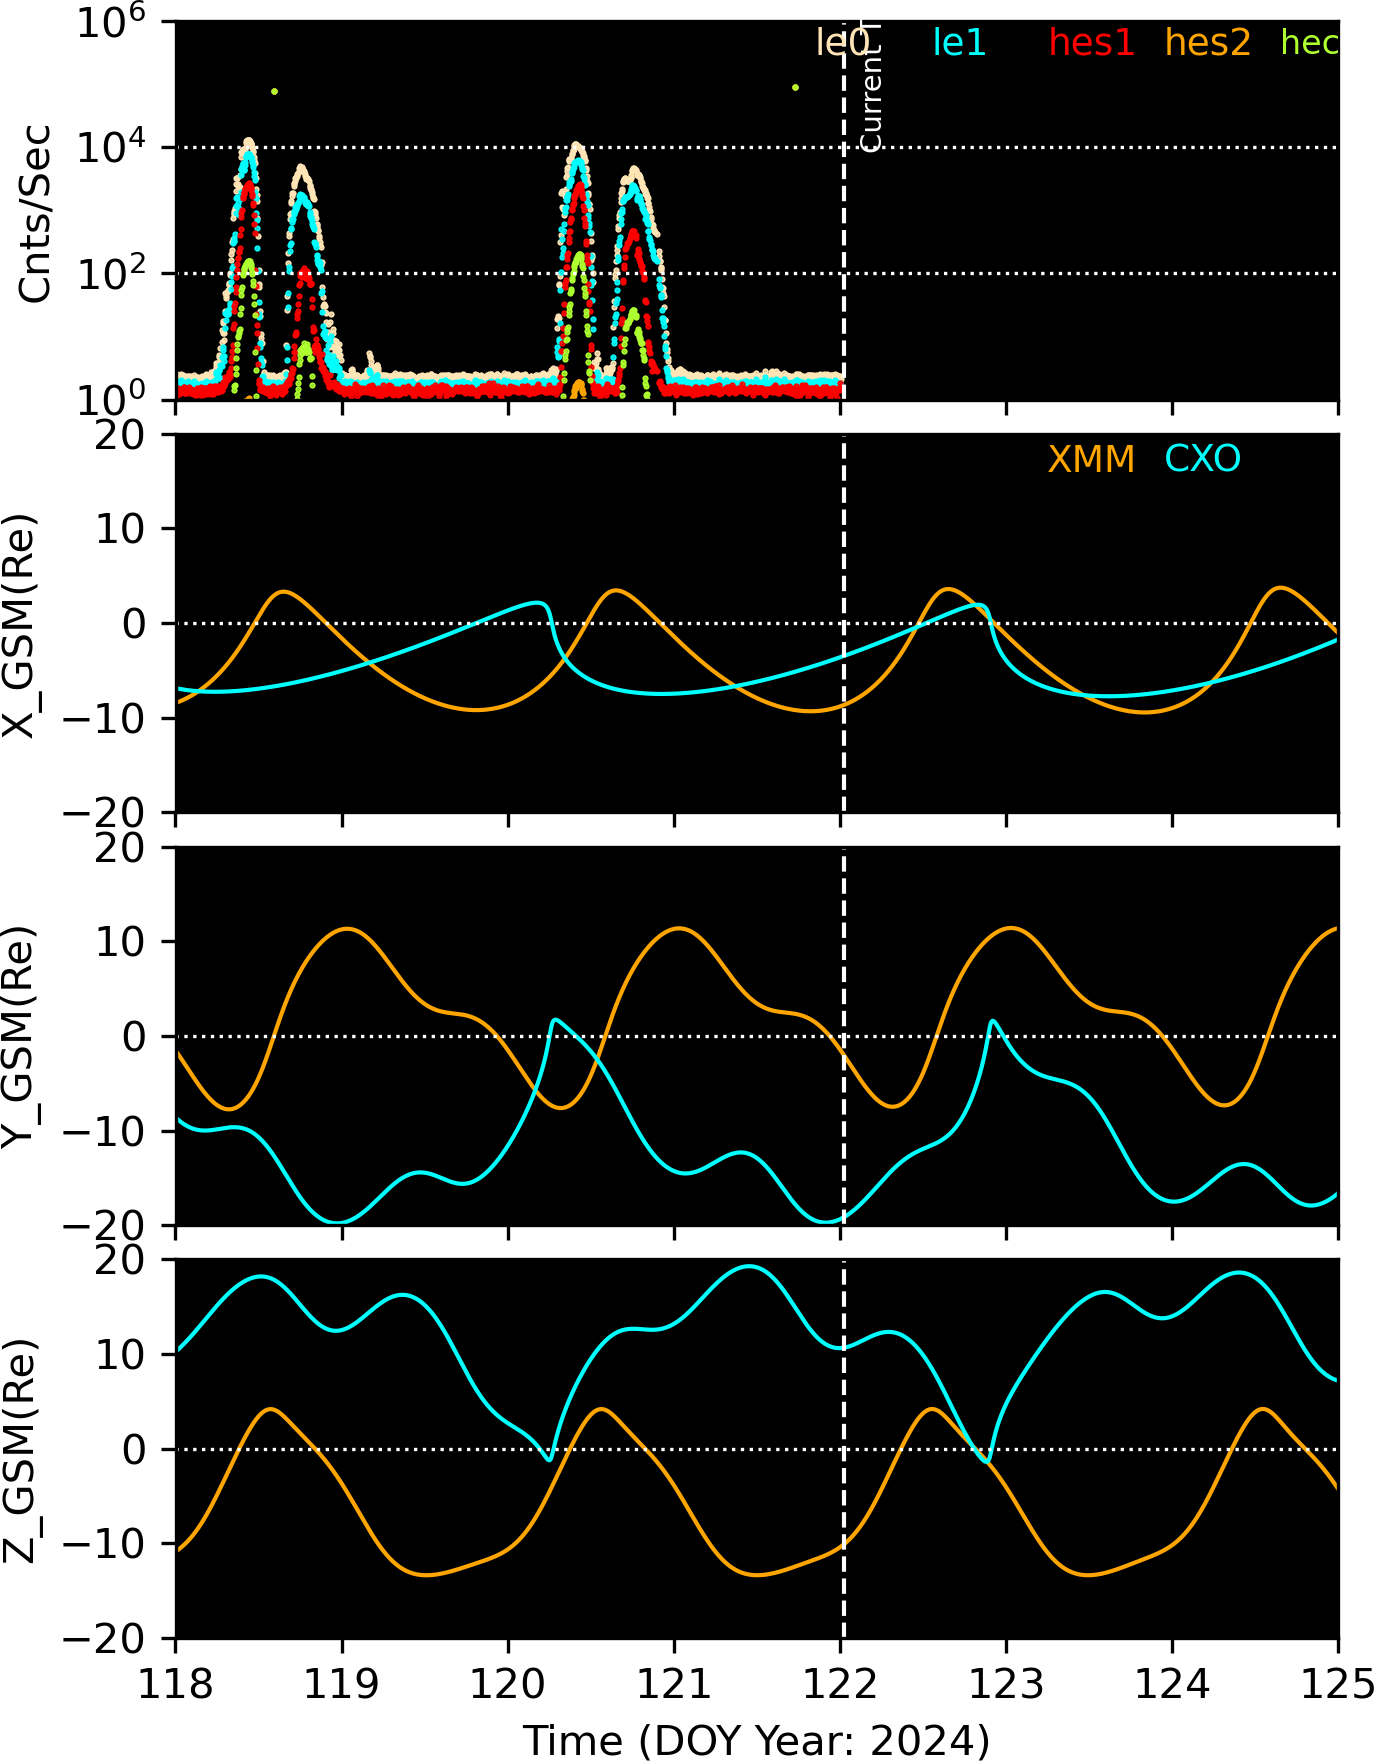
The following plots show the orbits of CXO and XMM in GSM coordinates. The left plot is in X-Y plane, and the right plot is in X-Z plane. If the orbit is in green, the satellite is in the solar wind area, if it is in light blue, the satellite is in magnetosheath, and if it is in yellow, the satellite is in magnetosphere.
The periods of the plotted orbits are +/-1.35 days from the current satellite positions (*), and the orange pentagon (*) mark the positions of one day ago.
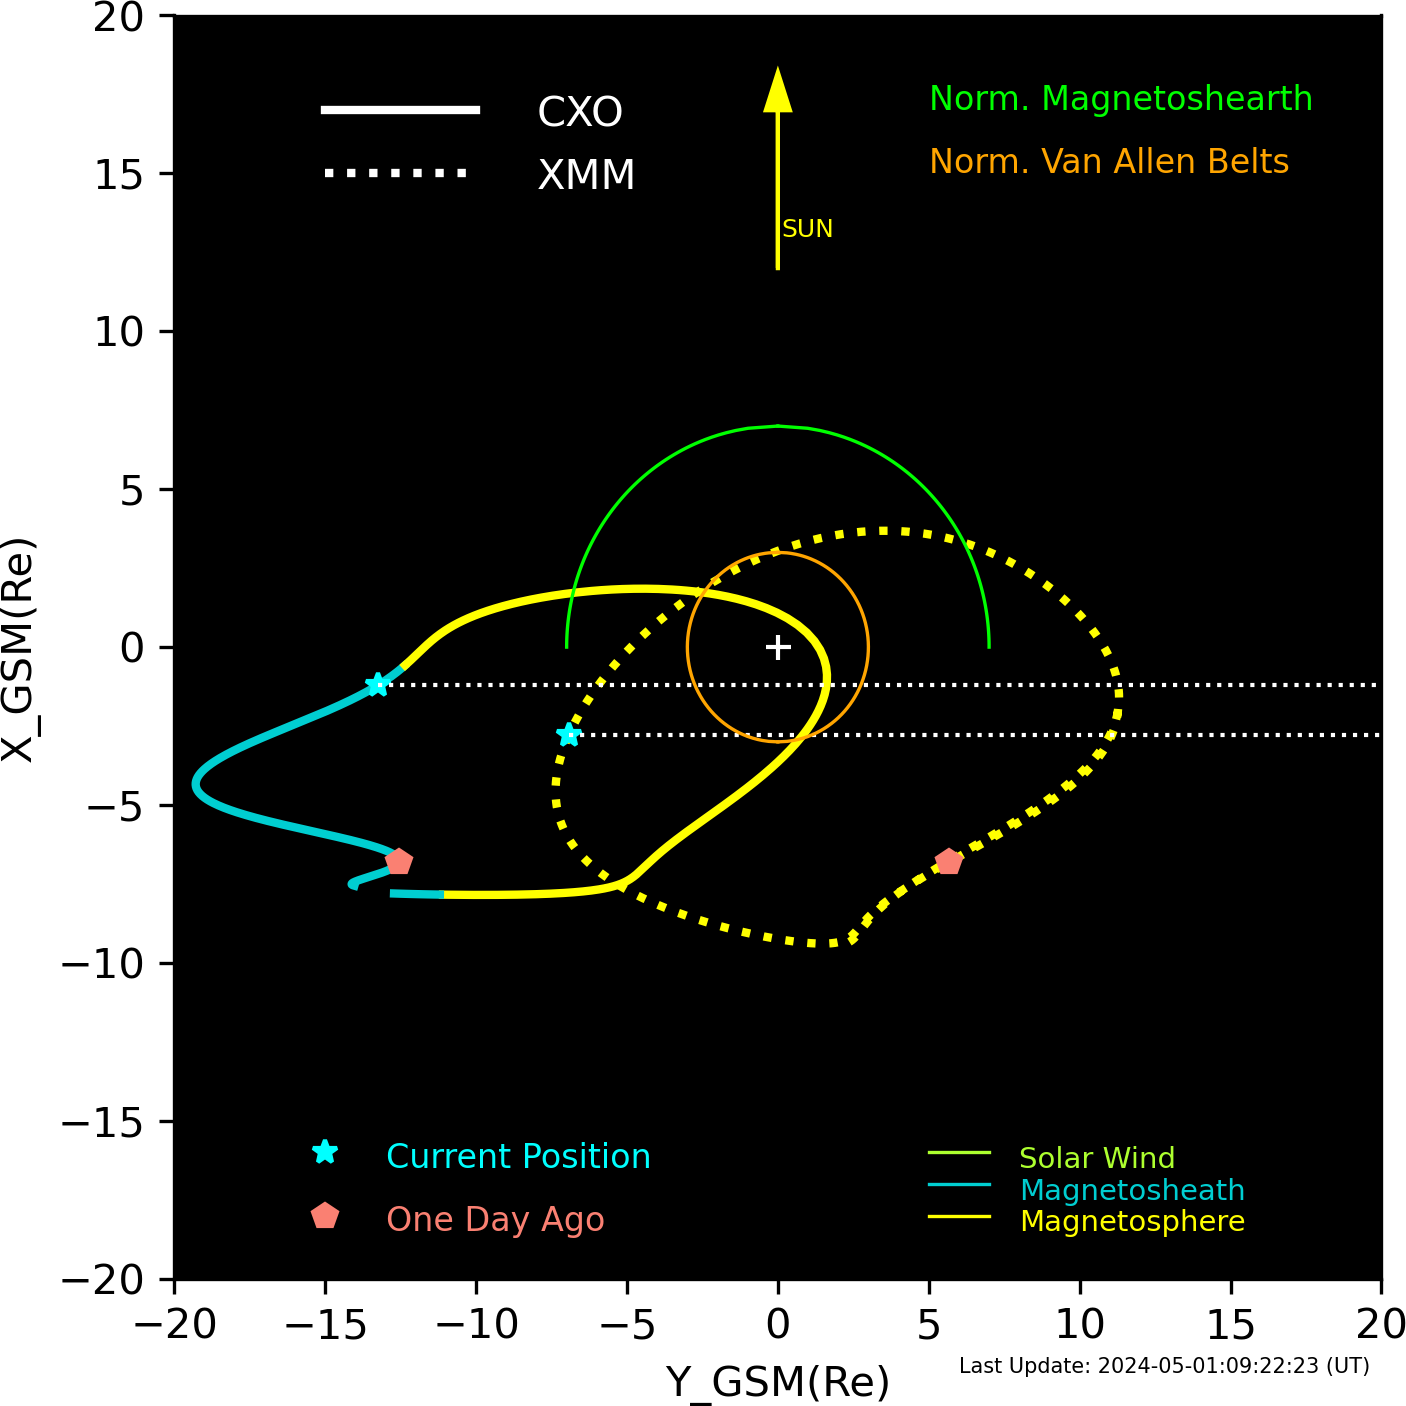
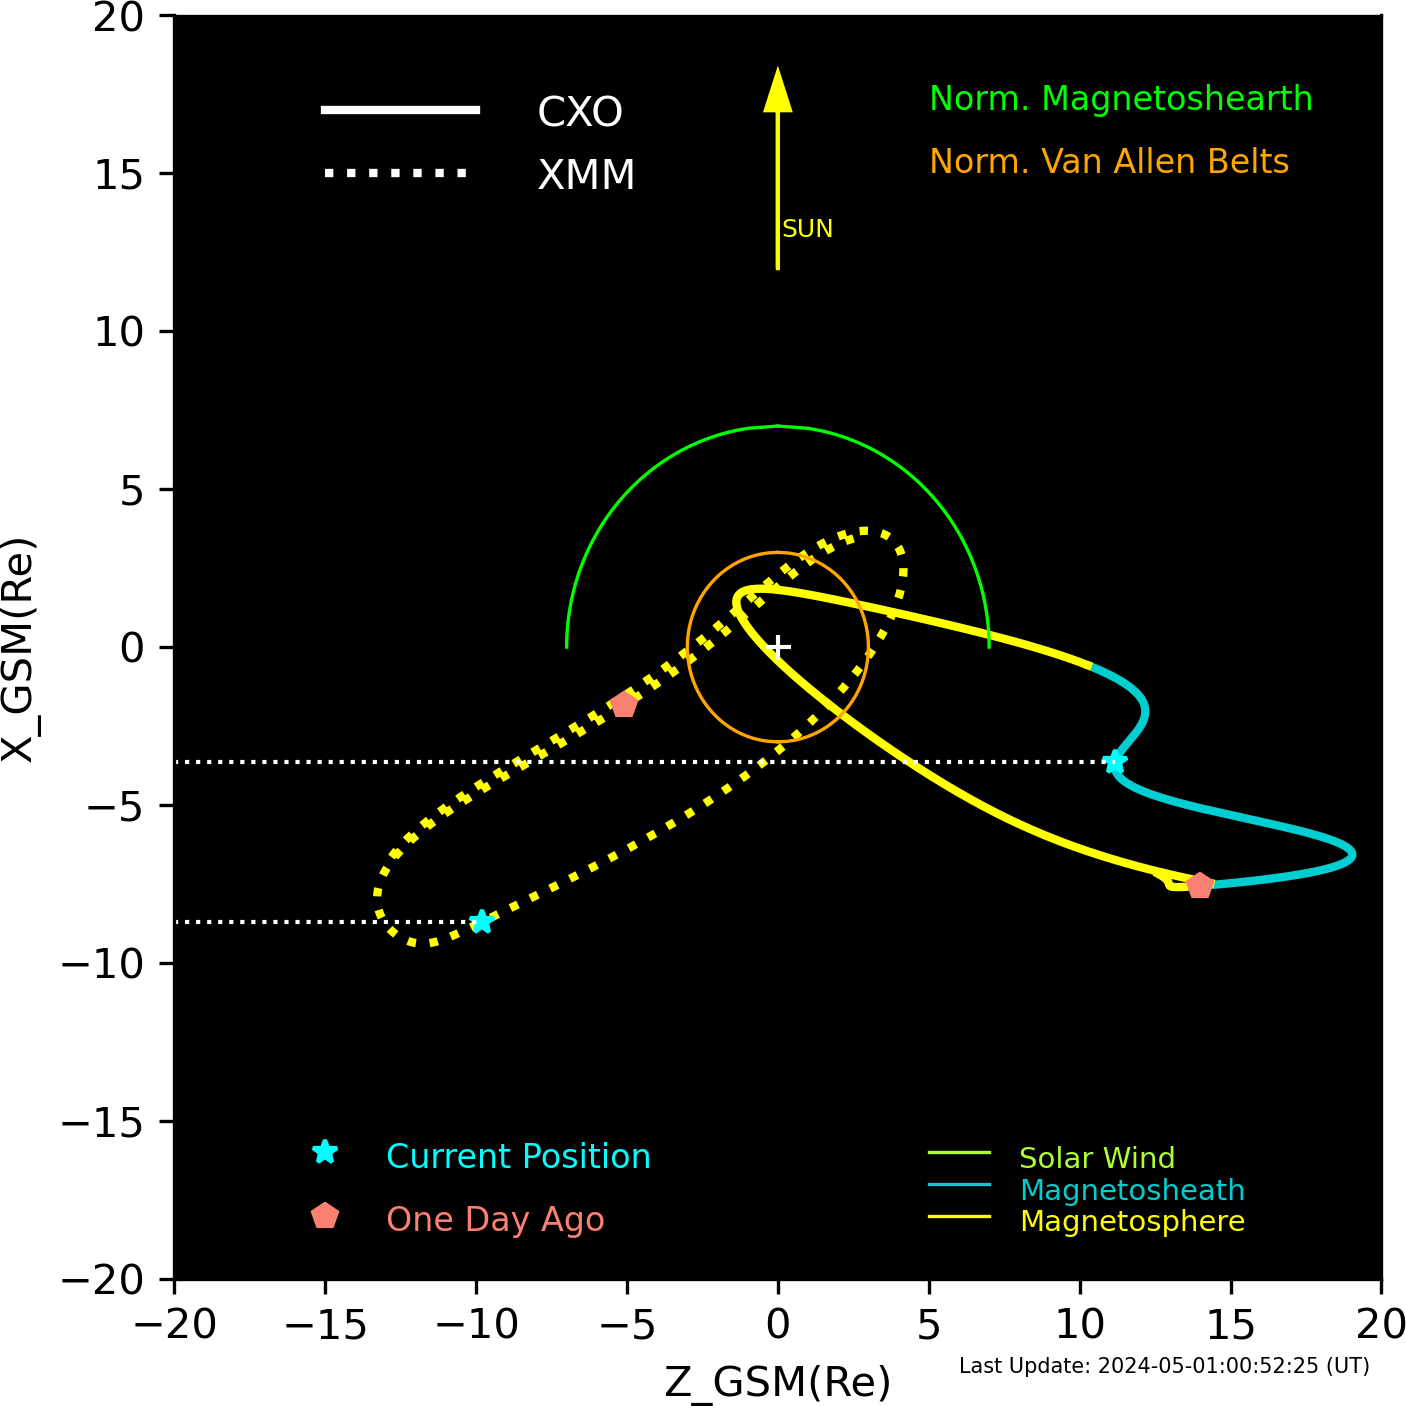
XMM and CXO orbits in GSM coordinates.
Email problems to: swolk
(Scott Wolk)
...it is all his fault