MTA Monitoring Report 04/21/06 - 04/27/06

Archive of all weekly reports

Archive of monthly reports

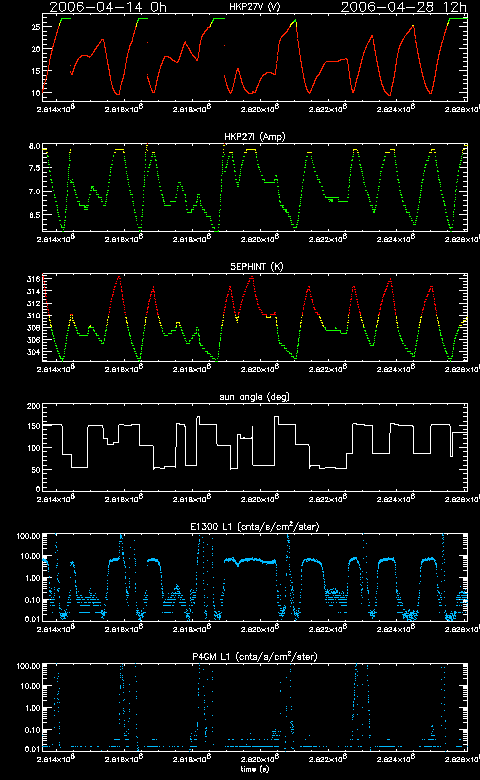
Radiation

Quiet.

Detrended CTI

The values quoted below are temperature factor corrected ones.
Average of ACIS-I CCDs (MnKa) slope 3.701e-9 CTI/day
Detrended slope 7.465e-9 CTI/day

ACIS Warm Pixels

We display all bad pixels showed up in past, and, if any, previously unknown bad pixels appeared in the last 14 days. We also list hot pixels (defined as 1000 above the average of bias background). Warm columns 509-514 are probably due to a computational artificial effect due to boundaries.


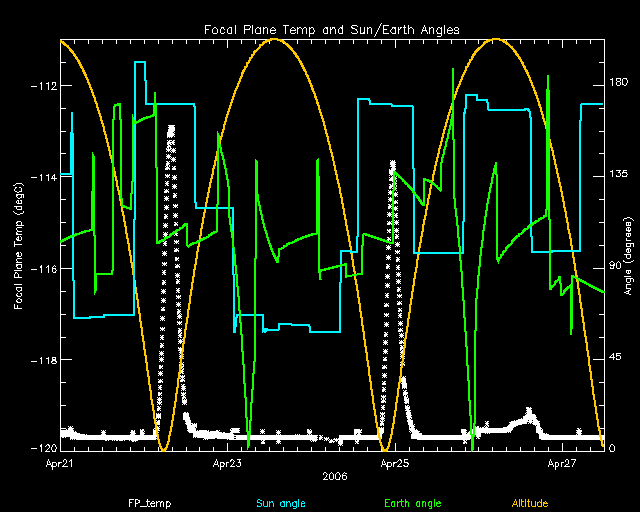
ACIS Focal Plane Temperature

SIM Movements

11 TSC moves this period
weekly average time/step 0.00139 s
mission average time/step 0.00136 s

Telemetry

IRUs


Recent Observations


OBSID DETECTOR GRATING TARGET ANALYSIS ACA
7050 ACIS-I NONE AX J2027.6+4116 OK OK
7327 ACIS-I NONE SMC Deep Field 1 OK OK
6841 ACIS-S NONE 3C327 OK OK
7148 ACIS-S NONE NGC4701 OK OK
7155 ACIS-I NONE SMC Deep Field 1 OK OK
6805 ACIS-S NONE SDSSJ1243-0232 OK OK
6895 ACIS-S HETG M81* OK /Grat OK
6472 HRC-S LETG Capella CAL /Grat OK
6418 ACIS-S NONE V1118 Ori OK OK
6870 ACIS-S NONE NGC 1365 OK OK
7324 ACIS-I NONE A3112_OFF OK OK
7322 ACIS-I NONE IC1262 OK OK
7323 ACIS-I NONE A3112_OFF OK OK
7018 ACIS-I NONE ELAIS-S1 C OK OK
6734 ACIS-S NONE 1E 1048.1-5937 CC OK
6869 ACIS-S NONE NGC 1365 OK OK
6674 ACIS-S NONE XMMU J140145-612306 OK OK
7321 ACIS-I NONE IC1262 OK OK
7297 HRC-S LETG Capella CAL /Grat OK

Trending

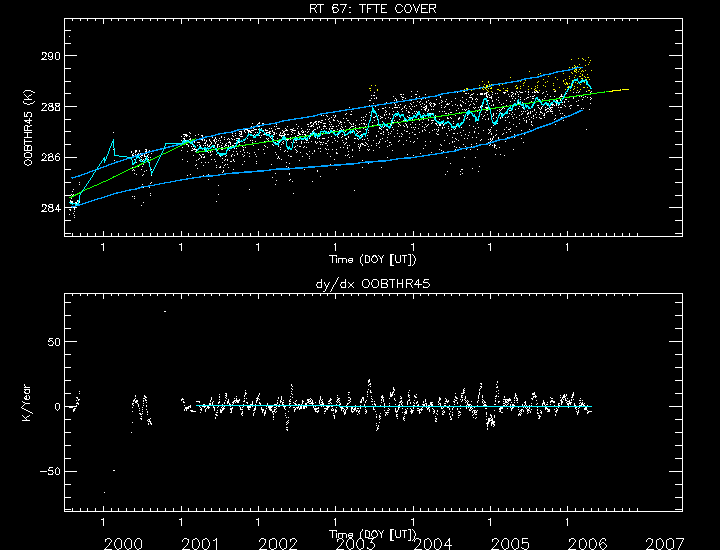
This Week's focus is OBA Thermal.

Trends last reported on Feb 03.

Only the most interesting or representative msids are shown below. For a full listing choose the bulletted link.

We have added min/max envelopes in dark blue to the trending plots. The envelopes are 4th degree fits to the monthly minimum and maximum values for each MSID. The final polynomial form and binning are still being experimented with. We will soon add to the trending pages a report of the fits and predictions they give on future limit violations. The light blue curve is our original smoothing of all the data over 30 day moving boxcars. The green/yellow line is a linear fit to all the data; the break occurs at a limit change.