MTA Monitoring Report 06/01/07 - 06/07/07

Archive of all weekly reports

Archive of monthly reports

Radiation

Quiet.

Detrended CTI

Although we have quoted CTI values of the cleanest data (FT <= -119.7 C, int time > 7000sec), the data fills these conditions are getting rare. From this week, we quote CTI temperature factor corrected ones. The values in the parentheses are CTI based on the cleanest data.

Average of ACIS-I CCDs (MnKa) slope: 2.154e-9 CTI/day (3.126e-9 CTI/day)
Detrended slope: 7.009e-9 CTI/day(7.456e-9 CTI/day)

ACIS Warm Pixels

We display all bad pixels showed up in past, and, if any, previously unknown bad pixels appeared in the last 14 days. We also list hot pixels (defined as 1000 above the average of bias background). Warm columns 509-514 are probably due to a computational artificial effect due to boundaries.


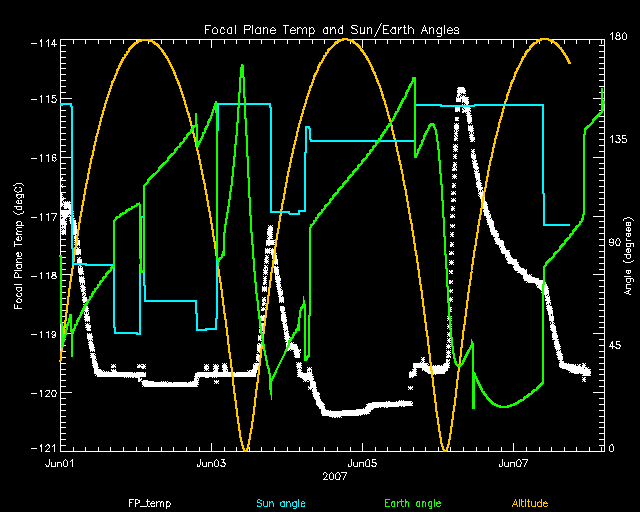
ACIS Focal Plane Temperature

SIM Movements

4 TSC moves this period
weekly average time/step 0.00127 s
mission average time/step 0.00135 s

Telemetry

New violations or new extrema are shown in blue cells.
MSID 06/01/07 06/02/07 06/03/07 06/04/07 06/05/07 06/06/07 06/07/07 yellow limits
(lower)
upper
red limits
(lower)
upper
Units Description
1CRAT 150.00   150.00     152.40   (143.16)
148.16
(131.16)
183.16
K #COLD RADIATOR TEMP. A
1CRBT 150.00   150.00     152.40   (143.16)
148.16
(131.16)
183.16
K #COLD RADIATOR TEMP. B
1DPPWRA   (20.58) (19.98) (20.39)       (23.4)
59.5
(-999)
999
W # DPA POWER A
1DPPWRB   (7.23) (7.19) (7.56)       (18.2)
59.5
(-999)
999
W # DPA POWER B
5EPHINT 315.16 315.16   318.14       (261.0)
300.0
(258.0)
303.0
K #EPHIN TEMP
HKP27V (9.62) (9.50) (11.20) (9.38) (11.81) (22.53) (11.93) (25.91)
27.91
(24.91)
28.91
V #HK 27 Volts Rail - Voltage
HKP27I 7.80 7.80   7.88 7.80   7.96 (3.66)
5.24
(3.46)
5.44
AMP #HK 27 Volts Rail - Current
HKEBOXTEMP   320.29   322.29       (268.0)
308.0
(253.0)
343.0
K #EPHIN HOUSEKEEPING EBOX: TEMPERATURE (5EHSE300)
TEIO 333.98 335.56           (253.0)
320.2
(250.2)
323.0
K #EPHIN ELECTRONICS HOUSING TEMP
TEPHIN 316.12 316.12   318.59       (260.8)
300.2
(258.0)
303.0
K #EPHIN SENSOR HOUSING TEMP
3FAMYZAT 308.14 308.77 308.77         (253.0)
308.0
(225.0)
353.0
K #FA STRUCTURE +X FACE AT -Y-Z END ABORT HTR. FA6 TEMP
3RCTUBPT 293.95 294.46 294.46         (253.0)
293.0
(230.5)
315.5
K #RCTU BASEPLATE (+X)
3TTHRC1T 296.97 296.97 296.97         (243.0)
293.0
(218.5)
353.0
K #TT AT HRC BIPOD ATTACH #1
3TTHRC2T 299.49 299.49 299.99         (243.0)
293.0
(218.5)
353.0
K #TT AT HRC BIPOD ATTACH #2
PSUTEMP     322.15         (313.8)
321.85
(312.6)
323.05
K #SEA power supply temperature (3FAPSAT)
BOXTEMP   293.15 294.15         (278.0)
292.0
(276.0)
294.0
K #SEA box temperature
TCYLAFT1   299.00 300.03         (260.8)
294.1
(227.4)
349.7
K #CNT CYL TEMP:16-IN FWD OF SC-TS FIT-1
TCYLAFT6   299.00 299.51         (260.8)
294.1
(227.4)
349.7
K #CNT CYL TEMP:16-IN FWD OF SC-TS FIT-6
TFSSBKT1 344.98 346.55 344.98         (237.4)
333.0
(223.0)
348.0
K #FSS BRACKET-1 TEMP (+Y)
TFSSBKT2 344.98 346.55 344.98         (237.4)
333.0
(223.0)
348.0
K #FSS BRACKET-2 TEMP (-Y)
TMZP_CNT   340.27 340.27         (237.4)
327.4
(227.4)
349.7
K #-Z PNL TEMP:CENTER
TRSPMTPC   296.42 296.93         (260.8)
294.1
(216.3)
349.7
K #RAD SHR PNL TEMP:TTWN MUPS AND PCAD
TSCTSF1     295.45         (260.8)
294.1
(253.0)
303.0
K #SC-TS FITTING -1 TEMP
4RT577T 289.44 289.74 289.13 289.13       (281.9)
288.6
(250.2)
308.0
K #RT 577 - OB CONE TEMP
4RT581T   289.44 289.13         (281.9)
288.6
(250.2)
308.0
K #RT 581 - OB CONE TEMP
4RT584T 289.26 289.26 289.26 289.51 289.51 289.26 288.75 (281.9)
288.6
(250.2)
308.0
K #RT 584 - STRUT TEMP
4RT590T   289.26 290.01 289.26 289.00     (281.9)
288.6
(250.2)
308.0
K #RT 590 - STRUT TEMP
4RT591T   289.26 290.27 289.76 289.76 289.00   (281.9)
288.6
(250.2)
308.0
K #RT 591 - STRUT TEMP
4RT700T       288.83       (281.9)
288.6
(250.2)
308.0
K #RT 700 - OB BULKHEAD TEMP
4RT709T 286.07 286.07   286.07 286.07     (281.9)
285.8
(250.2)
308.0
K #RT 709 - OB BULKHEAD TEMP
4RT710T 286.69 286.69 286.38 286.69 286.69 286.38 286.07 (281.9)
285.8
(250.2)
308.0
K #RT 710 - OB BULKHEAD TEMP
4RT711T 286.69 286.69 286.69 286.99 286.99 286.38 286.38 (281.9)
285.8
(250.2)
308.0
K #RT 711 - OB BULKHEAD TEMP
OHRTHR38 288.63 288.74 288.63 288.85 288.79     (285.8)
288.6
(255.2)
308.0
K #RT 120: HRMA AFT COLLIMATOR OUTER CYLINDER
OOBTHR04 288.98 289.07 289.16 289.33 289.33 289.16   (281.9)
288.6
(250.2)
308.0
K #RT 27: HRMA STRUT
OOBTHR05       289.71 289.71 289.58   (281.9)
288.6
(250.2)
308.0
K #RT 28: HRMA STRUT
OOBTHR26 288.81 289.29 288.90         (281.9)
288.6
(250.2)
308.0
K #RT 48: OBA CONE
OOBTHR27   288.63           (281.9)
288.6
(250.2)
308.0
K #RT 49: OBA CONE
OOBTHR28   288.99 288.86         (281.9)
288.6
(250.2)
308.0
K #RT 50: OBA CONE
OOBTHR31 292.51 293.21 293.16         (281.9)
289.7
(250.2)
308.0
K #RT 53: OBA AFT BULKHEAD
OOBTHR39       287.21       (281.9)
285.8
(250.2)
308.0
K #RT 61: TFTE CONE
OOBTHR45 290.11 289.76 289.98 290.63 290.24 289.15 289.89 (281.9)
288.6
(250.2)
308.0
K #RT 67: TFTE COVER
OOBTHR51   288.81 289.46 288.98 288.68     (281.9)
288.6
(250.2)
308.0
K #RT 77: S/C STRUT
OOBTHR52   288.93 289.79 289.49 289.40     (281.9)
288.6
(250.2)
308.0
K #RT 78: S/C STRUT
OOBTHR56 293.03   293.03 293.74     293.03 (281.9)
288.6
(250.2)
308.0
K #RT 158: OBA CONE
OOBTHR57 293.12 293.92 293.83 290.08       (281.9)
288.6
(250.2)
308.0
K #RT 150: OBA CONE

IRUs


Recent Observations


OBSID DETECTOR GRATING TARGET ANALYSIS ACA
8490 ACIS-01236 NONE Centaurus A Jet OK OK
7888 ACIS-235678 NONE ESO 60-IG016 OK OK
7995 ACIS-012367 NONE C-COSMOS1-1 OK OK
7936 ACIS-01236 NONE NGC2563-P13 OK OK
7455 ACIS-235678 NONE SDSS J1411+4812 OK OK
8190 ACIS-7 NONE M82 ULX OK OK
7067 ACIS-012367 NONE M31-Center OK OK
7068 ACIS-012367 NONE M31-Center OK OK
8257 ACIS-7 NONE 4C52.37 OK OK
8256 ACIS-23678 NONE 2MASX J154228+525950 OK OK
7791 ACIS-7 NONE RXJ1131-1231 OK OK
7873 ACIS-7 NONE J1421-0643 OK OK
7940 ACIS-01236 NONE Abell 2204 OK OK
7728 ACIS-235678 NONE NGC5905 OK OK
8254 ACIS-23678 NONE 2MASX J091201+532036 OK OK

Trending

This week's focus is Ground Computations.

Trends last reported on Mar 15.

Only the most interesting or representative msids are shown below. For a full listing choose the bulletted link.

Min/max envelopes in dark blue appear on the trending plots. The envelopes are 4th degree fits to the monthly minimum and maximum values for each MSID. The final polynomial form and binning are still being experimented with. We will soon add to the trending pages a report of the fits and predictions they give on future limit violations. The light blue curve is our original smoothing of all the data over 30 day moving boxcars. The green/yellow line is a linear fit to all the data; the break occurs at a limit change.