MTA Monitoring Report 11/07/08 - 11/13/08

Archive of all weekly reports

Archive of monthly reports

Radiation

Quiet.

Detrended CTI

Although we have quoted CTI values of the cleanest data (FT <= -119.7 C, int time > 7000sec), the data fills these conditions are getting rare. From this week, we quote CTI temperature factor corrected ones. The values in the parentheses are CTI based on the cleanest data.

Average of ACIS-I CCDs (MnKa) slope: 1.375e-9 CTI/day (1.697e-9 CTI/day)
Detrended slope: 7.079e-9 CTI/day(7.290e-9 CTI/day)

ACIS Warm Pixels

We display all bad pixels showed up in past, and, if any, previously unknown bad pixels appeared in the last 14 days. We also list hot pixels (defined as 1000 above the average of bias background). Warm columns 509-514 are probably due to a computational artificial effect due to boundaries.


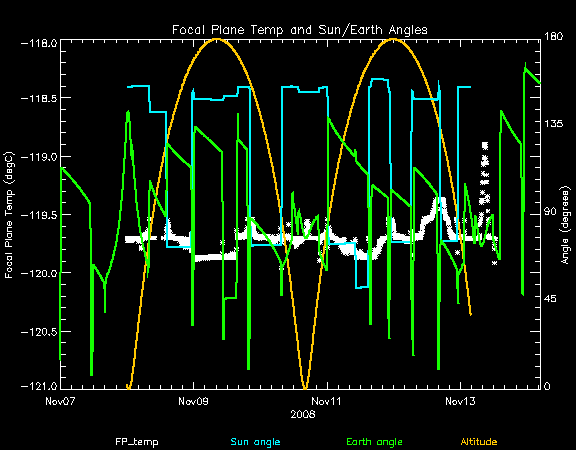
ACIS Focal Plane Temperature

SIM Movements

8 TSC moves this period
weekly average time/step 0.00134 s
mission average time/step 0.00134 s

Telemetry

New violations or new extrema are shown in blue cells.
MSID 11/07/08 11/08/08 11/09/08 11/10/08 11/11/08 11/12/08 11/13/08 yellow limits
(lower)
upper
red limits
(lower)
upper
Units Description
1CBAT (203.40) (203.40) (203.40) (203.40) (203.40) (203.40) (203.40) (210.16)
216.16
(197.66)
223.16
K #CAMERA BODY TEMP. A
1CBBT (203.40) (203.40) (203.40) (203.40) (203.40) (205.86) (203.40) (210.16)
216.16
(197.66)
223.16
K #CAMERA BODY TEMP. B
1DPPWRA (20.20) (20.58) (20.20)         (23.4)
59.5
(-999)
999
W # DPA POWER A
1DPPWRB (7.57) (7.28) (7.57)   (7.39)     (18.2)
59.5
(-999)
999
W # DPA POWER B
5EPHINT 318.56 318.14 318.14 318.99 318.14 319.42 319.42 (261.0)
300.0
(258.0)
303.0
K #EPHIN TEMP
HKEBOXTEMP 322.29 322.97 321.61 323.67 323.67 324.39 323.67 (268.0)
308.0
(253.0)
343.0
K #EPHIN HOUSEKEEPING EBOX: TEMPERATURE (5EHSE300)
HKFBIASLEAKI 3.29 3.50 3.23 3.75 3.56 3.88 3.67 (-100.0)
2.0
(-200.0)
3.0
uA #EPHIN HOUSEKEEPING F-BIAS: LEAKAGE CURRENT (5EHSE900)
TEIO 335.56 338.70 333.98 338.70 338.70 338.70   (253.0)
320.2
(250.2)
323.0
K #EPHIN ELECTRONICS HOUSING TEMP
TEPHIN 318.59 318.59 316.94 320.24 319.42 320.24 318.59 (260.8)
300.2
(258.0)
303.0
K #EPHIN SENSOR HOUSING TEMP
AORWSPD1 445.44     461.79       (-419.0)
419.0
(-471.0)
471.0
RPS #REACTION WHEEL RATES
TSCTABADC (0.05)             (4.82)
5.03
(4.80)
5.05
converter #TSC Tab Position Sensor A/D
3TSMXSPT         283.26 283.26   (203.0)
283.0
(148.0)
353.0
K #-X TURTLE SHELL NR ACIS SS
3TTHRC1T         294.96     (243.0)
293.0
(218.5)
353.0
K #TT AT HRC BIPOD ATTACH #1
3TTHRC2T         298.48     (243.0)
293.0
(218.5)
353.0
K #TT AT HRC BIPOD ATTACH #2
BOXTEMP       293.15       (278.0)
292.0
(276.0)
294.0
K #SEA box temperature
TFSSBKT1 346.67 351.03 346.67 351.03 351.03 351.03   (237.4)
333.0
(223.0)
348.0
K #FSS BRACKET-1 TEMP (+Y)
TFSSBKT2 346.67 351.03 348.63 351.03 351.03 351.03   (237.4)
333.0
(223.0)
348.0
K #FSS BRACKET-2 TEMP (-Y)
TMZLGABM           328.72   (244.1)
321.9
(208.0)
388.0
K #-Z LOW-GAIN ANTENNA BOOM TEMP
TMZP_CNT   341.12   342.75 341.12 342.75   (237.4)
327.4
(227.4)
349.7
K #-Z PNL TEMP:CENTER
TB1T1         (270.09)     (270.2)
298.0
(268.0)
300.8
K #BATT 1 TEMP 1
4RT581T   288.83   289.13 289.74     (281.9)
288.6
(250.2)
308.0
K #RT 581 - OB CONE TEMP
4RT590T 289.00 289.00 288.75 288.75 288.75 289.76 289.51 (281.9)
288.6
(250.2)
308.0
K #RT 590 - STRUT TEMP
4RT700T 288.83 288.83 288.83 289.13 289.13 288.83 288.83 (281.9)
288.6
(250.2)
308.0
K #RT 700 - OB BULKHEAD TEMP
OOBTHR19   288.67   288.93 288.84     (281.9)
288.6
(250.2)
308.0
K #RT 41: OBA CONE
OOBTHR26 288.72 289.50 288.98 289.81 289.59 288.98 288.98 (281.9)
288.6
(250.2)
308.0
K #RT 48: OBA CONE
OOBTHR27       288.76 288.98     (281.9)
288.6
(250.2)
308.0
K #RT 49: OBA CONE
OOBTHR28   288.73   289.16 289.25     (281.9)
288.6
(250.2)
308.0
K #RT 50: OBA CONE
OOBTHR31   291.81   291.98 293.60 290.81   (281.9)
289.7
(250.2)
308.0
K #RT 53: OBA AFT BULKHEAD
OOBTHR39 287.34 287.34 287.34 287.42 287.38 287.38 287.42 (281.9)
285.8
(250.2)
308.0
K #RT 61: TFTE CONE
OOBTHR51 288.81 288.68       289.37 289.16 (281.9)
288.6
(250.2)
308.0
K #RT 77: S/C STRUT
OOBTHR57 290.62 293.65 291.24 293.83 294.55 292.76 290.80 (281.9)
288.6
(250.2)
308.0
K #RT 150: OBA CONE

IRUs


Recent Observations


OBSID DETECTOR GRATING TARGET ANALYSIS ACA
9637 HRC-S NONE Vega CAL OK
10765 ACIS-456789 HETG SS73 17 OK OK
10798 ACIS-01236 NONE NGC 1232 OK OK
10777 ACIS-456789 HETG NGC 4051 OK OK
10380 ACIS-7 NONE 0106+013 OK OK
9099 ACIS-235678 NONE SN 2005bx OK OK
10775 ACIS-456789 HETG NGC 4051 OK OK
10799 ACIS-7 NONE 0106+013 OK OK
9928 ACIS-7 NONE GM Aur OK OK
9225 ACIS-23678 NONE SDSS J0148+0001 OK OK
10403 ACIS-456789 HETG NGC 4051 OK OK
10778 ACIS-456789 HETG NGC 4051 OK OK
9240 ACIS-23678 NONE RXJ1131-1231 OK OK
10440 ACIS-01236 NONE RX J0142.0+2131 OK OK
10776 ACIS-456789 HETG NGC 4051 OK OK
10562 ACIS-235678 NONE NGC 470 HLX-1 OK OK
10404 ACIS-456789 HETG NGC 4051 OK OK

Trending

This week's focus is PCAD.

Last reported on Aug 21.

Only the most interesting or representative msids are shown below. For a full listing choose the bulletted link.

Min/max envelopes in dark blue appear on the trending plots. The envelopes are 4th degree fits to the monthly minimum and maximum values for each MSID. The final polynomial form and binning are still being experimented with. We will soon add to the trending pages a report of the fits and predictions they give on future limit violations. The light blue curve is our original smoothing of all the data over 30 day moving boxcars. The green/yellow line is a linear fit to all the data; the break occurs at a limit change.