| Day (DOY) | Temp (C) | Width (Days) | |
|---|---|---|---|
| 150.78 | -115.02 | 0.27 | |
| 153.01 | -118.80 | 0.93 | |
| 153.40 | -115.51 | 0.25 |
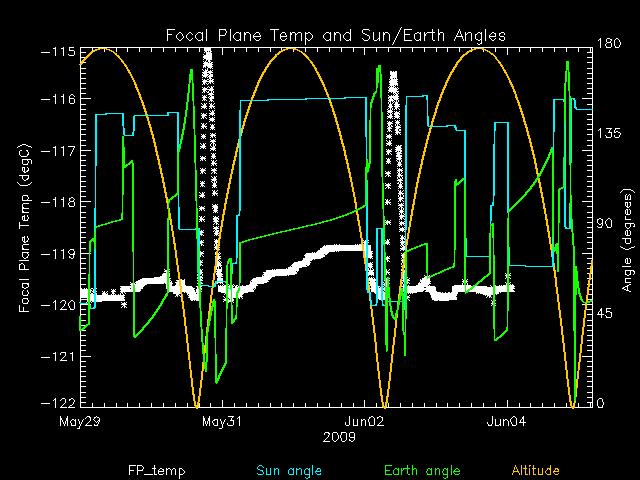
Weekly focal plane temperature with sun angle, earth angle, and altitude overplotted. Sun angle is the solar array angle, that is the angle between the sun and the optical axis (+X axis). The earth angle is the angle between earth and the ACIS radiator (+Z axis). Altitude varies from 34 kkm to 128 kkm.
)
)
)
)
)
)
)
)
)
)
)
)
)
)
)
)
)
)
)
)
)
)
)
)
)
)
)
)
)
)
)
)
)
)
)
)
)