MTA Monitoring Report 07/31/09 - 08/06/09

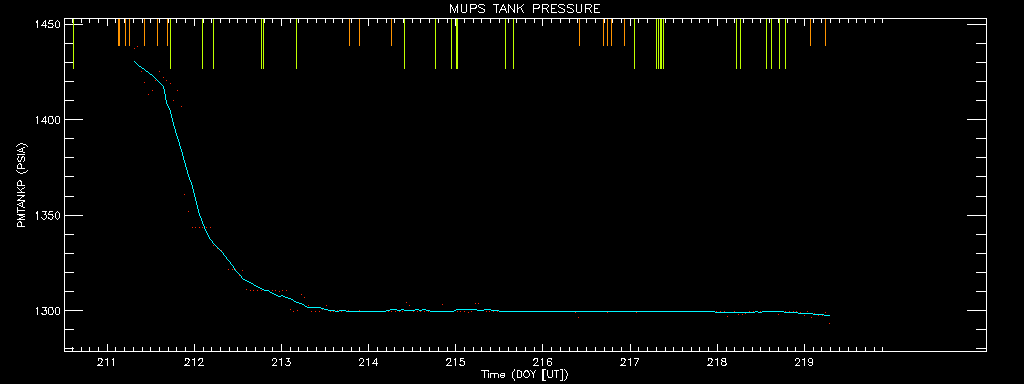
MUPS Tank Pressure (PMTANKP)


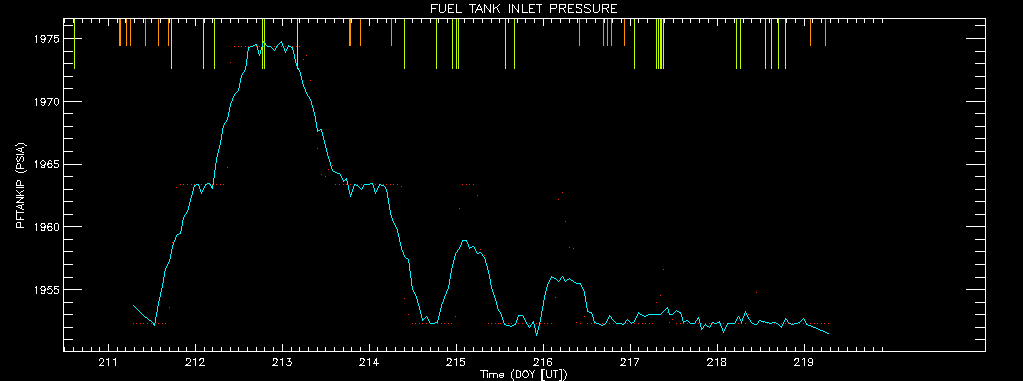
Fuel Tank Inlet Pressure (PFTANKIP)


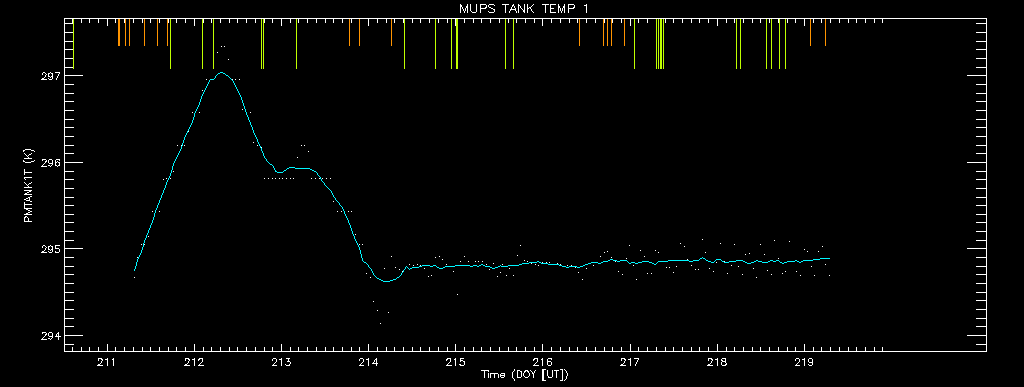
MUPS Tank Temperature (PMTANK1T)


Archive of all weekly reports

Archive of monthly reports

Radiation

Quiet.

Detrended CTI

Although we have quoted CTI values of the cleanest data (FT <= -119.7 C, int time > 7000sec), the data fills these conditions are getting rare. We quote CTI temperature factor corrected ones. The values in the parentheses are CTI based on the cleanest data.

Average of ACIS-I CCDs (MnKa) slope: 1.344e-9 CTI/day (1.520e-9 CTI/day)
Detrended slope: 7.270e-9 CTI/day(7.272e-9 CTI/day)

ACIS Warm Pixels

We display all bad pixels showed up in past, and, if any, previously unknown bad pixels appeared in the last 14 days. We also list hot pixels (defined as 1000 above the average of bias background). Warm columns 509-514 are probably due to a computational artificial effect due to boundaries.


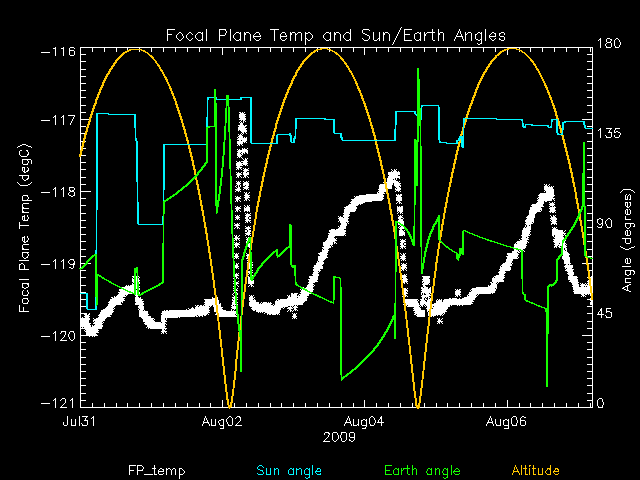
ACIS Focal Plane Temperature

SIM Movements

10 TSC moves this period
weekly average time/step 0.00136 s
mission average time/step 0.00134 s

Telemetry

New violations or new extrema are shown in blue cells.
MSID 07/31/09 08/01/09 08/02/09 08/03/09 08/04/09 08/05/09 08/06/09 yellow limits
(lower)
upper
red limits
(lower)
upper
Units Description
5EPHINT 321.63 323.97 316.86 317.71 318.56 316.01 314.30 (261.0)
300.0
(258.0)
303.0
K EPHIN TEMP
HKEBOXTEMP 327.38 328.96 321.61 322.29 322.97 320.29   (268.0)
308.0
(253.0)
343.0
K EPHIN HOUSEKEEPING EBOX: TEMPERATURE (5EHSE300)
HKFBIASLEAKI 4.88 4.88 3.23 3.41 3.71 2.89 2.51 (-100.0)
2.0
(-200.0)
3.0
uA EPHIN HOUSEKEEPING F-BIAS: LEAKAGE CURRENT (5EHSE900)
TEIO 338.70 340.27           (253.0)
320.2
(250.2)
323.0
K EPHIN ELECTRONICS HOUSING TEMP
TEPHIN 322.36 324.48 316.94 316.94 318.59 315.29   (260.8)
300.2
(258.0)
303.0
K EPHIN SENSOR HOUSING TEMP
3RCTUBPT 294.96             (234.1)
276.3
(231.6)
278.8
K RCTU BASEPLATE (+X)
TFSSBKT1 348.63 348.63           (233.0)
345.2
(223.0)
348.0
K FSS BRACKET-1 TEMP (+Y)
TFSSBKT2 348.63 348.63           (233.0)
345.2
(223.0)
348.0
K FSS BRACKET-2 TEMP (-Y)
4RT584T 290.52 290.77 290.77         (281.9)
290.0
(250.2)
308.0
K RT 584 - STRUT TEMP
4RT591T 292.31 292.31 292.05         (281.9)
292.0
(250.2)
308.0
K RT 591 - STRUT TEMP
OOBTHR04 290.25 290.64 290.59         (281.9)
290.0
(250.2)
308.0
K RT 27: HRMA STRUT
OOBTHR05 290.49 290.88 290.84         (281.9)
290.0
(250.2)
308.0
K RT 28: HRMA STRUT
OOBTHR45 292.07 292.42           (281.9)
292.0
(250.2)
308.0
K RT 67: TFTE COVER
OOBTHR56 295.62 295.89           (281.9)
295.0
(250.2)
308.0
K RT 158: OBA CONE


Pitch Angle and System Temperature

This is a test implementation, not all #'s have been verified.
On the weekly plots, long green ticks indicate obsid starts. The shorter orange ticks indicate rad zone events.

The following table shows the maximum temperature (in K) appeared during the observations. All data are taken between Jul 07 and July 13, 2009- DOY 188-194.
Pitch Angle 60 - 75 75 - 90 90 - 110 110 - 130 130 - 145
TFSSBKT1 351.0 344.7 348.6 343.1 342.7
TFSSBKT2 351.0 344.7 348.6 342.0 340.5
TEPHIN 322.3 317.7 324.4 324.4 324.4
TEIO 340.2 333.6 340.2 338.6 337.3
5EPHINT 320.6 316.4 323.5 323.5 323.9
HKEBOXTEMP 325.8 320.9 328.1 328.1 328.9
OHRTHR38 289.6 289.7 289.7 289.7 289.8
4RT568T 288.3 288.3 288.3 288.3 288.3
4PRT4AT 215.9 215.9 215.9 215.9 215.9
OOBTHR06 287.8 288.2 288.2 288.2 288.5
4RT583T 287.2 287.5 287.7 287.7 287.7
4RT586T 288.0 288.5 288.5 288.5 288.7
PLINE01T * 288.0 286.3 286.3 285.9 285.5
PLINE02T * 302.4 302.2 301.8 301.8 297.3
PLINE03T * 299.0 299.0 299.0 299.0 294.0

* PLINE temperatures are weekly minimum temps.

IRUs


Recent Observations


OBSID DETECTOR GRATING TARGET ANALYSIS ACA
10688 ACIS-235678 NONE G1.9+0.3 OK OK
10084 ACIS-7 NONE SWIFT J1756.9-2508 OK OK
10257 ACIS-5678 NONE SDSS J145503.94+515539.9 OK OK
10061 ACIS-456789 NONE 4U 1608-52 OK OK
10503 ACIS-7 NONE J1718-3718 OK OK
10060 ACIS-678 NONE NGC 6440 OK OK
10281 ACIS-456789 NONE 3C 268.3 CC OK
10053 ACIS-235678 NONE LS 5039 CC OK
10933 HRC-I NONE IGR J17254-3257 OK OK
10521 ACIS-7 NONE N49 OK OK
10767 ACIS-01236 NONE SPT-CL 2341-5119 OK OK
10808 ACIS-01236 NONE SPT-CL 2341-5119 OK OK
10372 ACIS-23567 NONE RCS2347-3535 OK OK
10484 ACIS-012367 NONE IGR J17419-2802 OK OK
10098 ACIS-012367 NONE G18.95-1.1 OK OK
10387 ACIS-235678 NONE AX J175404-2553 OK OK
10042 ACIS-235678 NONE Swift J195509.6+261406 OK OK
10932 ACIS-012367 NONE HESS J1741-302 CC OK
11799 HRC-I NONE IGR J17505-2644 OK OK
9345 HRC-I NONE IGR J17585-3057 OK OK
11730 HRC-I NONE IGR J17353-3539 OK OK
10930 ACIS-236789 NONE NGC 6681 OK OK
10382 ACIS-235678 NONE AX J181915-1601 OK OK
10689 ACIS-235678 NONE LS 5039 OK OK
10332 ACIS-235678 NONE SDSS J224749.55+134248.2 OK OK
10129 ACIS-012367 NONE NGC 7648 CC OK

Trending

This week's focus is Spacecraft Bus and Subsystem Trends.

Last reported on May 14.

Only the most interesting or representative msids are shown below. For a full listing choose the bulletted link.

Min/max envelopes in dark blue appear on the trending plots. The envelopes are 4th degree fits to the monthly minimum and maximum values for each MSID. The final polynomial form and binning are still being experimented with. We will soon add to the trending pages a report of the fits and predictions they give on future limit violations. The light blue curve is our original smoothing of all the data over 30 day moving boxcars. The green/yellow line is a linear fit to all the data; the break occurs at a limit change.