Archive of all weekly reports
Archive of monthly reports
Quiet.
Although we have quoted CTI values of the cleanest data (FT <= -119.7 C, int time > 7000sec), the data fills these conditions are getting rare. We quote CTI temperature factor corrected ones. The values in the parentheses are CTI based on the cleanest data.
| Average of ACIS-I CCDs (MnKa) slope: | 1.829e-9 CTI/day | (1.259e-9 CTI/day) |
|---|---|---|
| Detrended slope: | 7.386e-9 CTI/day | (7.211e-9 CTI/day) |
We display all bad pixels showed up in past, and, if any, previously unknown bad pixels appeared in the last 14 days. We also list hot pixels (defined as 1000 above the average of bias background). Warm columns 509-514 are probably due to a computational artificial effect due to boundaries.
| CCD0 | CCD1 | CCD2 | CCD3 | CCD4 | CCD5 | CCD6 | CCD7 | CCD8 | CCD9 | |
|---|---|---|---|---|---|---|---|---|---|---|
| Previously Unknown Bad Pixels | ||||||||||
| Current Warm Pixels | (153,205) (692,141) | (802,665) (910,239) | (206,757) (526,66) | (334,88) (811,637) | (247,364) (283,224) | (233,321) (233,322) (233,323) (233,324) (233,326) (263,317) (280,313) (352,544) (367,511) (369,376) (641,669) (669,577) (745,313) (792,313) | (843,420) (884,31) | (139,109) (157,47) (197,241) (587,544) (829,997) (833,325) (881,53) | (40,49) | |
| Flickering Warm Pixels | (153,205) | (802,665) (910,239) | (206,757) (526,66) | (334,88) (703,739) (811,637) | (247,364) (283,224) (227,467) (331,244) | (233,321) (233,322) (233,323) (233,324) (233,325) (233,326) (263,317) (280,313) (369,376) (352,544) (258,797) (367,511) (669,577) (641,669) (792,313) (233,327) (745,313) (233,328) (233,315) (282,385) | (884,31) (843,420) | (662,995) | (139,109) (197,241) (182,474) (881,53) (829,997) (356,902) (587,544) (1024,454) (1024,455) (1024,456) (1024,453) (1024,457) (1024,458) (1024,432) (326,978) (833,325) | (40,49) (636,819) (569,1016) (991,128) |
| Current Hot Pixels | ||||||||||
| Flickering Hot Pixels | ||||||||||
| Warm column candidates | ||||||||||
| Flickering Warm Column Candidates | 509 514 1021 | 1021 | 509 514 518 1021 | 509 514 1021 | 509 514 515 1021 |
For this period, 4 peaks are observed.
| Day (DOY) | Temp (C) | Width (Days) | |
|---|---|---|---|
| 70.98 | -119.05 | 0.12 | |
| 71.20 | -111.78 | 1.74 | |
| 73.84 | -110.66 | 0.26 | |
| 76.50 | -111.63 | 0.35 |
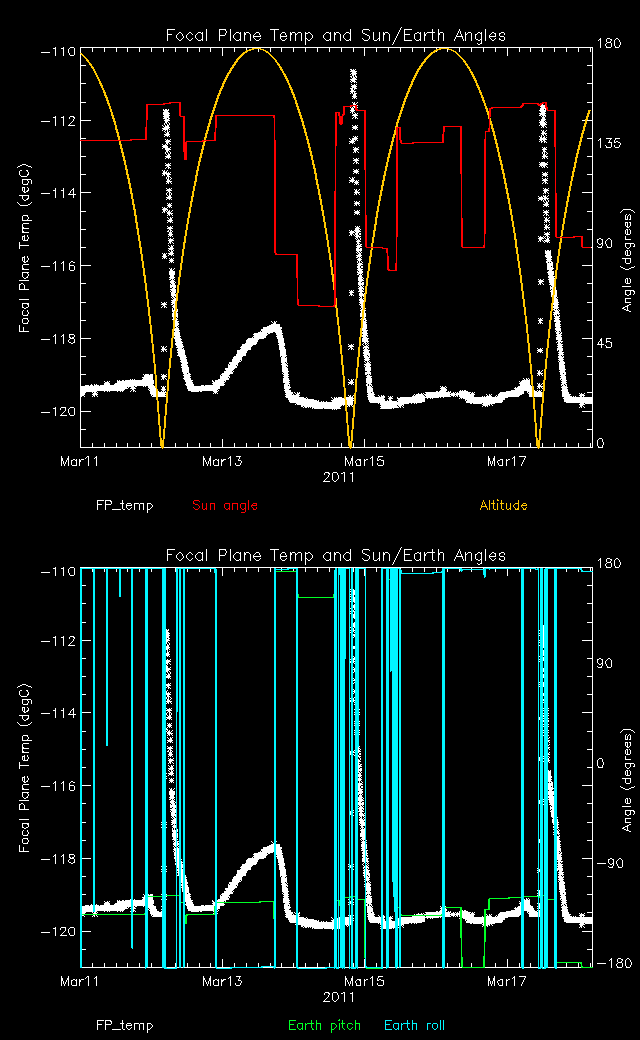
Weekly focal plane temperature with sun angle, earth angle, and altitude overplotted. Sun angle is the solar array angle, that is the angle between the sun and the optical axis (+X axis). The earth angle is the angle between earth and the ACIS radiator (+Z axis). Altitude varies from 5 kkm to 140 kkm.
13 TSC moves this period
| weekly average time/step | 0.00132 s |
|---|---|
| mission average time/step | 0.00134 s |
New violations or new extrema are shown in blue cells.
| MSID | 03/11/11 | 03/12/11 | 03/13/11 | 03/14/11 | 03/15/11 | 03/16/11 | 03/17/11 | yellow limits (lower) upper | red limits (lower) upper | Units | Description |
| 1CRAT | 159.61 | 159.61 | 159.61 | (-137.0) -100.0 | (-142.0) -90.0 |
C | COLD RADIATOR TEMP. A | ||||
| 1CRBT | 159.61 | 162.02 | 159.61 | (-137.0) -100.0 | (-142.0) -90.0 |
C | COLD RADIATOR TEMP. B | ||||
| TSCTABADC | (0.05) | (4.82) 5.03 | (4.80) 5.05 |
converter | TSC Tab Position Sensor A/D | ||||||
| TB1T1 | (270.09) | (270.09) | (270.09) | (270.09) | (270.09) | (270.09) | (270.37) 303.15 | (268.15) 314.26 |
K | BATT 1 TEMP 1 | |
| OOBTHR56 | 296.24 | 295.53 | 297.05 | 297.32 | 298.39 | 298.57 | 297.94 | (281.04) 293.04 | (249.37) 307.15 |
K | RT 158: OBA CONE |
| OBSID | DETECTOR | GRATING | TARGET | ANALYSIS | ACA |
|---|---|---|---|---|---|
| 13108 | ACIS-01236 | NONE | A1795 | CAL | OK |
| 13109 | ACIS-01236 | NONE | A1795 | CAL | OK |
| 13110 | ACIS-01236 | NONE | A1795 | CAL | OK |
| 13112 | ACIS-01236 | NONE | A1795 | CAL | OK |
| 13113 | ACIS-01236 | NONE | A1795 | CAL | OK |
| 13111 | ACIS-01236 | NONE | A1795 | CAL | OK |
| 12709 | ACIS-235678 | NONE | SDSS J1252+2640 | OK | OK |
| 12476 | ACIS-35678 | NONE | 1RXS J144701.1+114536 | OK | OK |
| 12904 | ACIS-23567 | NONE | A1882a | OK | OK |
| 12290 | ACIS-235678 | NONE | NGC 3393 | OK | OK |
| 12146 | ACIS-456789 | HETG | SN 1987A | OK | OK |
| 13135 | ACIS-01236 | NONE | Abell 3112 | OK | OK |
| 12935 | ACIS-012367 | NONE | AKARI-NEP-Deep Field | OK | OK |
| 13206 | ACIS-7 | NONE | Crab | OK | OK |
| 13031 | HRC-I | NONE | Vega | CAL | OK |
| 13032 | HRC-S | NONE | Vega | CAL | OK |
| 13033 | HRC-S | NONE | Vega | CAL | OK |
| 13034 | HRC-S | NONE | Vega | CAL | OK |
| 13035 | HRC-S | NONE | Vega | CAL | OK |
| 13046 | HRC-I | LETG | HZ43 | CAL | OK |
| 12993 | ACIS-5678 | NONE | M83 | OK | OK |
| 13025 | HRC-S | LETG | HZ43 | CAL | OK |
| 12929 | ACIS-012367 | NONE | AKARI-NEP-Deep Field | OK | OK |
| 12931 | ACIS-012367 | NONE | AKARI-NEP-Deep Field | OK | OK |
| 12169 | ACIS-678 | NONE | SDSS J1412+0624 | OK | OK |
| 12914 | ACIS-01236 | NONE | a1750ss | OK | OK |
| 12825 | ACIS-235678 | NONE | SDSS J171544.05+600835.7 | OK | OK |
| 12932 | ACIS-012367 | NONE | AKARI-NEP-Deep Field | OK | OK |
| 12484 | ACIS-35678 | NONE | 1RXS J125948.7+342325 | OK | OK |
This week's focus is Spacecraft Bus and Subsystem Trends.
Last reported on
Dec 23.
Only the most interesting or representative msids are shown below.
For a full listing choose the bulletted link.
Min/max envelopes in dark blue appear on the trending plots. The envelopes are 4th degree fits to the monthly minimum and maximum values for each MSID. The final polynomial form and binning are still being experimented with. We will soon add to the trending pages a report of the fits and predictions they give on future limit violations. The light blue curve is our original smoothing of all the data over 30 day moving boxcars. The green/yellow line is a linear fit to all the data; the break occurs at a limit change.
| MSID | MEAN | RMS | DELTA/YR | DELTA/YR/YR | UNITS | DESCRIPTION |
| EB1CI | 0.35 | 3.399e-02 | -6.415e-03 | 1.756e-03 | AMP | BATT 1 CHARGE CURRENT |
| EB1V | 32.63 | 0.16 | -3.794e-02 | -1.580e-02 | V | BATT 1 VOLTAGE |
| EB2CI | 0.36 | 4.350e-02 | -7.714e-03 | 6.716e-04 | AMP | BATT 2 CHARGE CURRENT |
| EB2V | 32.62 | 0.17 | -3.906e-02 | -1.980e-02 | V | BATT 2 VOLTAGE |
| EB3CI | 0.35 | 4.815e-02 | -9.185e-03 | 6.253e-04 | AMP | BATT 3 CHARGE CURRENT |
| EB3V | 32.33 | 0.17 | -4.106e-02 | -1.754e-02 | V | BATT 3 VOLTAGE |
| ECNV1V | 14.89 | 7.006e-03 | 4.095e-04 | 6.475e-06 | V | CONV 1 +15V OUTPUT |
| ECNV2V | 14.84 | 1.657e-02 | 1.346e-03 | -4.068e-04 | V | CONV 2 +15V OUTPUT |
| ECNV3V | 15.31 | 6.122e-03 | -1.236e-03 | -2.790e-05 | V | CONV 3 +15V OUTPUT |
| EEPA5V | 5.24 | 5.155e-05 | 2.830e-06 | 4.777e-06 | V | +5V RCTU_EP A |
| EEPB5V | 0.04 | 4.316e-04 | 2.321e-06 | 1.082e-05 | V | +5V RCTU_EP B |
| EOCHRGB1 | 1.00 | 4.840e-03 | 6.583e-05 | -8.736e-06 | ) | BATT 1 SOC RANGE (INTEGER 0 TO 10000 = 0 TO 100 |
| EOCHRGB2 | 1.00 | 2.859e-03 | -1.896e-05 | 0.000e+00 | ) | BATT 2 SOC RANGE (INTEGER 0 TO 10000 = 0 TO 100 |
| EOCHRGB3 | 1.00 | 2.744e-03 | -1.640e-06 | 0.000e+00 | ) | BATT 3 SOC RANGE (INTEGER 0 TO 10000 = 0 TO 100 |
| Previous Quarter | ||||||
| MSID | MEAN | RMS | DELTA/YR | DELTA/YR/YR | UNITS | DESCRIPTION |
| EB1CI | 0.33 | 1.645e-02 | 1.598e-01 | 2.636e+00 | AMP | BATT 1 CHARGE CURRENT |
| EB1V | 32.49 | 4.398e-02 | 4.762e-01 | 4.505e+00 | V | BATT 1 VOLTAGE |
| EB2CI | 0.33 | 1.540e-02 | 1.542e-01 | 2.315e+00 | AMP | BATT 2 CHARGE CURRENT |
| EB2V | 32.46 | 2.993e-02 | 2.226e-01 | -5.569e+00 | V | BATT 2 VOLTAGE |
| EB3CI | 0.31 | 1.602e-02 | 1.262e-01 | 2.802e+00 | AMP | BATT 3 CHARGE CURRENT |
| EB3V | 32.16 | 4.417e-02 | 4.854e-01 | -5.826e+00 | V | BATT 3 VOLTAGE |
| ECNV1V | 14.89 | 4.164e-03 | -2.013e-02 | -3.949e-01 | V | CONV 1 +15V OUTPUT |
| ECNV2V | 14.85 | 1.402e-02 | -7.496e-02 | -1.518e+00 | V | CONV 2 +15V OUTPUT |
| ECNV3V | 15.30 | 3.107e-03 | 6.416e-03 | 1.118e-01 | V | CONV 3 +15V OUTPUT |
| EEPA5V | 5.24 | 1.564e-04 | 2.171e-04 | 3.272e-03 | V | +5V RCTU_EP A |
| EEPB5V | 0.04 | 5.028e-05 | 7.921e-06 | 0.000e+00 | V | +5V RCTU_EP B |
If you have any questions, please contact: swolk@head.cfa.harvard.edu
)
)
)
)
)
)
)
)
)
)
)
)
)
)
)
)
)
)
)
)
)
)
)
)
)