Archive of all weekly reports
Archive of monthly reports
Quiet
Although we prefer to quote CTI values of the cleanest data (FT <= -119.7 C, int time > 7000sec), the data that fulfills these conditions are getting rare. We now quote CTI based on temperature corrected data for Focal plane temperature <= -118.5 C).
The unit is now CTI/year not CTI/day.
| Average of ACIS-I CCDs (MnKa) slope: | 1.669e-6 CTI/year | (4.573e-9 CTI/day) |
|---|---|---|
| Detrended slope: | 1.579e-6 CTI/year | (4.326e-9 CTI/day) |
We display all bad pixels that have showed up in past, and, if any, previously unknown bad pixels appeared in the last 14 days. We also list hot pixels (defined as 1000 above the average of bias background). Warm columns 509-514 are probably due to boundaries.
New definitions of warm pixels and flickering pixels (May 15, 2014). If a pixel displays the level beyond a threshold for more than 70% of the time in the past two weeks, the pixel is categorized as a "warm" pixel. If a pixel is above the threshold more than 30% of time but less than 70% of the time in the past two weeks, the pixel is categorized as a "flickering" pixel.
| CCD0 | CCD1 | CCD2 | CCD3 | CCD4 | CCD5 | CCD6 | CCD7 | CCD8 | CCD9 | |
|---|---|---|---|---|---|---|---|---|---|---|
| Previously Unknown Bad Pixels | ||||||||||
| Current Warm Pixels | (153,205) | (910,239) | (726,537) | (21,95) | ||||||
| Flickering Warm Pixels | (692,141) (143,700) | (802,665) | (607,281) (357,303) (369,376) (669,577) (263,317) (367,511) (233,314) (280,313) (161,206) (258,797) (341,427) | (335,412) | ||||||
| Current Hot Pixels | ||||||||||
| Flickering Hot Pixels | ||||||||||
| Warm column candidates | 884 | 510 512 1022 | 512 1022 | |||||||
| Flickering Warm Column Candidates |
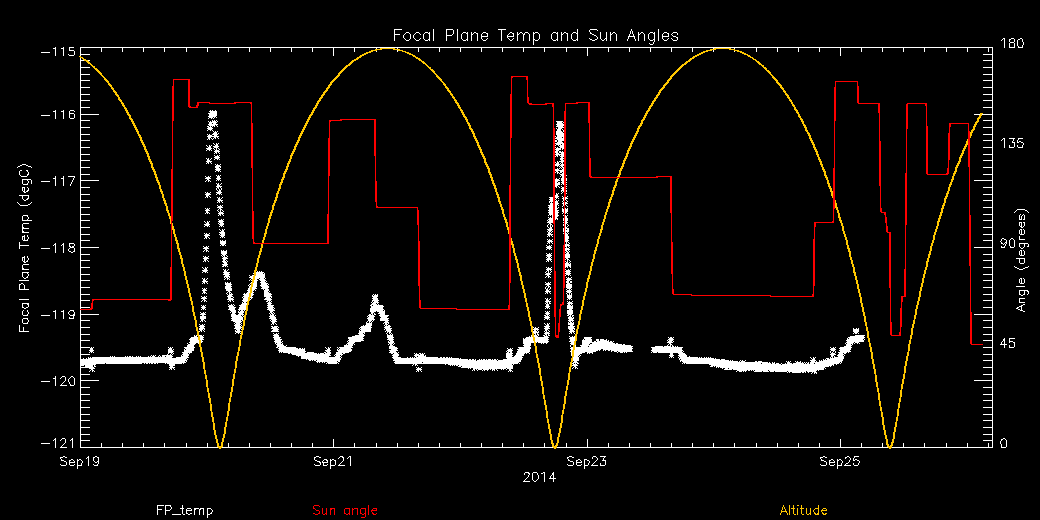
For this period, 3 peaks are observed.
| Day (DOY) | Temp (C) | Width (Days) | |
|---|---|---|---|
| 263.04 | -115.98 | 0.19 | |
| 263.41 | -118.40 | 0.10 | |
| 265.78 | -116.14 | 0.16 |
Weekly focal plane temperature with sun angle and altitude overplotted. Sun angle is the solar array angle, that is the angle between the sun and the optical axis (+X axis). Altitude varies from 10 kkm to 138 kkm.
4 TSC moves this period
| weekly average time/step | 0.00122 s |
|---|---|
| mission average time/step | 0.00133 s |
New violations or new extrema are shown in blue cells.
| MSID | 09/19/14 | 09/20/14 | 09/21/14 | 09/22/14 | 09/23/14 | 09/24/14 | 09/25/14 | yellow limits (lower) upper | red limits (lower) upper | Units | Description |
| 5EPHINT | 331.93 | 340.12 | 339.58 | 334.66 | 340.12 | 341.76 | 334.66 | (261.15) 331.15 | (258.15) 341.15 |
K | EPHIN TEMP |
| HKP5V | (5.06) | (5.06) | (5.06) | (5.06) | (5.08) 5.15 | (5.06) 5.17 |
V | HK 5 Volts Rail - Voltage | |||
| HKP5I | 54.85 | 54.06 | (35.78) 52.97 | (32.78) 55.97 |
AMP | HK 5 Volts Rail - Current | |||||
| HKEBOXTEMP | 337.10 | 345.00 | 345.00 | 343.76 | 346.29 | 347.63 | 339.18 | (268.15) 336.15 | (253.15) 346.15 |
K | EPHIN HOUSEKEEPING EBOX: TEMPERATURE (5EHSE300) |
| HKABIASLEAKI | 1.00 | 1.00 | 1.00 | 1.00 | 1.00 | 1.00 | 1.00 | (-100.0) 0.50 | (-200.0) 0.70 |
uA | EPHIN HOUSEKEEPING A-BIAS: LEAKAGE CURRENT (5EHSE400) |
| HKCBIASLEAKI | 44.67 | 45.20 | 41.30 | 45.02 | 42.54 | 42.01 | 44.14 | (-100.0) 30.0 | (-200.0) 40.0 |
uA | EPHIN HOUSEKEEPING C-BIAS: LEAKAGE CURRENT (5EHSE600) |
| HKDBIASLEAKI | 45.10 | 45.10 | 45.10 | 45.10 | 45.10 | 45.10 | 45.10 | (-100.0) 30.0 | (-200.0) 40.0 |
uA | EPHIN HOUSEKEEPING D-BIAS: LEAKAGE CURRENT (5EHSE700) |
| HKEBIASLEAKI | 45.10 | 45.10 | 45.10 | 45.10 | 45.10 | 45.10 | 45.10 | (-100.0) 30.0 | (-200.0) 40.0 |
uA | EPHIN HOUSEKEEPING E-BIAS: LEAKAGE CURRENT (5EHSE800) |
| TEIO | 352.84 | 352.84 | 351.27 | 352.84 | 352.84 | 354.41 | 348.12 | (252.15) 347.26 | (249.37) 361.15 |
K | EPHIN ELECTRONICS HOUSING TEMP |
| S2HVLV | (83.00) | (83.00) | (83.00) | (83.00) | (83.00) | (83.00) | (83.00) | (126.0) 128.0 | (125.0) 129.0 |
(2S2HVLV) | Shield PMT 2 HV monitor |
| RSRFALV | 190.00 | 190.00 | 190.00 | 190.00 | 190.00 | 190.00 | 190.00 | (172.0) 174.0 | (171.0) 175.0 |
V | Range switch setting (2RSRFALV) |
| OHRTHR27 | 297.35 | 297.34 | 297.35 | 297.35 | 297.35 | 297.35 | 297.35 | (295.48) 297.15 | (279.37) 307.15 |
K | RT 20 : PERISCOPE |
| OHRTHR42 | 294.68 | 294.65 | 294.65 | 294.66 | 294.64 | 294.72 | 294.71 | (292.15) 294.37 | (279.37) 307.15 |
K | RT 133: PERISCOPE |
| OHRTHR43 | 294.70 | 294.63 | 294.63 | 294.64 | 294.59 | 294.83 | 294.82 | (291.59) 293.26 | (279.37) 307.15 |
K | RT 134: PERISCOPE |
| OBSID | DETECTOR | GRATING | TARGET | ANALYSIS | ACA |
|---|---|---|---|---|---|
| 16242 | ACIS-35678 | NONE | ESO 153-G003 | OK | OK |
| 16119 | ACIS-23567 | NONE | RXJ1324.7-5736 | OK | OK |
| 15730 | ACIS-456789 | HETG | HD 93030 | OK | OK |
| 16290 | ACIS-23567 | NONE | NGC7717 | OK | OK |
| 15810 | ACIS-456789 | HETG | SN 1987A | OK | OK |
| 16241 | ACIS-35678 | NONE | NGC 682 | OK | OK |
| 16529 | ACIS-7 | NONE | 47 Tuc | OK | OK |
| 15986 | ACIS-23678 | NONE | GRB140903A | OK | OK |
| 16020 | ACIS-235678 | NONE | SDSS J230703.75+011311.2 | OK | OK |
| 16463 | ACIS-0123 | NONE | Chandra Deep Field-South | OK | OK |
| 14526 | ACIS-01237 | NONE | PSR J1509-5850 nebula | OK | OK |
| 15700 | ACIS-01236 | NONE | WR 122 | OK | OK |
| 17418 | ACIS-235678 | NONE | SDSS J230703.75+011311.2 | OK | OK |
| 17417 | ACIS-0123 | NONE | Chandra Deep Field-South | OK | OK |
| 16046 | ACIS-2367 | NONE | 3C34 | OK | OK |
This week's focus is Spacecraft Bus and Subsystem Trends.
Last reported on
Jul 24.
Only the most interesting or representative msids are shown below.
For a full listing choose the bulletted link.
Min/max envelopes in dark blue appear on the trending plots. The envelopes are 4th degree fits to the monthly minimum and maximum values for each MSID. The final polynomial form and binning are still being experimented with. We will soon add to the trending pages a report of the fits and predictions they give on future limit violations. The light blue curve is our original smoothing of all the data over 30 day moving boxcars. The green/yellow line is a linear fit to all the data; the break occurs at a limit change.
| MSID | MEAN | RMS | DELTA/YR | DELTA/YR/YR | UNITS | DESCRIPTION |
| EB1CI | 0.34 | 4.291e-02 | -5.197e-03 | 5.059e-04 | AMP | BATT 1 CHARGE CURRENT |
| EB1V | 32.58 | 0.18 | -3.313e-02 | -1.946e-03 | V | BATT 1 VOLTAGE |
| EB2CI | 0.35 | 5.141e-02 | -6.099e-03 | 6.902e-04 | AMP | BATT 2 CHARGE CURRENT |
| EB2V | 32.56 | 0.19 | -3.382e-02 | -8.660e-03 | V | BATT 2 VOLTAGE |
| EB3CI | 0.34 | 4.863e-02 | -7.441e-03 | -1.927e-04 | AMP | BATT 3 CHARGE CURRENT |
| EB3V | 32.27 | 0.18 | -3.486e-02 | -4.949e-03 | V | BATT 3 VOLTAGE |
| ECNV1V | 14.89 | 7.466e-03 | -2.311e-04 | 1.200e-04 | V | CONV 1 +15V OUTPUT |
| ECNV2V | 14.84 | 1.463e-02 | -2.291e-03 | -1.964e-03 | V | CONV 2 +15V OUTPUT |
| ECNV3V | 15.30 | 4.871e-03 | -1.802e-03 | -1.091e-03 | V | CONV 3 +15V OUTPUT |
| EEPA5V | 5.24 | 2.252e-04 | 2.510e-05 | 1.709e-05 | V | +5V RCTU_EP A |
| EEPB5V | 0.04 | 3.114e-04 | 1.318e-06 | -5.710e-07 | V | +5V RCTU_EP B |
| Previous Quarter | ||||||
| MSID | MEAN | RMS | DELTA/YR | DELTA/YR/YR | UNITS | DESCRIPTION |
| EB1CI | 0.32 | 5.879e-02 | -2.918e-02 | -3.828e-02 | AMP | BATT 1 CHARGE CURRENT |
| EB1V | 32.39 | 7.921e-02 | -1.537e-01 | 2.270e+01 | V | BATT 1 VOLTAGE |
| EB2CI | 0.31 | 5.359e-02 | 4.087e-04 | 9.862e-01 | AMP | BATT 2 CHARGE CURRENT |
| EB2V | 32.35 | 8.100e-02 | -4.597e-01 | 1.584e+01 | V | BATT 2 VOLTAGE |
| EB3CI | 0.29 | 5.932e-02 | 1.852e-02 | 6.783e-01 | AMP | BATT 3 CHARGE CURRENT |
| EB3V | 32.05 | 7.313e-02 | -1.894e-01 | 1.185e+01 | V | BATT 3 VOLTAGE |
| ECNV1V | 14.89 | 3.655e-03 | 4.916e-04 | 4.147e-02 | V | CONV 1 +15V OUTPUT |
| ECNV2V | 14.84 | 1.155e-02 | -3.253e-03 | 2.397e-01 | V | CONV 2 +15V OUTPUT |
| ECNV3V | 15.30 | 3.520e-03 | -2.313e-03 | -7.564e-02 | V | CONV 3 +15V OUTPUT |
| EEPA5V | 5.24 | 4.011e-04 | -4.121e-05 | -3.363e-03 | V | +5V RCTU_EP A |
| EEPB5V | 0.04 | 6.590e-05 | 1.985e-05 | 0.000e+00 | V | +5V RCTU_EP B |
| MSID | MEAN | RMS | DELTA/YR | DELTA/YR/YR | UNITS | DESCRIPTION |
| TEP_BPAN | 268.53 | 1.38 | -8.615e-02 | -7.301e-02 | K | BATT PNL TEMP OPPOSITE TEP_PPAN |
| TEP_EIA | 271.78 | 2.40 | -1.691e-01 | 4.221e-02 | K | EIA TEMP |
| TEP_PCU | 270.36 | 2.14 | -2.156e-01 | 8.057e-03 | K | PCU TEMP |
| TEP_PPAN | 270.90 | 2.24 | -1.803e-01 | 3.362e-02 | K | PCU PNL TEMP OPPOSITE TEP_BPAN |
| TEP_PSU1 | 265.92 | 1.27 | 4.877e-02 | 1.582e-01 | K | PSU-1 TEMP |
| TEP_PSU2 | 265.33 | 1.58 | -5.882e-02 | -4.284e-01 | K | PSU-2 TEMP |
| TEP_RCTU | 271.70 | 1.53 | -2.393e-02 | -9.014e-04 | K | RCTU-EP TEMP |
| TFSPCMM | 280.07 | 4.29 | 7.855e-01 | 7.740e-01 | K | FWD SHEAR PANEL TEMP: - Z CCDM COMP |
| TFSPCMP | 266.12 | 2.22 | 3.710e-02 | -2.648e-01 | K | FWD SHEAR PANEL TEMP: +Z CCDM COMP |
| TFSPPCM | 286.30 | 7.33 | 2.625e+00 | -4.983e-01 | K | FWD SHEAR PANEL TEMP: -Z PCAD COMP |
| TFSPPCP | 273.11 | 4.43 | 6.215e-01 | 2.623e-01 | K | FWD SHEAR PANEL TEMP: +Z PCAD COMP |
| TFSPPCU | 268.11 | 3.22 | -8.674e-02 | 2.023e-01 | K | FWD SHEAR PANEL: PCU COMP |
| TFSPRWC | 268.21 | 1.81 | 4.355e-02 | 2.124e-01 | K | FWD SHEAR PANEL: RWA CRNR COMP |
| TMYSADA | 280.47 | 5.72 | 1.321e+00 | 2.495e-01 | K | -Y SADA TEMP |
| TMZLGABM | 317.56 | 7.66 | 1.101e+00 | -9.696e-01 | K | -Z LOW-GAIN ANTENNA BOOM TEMP |
| MSID | MEAN | RMS | DELTA/YR | DELTA/YR/YR | UNITS | DESCRIPTION |
| TMZP_CNT | 332.54 | 20.04 | 1.307e+01 | 1.718e+02 | K | -Z PNL TEMP:CENTER |
| TMZP_MY | 308.19 | 9.78 | 3.070e+00 | 2.039e+00 | K | -Z PNL TEMP:-Y SIDE |
| TMZP_PY | 305.61 | 8.19 | 2.526e+00 | 1.440e+00 | K | -Z PNL TEMP:+Y SIDE |
| TPC_CEA | 286.69 | 4.90 | 1.480e+00 | 3.767e-01 | K | CEA TEMP |
| TPC_DEA | 276.87 | 3.75 | 8.115e-01 | 3.429e-01 | K | DEA TEMP |
| TPC_ESE | 287.95 | 6.29 | 1.790e+00 | 7.676e-01 | K | ESE TEMP |
| TPC_FSSE | 289.72 | 5.83 | 1.788e+00 | 5.863e-01 | K | FSSE TEMP (BTWN UNITS) |
| TPC_PAN | 269.40 | 4.52 | 6.634e-01 | 1.547e-01 | K | PCAD PNL TEMP (NEAR +X/+Z SA TIE-DOWN) |
| TPC_RCTU | 283.03 | 5.07 | 1.381e+00 | 4.790e-01 | K | RCTU-PC TEMP |
| TPC_WDA | 272.31 | 3.76 | 7.025e-01 | 2.675e-01 | K | WDA TEMP |
| TPCM_RW4 | 289.70 | 6.80 | 1.636e+00 | 7.983e-01 | K | RWA -4 TEMP (-Z PCAD COMP) |
| TPCM_RW5 | 291.46 | 5.98 | 1.737e+00 | 7.827e-01 | K | RWA -5 TEMP (-Z PCAD COMP) |
| TPCP_RW2 | 276.70 | 3.70 | 6.408e-01 | 3.497e-01 | K | RWA -2 TEMP (+Z PCAD COMP) |
| TPCP_RW3 | 276.93 | 4.07 | 6.001e-01 | 1.444e-01 | K | RWA -3 TEMP (+Z PCAD COMP) |
| TPYSADA | 277.44 | 3.31 | 6.325e-01 | 9.365e-01 | K | +Y SADA TEMP |
| TPZLGABM | 211.15 | 1.25 | -3.455e-02 | -3.020e-01 | K | +Z LOW-GAIN ANTENNA BOOM TEMP |
| TSAMYT | 319.72 | 1.99 | 1.234e-02 | -4.537e-01 | K | -Y WING SOLAR ARRAY TEMP |
| TSAPYT | 319.38 | 1.85 | 7.357e-02 | -3.928e-01 | K | +Y WING SOLAR ARRAY TEMP |
| MSID | MEAN | RMS | DELTA/YR | DELTA/YR/YR | UNITS | DESCRIPTION |
| TRSPOTPC | 273.73 | 3.79 | 6.160e-01 | 2.209e-01 | K | RAD SHR PNL TEMP:BTWN OX-TANK AND PCAD |
| TRSPRWBB | 265.89 | 1.60 | 8.947e-02 | 9.776e-02 | K | RAD SHR PNL TEMP:BTWN RWA CRNR AND BATB |
| TRSPRWBC | 265.82 | 1.84 | 1.776e-02 | 2.339e-01 | K | RAD SHR PNL TEMP:RWA CRNR AND BATC |
| TRSPRWCM | 267.23 | 1.64 | 1.128e-01 | -9.399e-02 | K | RAD SHR PNL TEP:BTWN CCDM AND RWA CRNR |
| TSCIUSF1 | 300.39 | 3.327e+01 | 7.320e-01 | -1.563e-01 | K | SC-IUS FITTING-1 TEMP |
| TSCIUSF2 | 263.79 | 19.20 | 6.681e-01 | 1.943e-01 | K | SC-IUS FITTING-2 TEMP |
| TSCIUSF5 | 246.56 | 13.05 | 5.839e-01 | 7.074e-01 | K | SC-IUS FITTING-5 TEMP |
| TSCIUSF8 | 301.43 | 3.680e+01 | 5.497e+00 | -2.961e-01 | K | SC-IUS FITTING-8 TEMP |
| TSCTSF1 | 301.91 | 3.06 | 2.139e+00 | 1.308e+01 | K | SC-TS FITTING -1 TEMP |
| TSCTSF2 | 276.47 | 2.20 | 7.921e-01 | 6.832e-01 | K | SC-TS FITTING -2 TEMP |
| TSCTSF3 | 264.42 | 1.29 | 1.650e-01 | 1.577e-01 | K | SC-TS FITTING -3 TEMP |
| TSCTSF4 | 268.25 | 1.67 | 1.982e-01 | 1.132e-01 | K | SC-TS FITTING -4 TEMP |
| TSCTSF5 | 281.09 | 3.40 | 1.283e+00 | 6.283e-01 | K | SC-TS FITTING -5 TEMP |
| TSCTSF6 | 303.70 | 3.43 | 2.300e+00 | 1.435e+01 | K | SC-TS FITTING -6 TEMP |
| Previous Quarter | ||||||
| MSID | MEAN | RMS | DELTA/YR | DELTA/YR/YR | UNITS | DESCRIPTION |
| TRSPOTPC | 274.51 | 2.72 | 3.780e+00 | 8.820e+01 | K | RAD SHR PNL TEMP:BTWN OX-TANK AND PCAD |
| TRSPRWBB | 266.02 | 1.34 | -8.817e-01 | 5.274e+01 | K | RAD SHR PNL TEMP:BTWN RWA CRNR AND BATB |
| TRSPRWBC | 265.78 | 1.52 | -1.335e+00 | 3.062e+01 | K | RAD SHR PNL TEMP:RWA CRNR AND BATC |
| TRSPRWCM | 267.47 | 1.47 | -9.841e-01 | 6.401e+01 | K | RAD SHR PNL TEP:BTWN CCDM AND RWA CRNR |
| TSCIUSF1 | 307.29 | 29.00 | 3.318e+00 | 1.763e+03 | K | SC-IUS FITTING-1 TEMP |
| TSCIUSF2 | 267.65 | 16.65 | -1.027e+01 | 2.099e+03 | K | SC-IUS FITTING-2 TEMP |
| TSCIUSF5 | 247.23 | 10.90 | 8.380e-01 | -7.095e+01 | K | SC-IUS FITTING-5 TEMP |
| TSCIUSF8 | 303.26 | 31.11 | 6.299e+00 | 1.884e+03 | K | SC-IUS FITTING-8 TEMP |
| TSCTSF1 | 302.62 | 3.15 | 1.046e+01 | 3.427e+01 | K | SC-TS FITTING -1 TEMP |
| TSCTSF2 | 278.90 | 1.76 | 4.058e+00 | 1.088e+02 | K | SC-TS FITTING -2 TEMP |
| TSCTSF3 | 264.80 | 1.04 | 3.781e-01 | 6.062e+01 | K | SC-TS FITTING -3 TEMP |
| TSCTSF4 | 268.49 | 1.21 | 1.282e+00 | 4.125e+01 | K | SC-TS FITTING -4 TEMP |
| TSCTSF5 | 284.22 | 2.26 | 6.348e+00 | -9.767e+00 | K | SC-TS FITTING -5 TEMP |
| TSCTSF6 | 304.45 | 3.50 | 1.212e+01 | -1.260e+02 | K | SC-TS FITTING -6 TEMP |
)
)
)
)
)
)
)
)
)
)
)
)
)
)
)
)
)
)
)
)
)
)
)
)
)
)
)
)
)
)
)
)
)
)
)
)
)
)
)
)
)
)
)
)
)
)
)
)
)
)
)
)
)
)
)
)
)
)
)
)
)
)
)
)
)
)
)
)
)
)
)
)
)
)
)
)
)
)
)
)
)
)
)