Archive of all weekly reports
Archive of monthly reports
Quiet
Although we prefer to quote CTI values of the cleanest data (FT <= -119.7 C, int time > 7000sec), the data that fulfills these conditions are getting rare. We now quote CTI based on temperature corrected data for Focal plane temperature <= -118.5 C).
The unit is now CTI/year not CTI/day.
| Average of ACIS-I CCDs (MnKa) slope: | 1.368e-02 CTI/year | (3.748e-05 CTI/day) |
|---|---|---|
| Detrended slope: | 1.765e-02 CTI/year | (4.835e-05 CTI/day) |
We display all bad pixels that have showed up in past, and, if any, previously unknown bad pixels appeared in the last 14 days. We also list hot pixels (defined as 1000 above the average of bias background). Warm columns 509-514 are probably due to boundaries.
New definitions of warm pixels and flickering pixels (May 15, 2014). If a pixel displays the level beyond a threshold for more than 70% of the time in the past two weeks, the pixel is categorized as a "warm" pixel. If a pixel is above the threshold more than 30% of time but less than 70% of the time in the past two weeks, the pixel is categorized as a "flickering" pixel.
| CCD0 | CCD1 | CCD2 | CCD3 | CCD4 | CCD5 | CCD6 | CCD7 | CCD8 | CCD9 | |
|---|---|---|---|---|---|---|---|---|---|---|
| Previously Unknown Bad Pixels | ||||||||||
| Current Warm Pixels | (811,637) (21,95) | (357,303) (263,317) (161,206) | (335,412) | |||||||
| Flickering Warm Pixels | (692,141) (143,700) | (427,125) (910,239) (643,351) (802,665) | (178,149) (726,537) (526,66) | (318,53) (680,391) | (233,227) (607,281) (369,376) (669,577) (792,313) (280,313) (367,511) (341,427) | (884,31) (1000,214) | (182,474) (197,241) (881,53) (139,109) | (65,23) | ||
| Current Hot Pixels | ||||||||||
| Flickering Hot Pixels | ||||||||||
| Warm column candidates | 510 512 1022 | 512 1022 | ||||||||
| Flickering Warm Column Candidates | 503 |
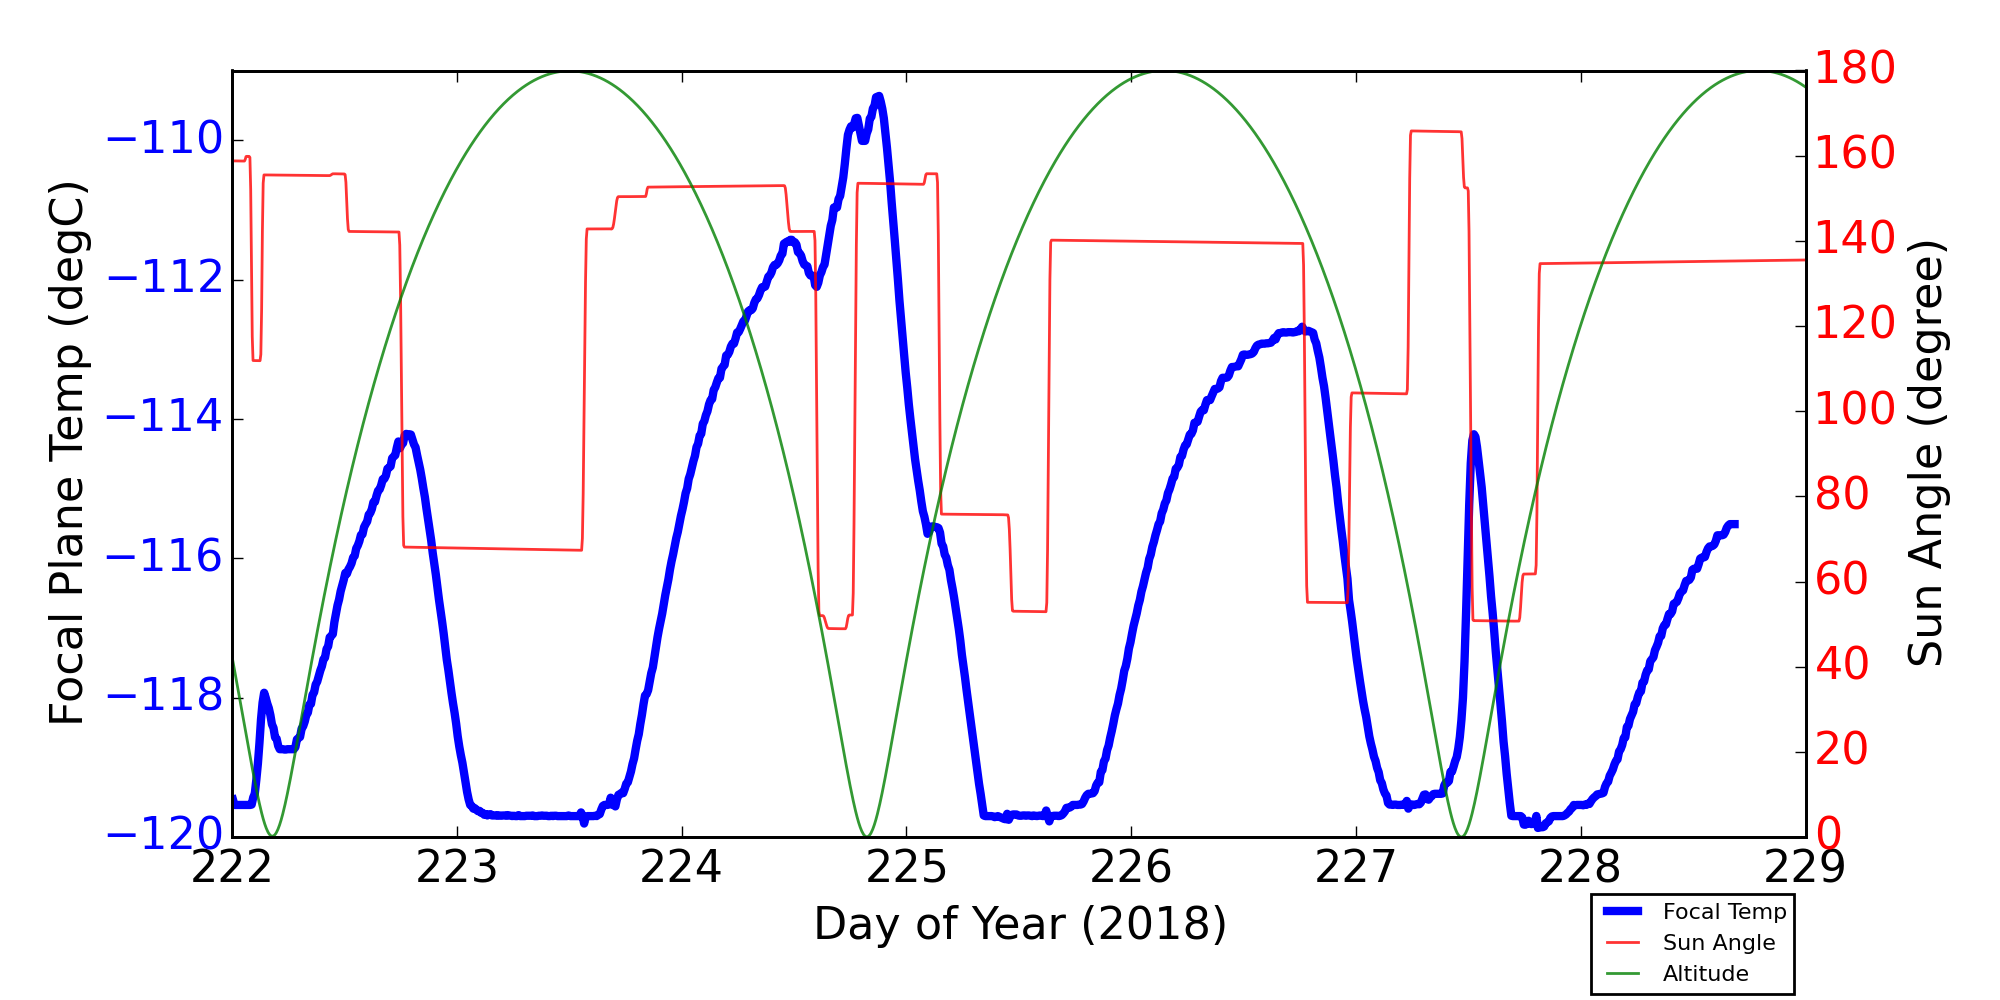
For this period, 5 peaks are observed.
| Day (DOY) | Temp (C) | Width (Days) | |
|---|---|---|---|
| 222.15 | -118.00 | 0.20 | |
| 222.78 | -114.22 | 0.56 | |
| 224.89 | -109.44 | 1.35 | |
| 226.77 | -112.72 | 1.47 | |
| 227.53 | -114.26 | 0.38 |
Weekly focal plane temperature with sun angle, earth angle, and altitude overplotted. Sun angle is the solar array angle, that is the angle between the sun and the optical axis (+X axis). The earth angle is the angle between earth and the ACIS radiator (+Z axis). Altitude varies from 34 kkm to 128 kkm.
8 TSC moves this period
| weekly average time/step | 0.00120 s |
|---|---|
| mission average time/step | 0.00136 s |
New violations or new extrema are shown in blue cells.
| MSID | 08/10/18 | 08/11/18 | 08/12/18 | 08/13/18 | 08/14/18 | 08/15/18 | 08/16/18 | yellow limits (lower) upper | red limits (lower) upper | Units | Description |
| HRMACAV | (284.85) | (284.85) | (293.4) 294.8 | (292.8) 295.5 |
TEMP | # HRMA CAVITY AVG | |||||
| HRMACAV | 294.80 | (293.4) 294.8 | (292.8) 295.5 |
TEMP | # HRMA CAVITY AVG | ||||||
| MZOBACONE | (244.00) | (221.33) | (221.33) | (260.2) 303.0 | (250.2) 308.0 |
CONE | # -Z SIDE OBA | ||||
| MZOBACONE | 304.77 | 303.07 | (260.2) 303.0 | (250.2) 308.0 |
CONE | # -Z SIDE OBA | |||||
| PZOBACONE | (198.92) | (260.2) 303.0 | (250.2) 308.0 |
CONE | # +Z SIDE OBA | ||||||
| TFTERANGE | (0.00) | (0.00) | (0.00) | (0.00) | (0.00) | (0.00) | (16.7) 37.5 | (11.1) 45.0 |
K | # TFTE VENT/RAD TEMP | |
| TFTERANGE | 37.55 | (16.7) 37.5 | (11.1) 45.0 |
K | # TFTE VENT/RAD TEMP | ||||||
| S2HVLV | (83.00) | (83.00) | (83.00) | (83.00) | (83.00) | (83.00) | (83.00) | (126.0) 128.0 | (125.0) 129.0 |
(2S2HVLV) | #Shield PMT 2 HV monitor |
| RSRFALV | 190.00 | 190.00 | 190.00 | 190.00 | 190.00 | 190.00 | 190.00 | (172.0) 174.0 | (171.0) 175.0 |
V | #Range switch setting (2RSRFALV) |
| 3FLCABPT | 293.45 | 293.95 | (253.15) 293.15 | (235.65) 310.65 |
K | #FLCA BASEPLATE (+X) | |||||
| 3TSMXCET | 283.26 | 280.77 | 280.77 | 283.26 | 273.29 | 285.76 | 268.30 | (153.15) 263.15 | (148.15) 353.15 |
K | #-X TURTLE SHELL NR HRC CEA |
| 3TSMXSPT | 659.89 | 659.89 | 659.89 | 659.89 | 659.89 | 659.89 | 562.61 | (203.15) 283.15 | (148.15) 353.15 |
K | #-X TURTLE SHELL NR ACIS SS |
| ELBI | 64.77 | 65.03 | 68.49 | 65.30 | 63.20 | 67.42 | 62.68 | (16.0) 50.0 | (13.0) 66.0 |
AMP | #LOAD BUS CURRENT (ELBI_LOW) |
| TAPE2PST | (292.71) | (292.71) | (292.28) | (291.85) | (293.14) | (292.71) | (293.14) | (323.15) 330.15 | (318.15) 335.15 |
K | #PEA-2 POWER SUPPLY TEMP |
| 4PRT3AT | (258.46) | (258.46) | (257.79) | (258.46) | (258.46) | (258.46) | (258.46) | (273.15) 283.15 | (53.15) 368.15 |
K | #IP A: PRE-COLLIMATOR PRT 3 TEMPERATURE |
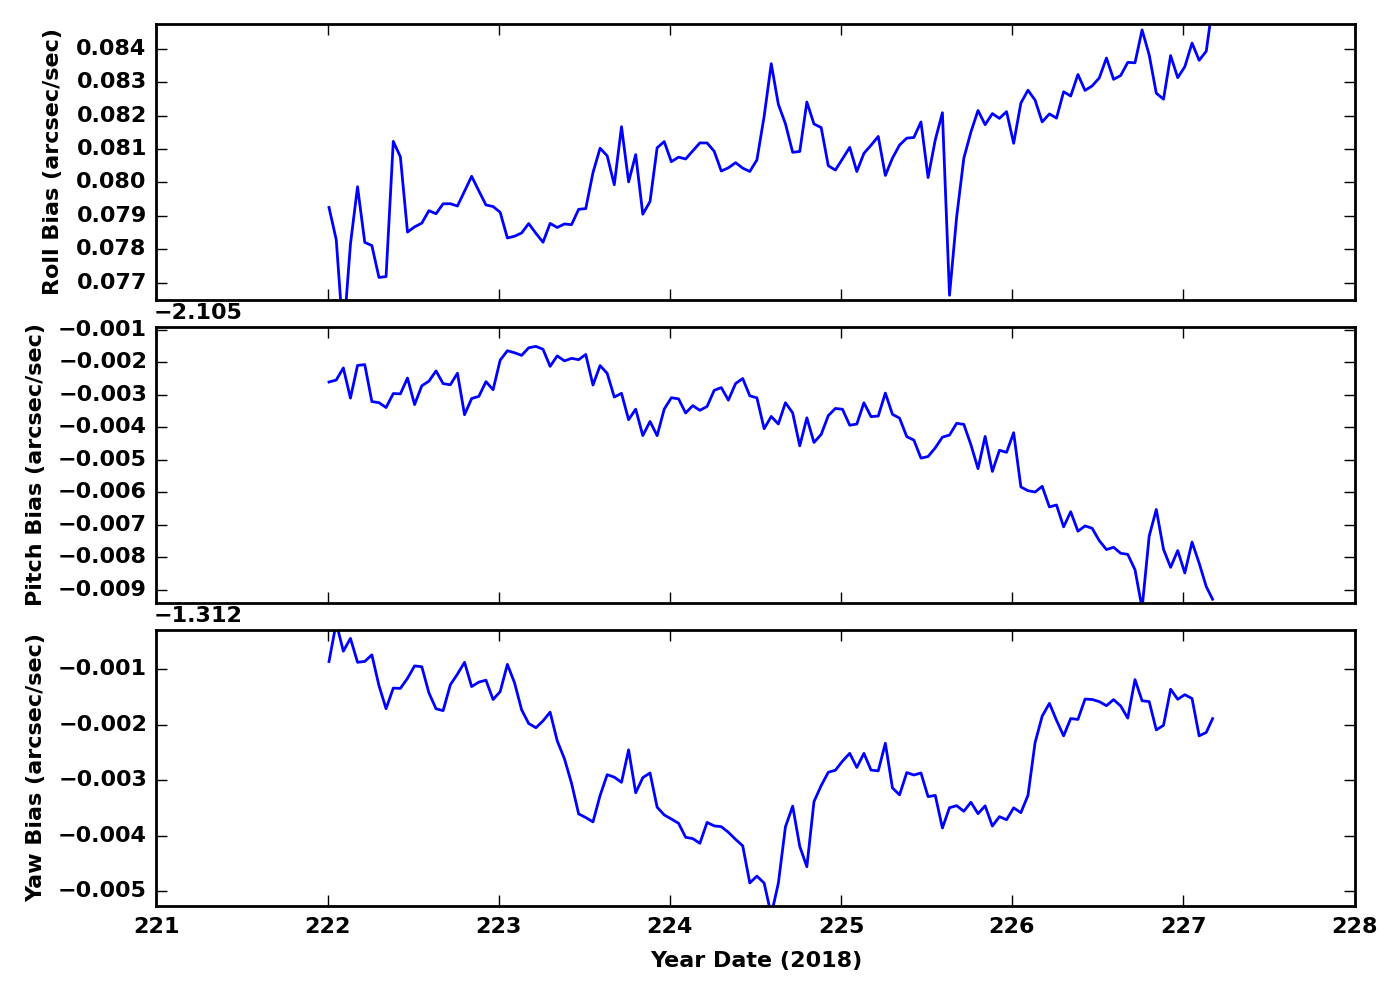
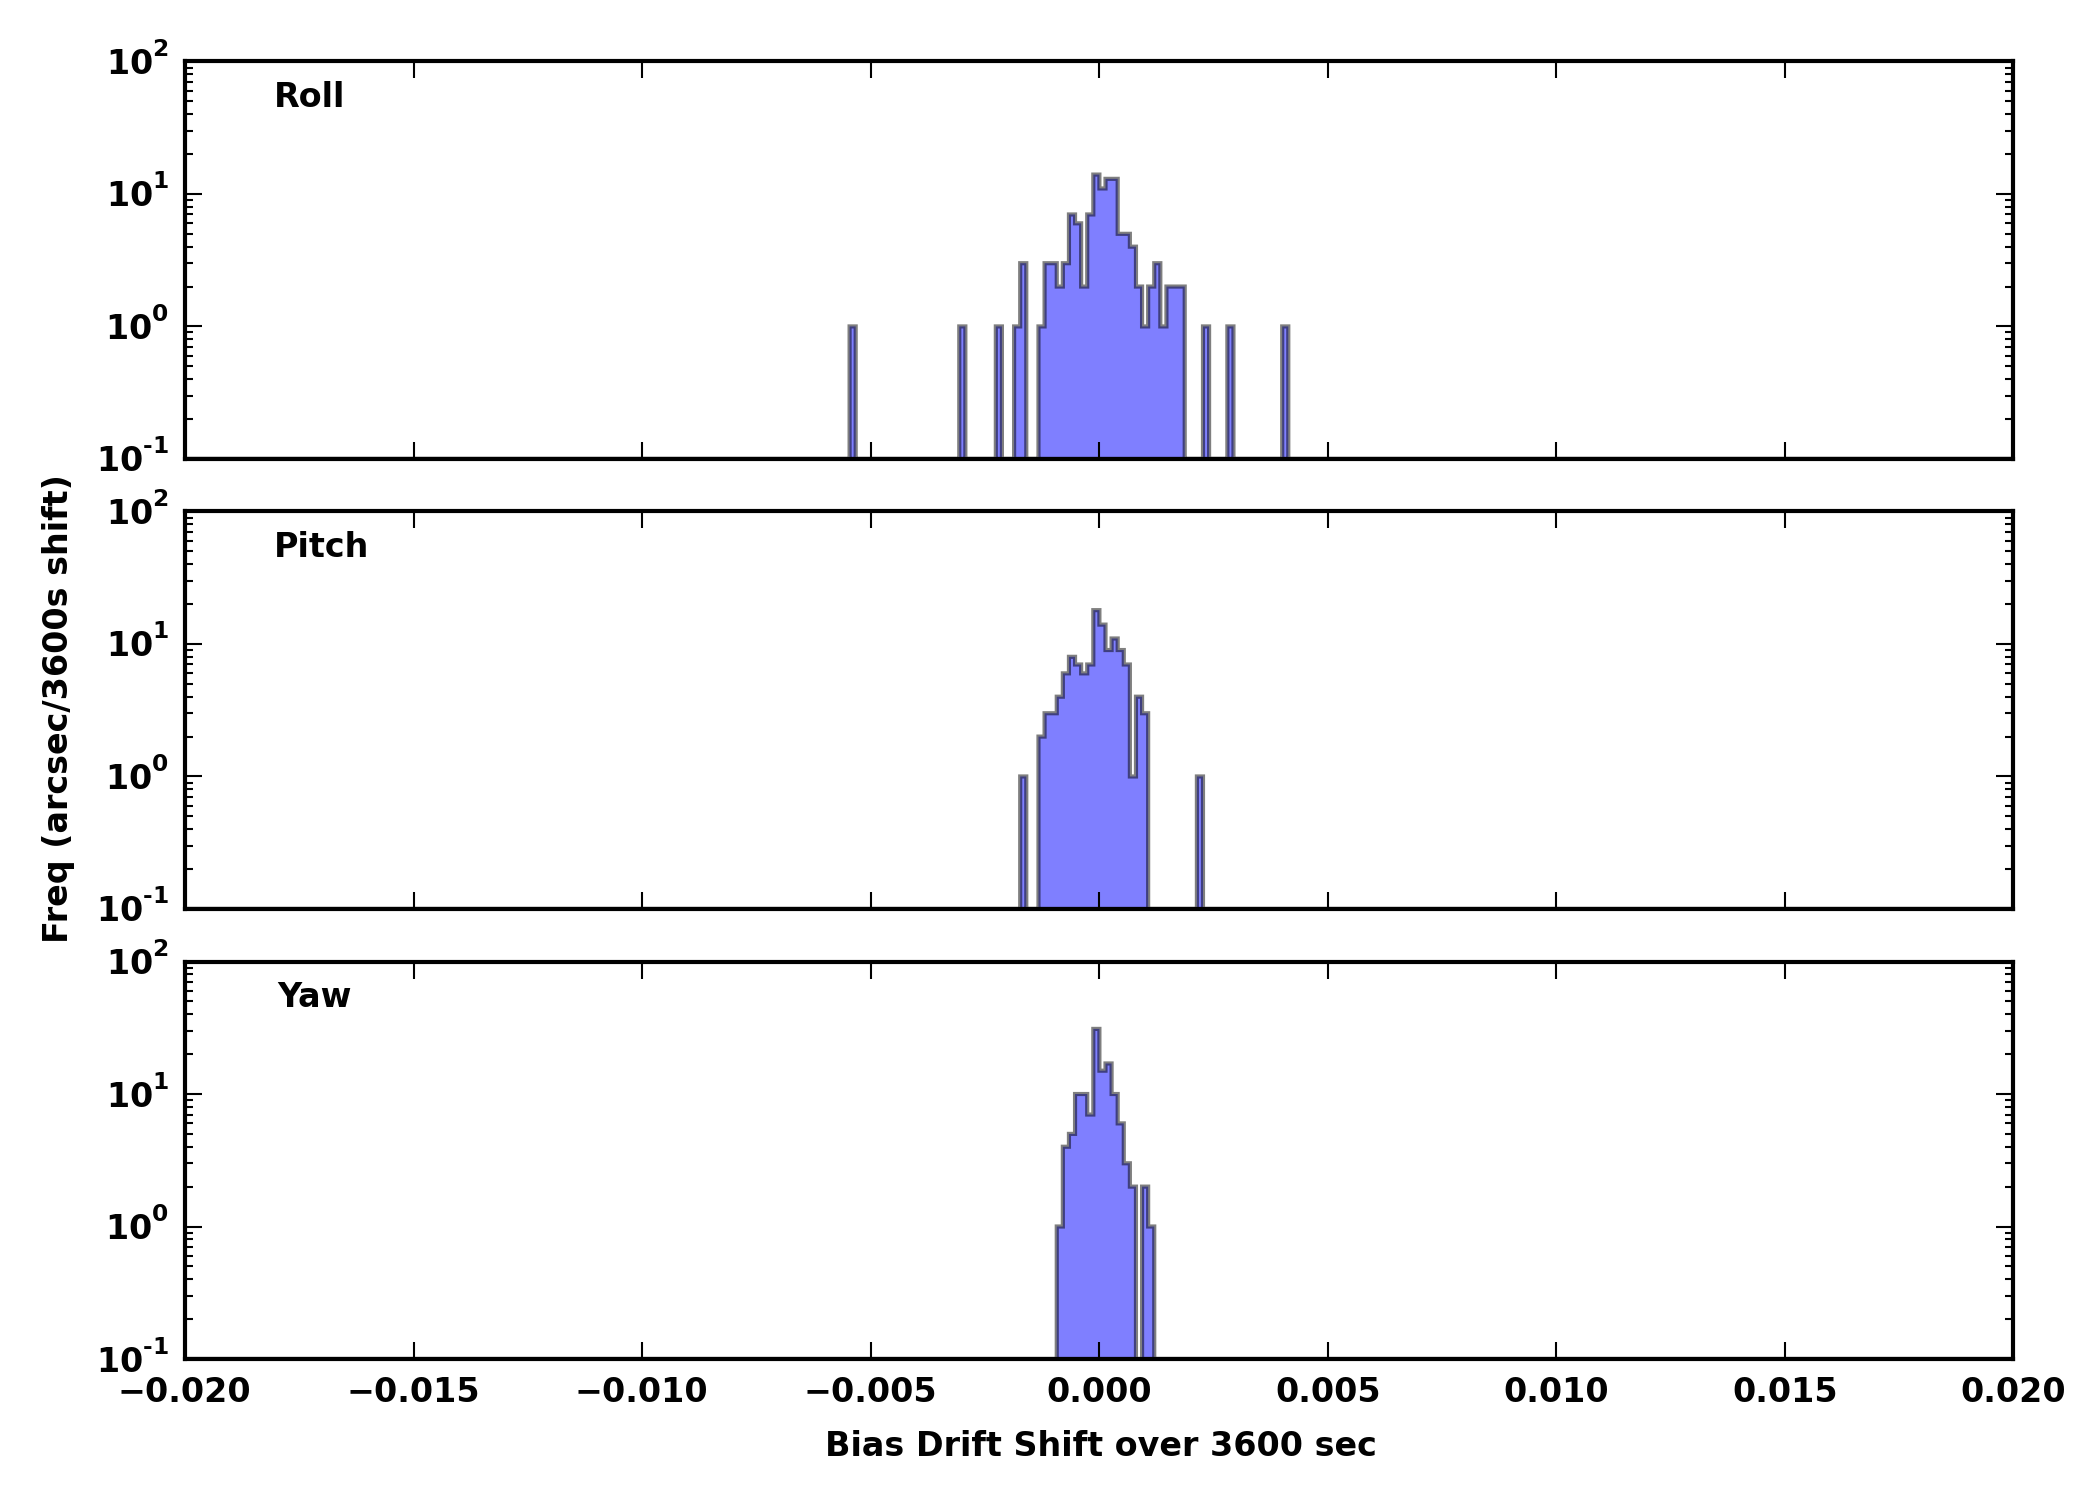
| Gyro Bias Drift | Gyro Bias Drift Histogram |
|---|---|
|
|
| OBSID | DETECTOR | GRATING | TARGET | ANALYSIS | ACA |
|---|---|---|---|---|---|
| 20157 | ACIS-5678 | HETG | zeta Pup | OK | OK |
| 20132 | ACIS-5678 | HETG | SS 433 | OK | OK |
| 21371 | ACIS-23678 | NONE | GW170817 | OK | OK |
| 20383 | ACIS-23678 | NONE | VHSJ2257-4700 | OK | OK |
| 21063 | ACIS-01237 | NONE | PSZ2 G062.46-21.35 | OK | OK |
| 20382 | ACIS-23678 | NONE | VHSJ2256-4800 | OK | OK |
| 20153 | ACIS-7 | NONE | HD 93129A | OK | OK |
| 21022 | ACIS-56789 | NONE | LSBC F576-01 | OK | OK |
| 20131 | ACIS-5678 | HETG | SS 433 | OK | OK |
| 20772 | ACIS-23678 | NONE | NGC 5112 | OK | OK |
| 21665 | ACIS-35678 | NONE | SN2018bsz | OK | OK |
This week's focus is Spacecraft Bus and Subsystem Trends
Last reported on
May 24.
Only the most interesting or representative msids are shown below.
For a full listing choose the bulletted link.
Min/max envelopes in dark blue appear on the trending plots. The envelopes are 4th degree fits to the monthly minimum and maximum values for each MSID. The final polynomial form and binning are still being experimented with. We will soon add to the trending pages a report of the fits and predictions they give on future limit violations. The light blue curve is our original smoothing of all the data over 30 day moving boxcars. The green/yellow line is a linear fit to all the data; the break occurs at a limit change.
| MSID | MEAN | RMS | DELTA/YR | DELTA/YR/YR | UNITS | DESCRIPTION |
| EB1V | 32.54 | 0.18 | -2.567e-02 | -5.580e-03 | V | BATT 1 VOLTAGE |
| EB2CI | 0.34 | 4.787e-02 | -5.633e-03 | -1.793e-04 | AMP | BATT 2 CHARGE CURRENT |
| EB2V | 32.52 | 0.18 | -2.689e-02 | -2.783e-04 | V | BATT 2 VOLTAGE |
| ECNV3V | 15.29 | 4.289e-03 | -2.598e-03 | 5.450e-03 | V | CONV 3 +15V OUTPUT |
| EEPA5V | 5.24 | 3.003e-04 | 2.929e-05 | 5.496e-06 | V | +5V RCTU_EP A |
| Previous Quarter | ||||||
| MSID | MEAN | RMS | DELTA/YR | DELTA/YR/YR | UNITS | DESCRIPTION |
| EB1V | 32.30 | 7.583e-02 | -5.045e-02 | 6.904e+00 | V | BATT 1 VOLTAGE |
| EB2CI | 0.29 | 3.980e-02 | -1.850e-02 | 4.077e-01 | AMP | BATT 2 CHARGE CURRENT |
| EB2V | 32.31 | 7.461e-02 | -6.855e-02 | 5.540e+00 | V | BATT 2 VOLTAGE |
| ECNV3V | 15.29 | 3.294e-03 | -2.100e-03 | -2.351e-02 | V | CONV 3 +15V OUTPUT |
| EEPA5V | 5.24 | 3.913e-04 | -7.680e-06 | 6.910e-03 | V | +5V RCTU_EP A |
| MSID | MEAN | RMS | DELTA/YR | DELTA/YR/YR | UNITS | DESCRIPTION |
| TAPE2PST | 292.36 | 1.16 | 9.598e-01 | 4.712e-01 | K | PEA-2 POWER SUPPLY TEMP |
| TAPEA1T | 303.06 | 1.14 | 9.916e-01 | -6.861e-01 | K | PEA-1 CASE TEMP |
| TCYLAFT1 | 311.83 | 4.43 | 3.623e+00 | -6.390e+00 | K | CNT CYL TEMP:16-IN FWD OF SC-TS FIT-1 |
| TPC_ESE | 295.73 | 3.69 | 2.143e+00 | -5.118e+00 | K | ESE TEMP |
| TSAMYT | 319.37 | 1.94 | 2.409e-02 | -1.212e+00 | K | -Y WING SOLAR ARRAY TEMP |
| TSAPYT | 319.34 | 1.89 | 5.961e-02 | -1.282e+00 | K | +Y WING SOLAR ARRAY TEMP |
| Previous Quarter | ||||||
| MSID | MEAN | RMS | DELTA/YR | DELTA/YR/YR | UNITS | DESCRIPTION |
| TAPE2PST | 293.08 | 1.06 | -1.268e+00 | 5.684e+01 | K | PEA-2 POWER SUPPLY TEMP |
| TAPEA1T | 303.78 | 0.98 | -1.249e+00 | 5.202e+01 | K | PEA-1 CASE TEMP |
| TCYLAFT1 | 313.87 | 3.54 | -1.443e+00 | 1.520e+02 | K | CNT CYL TEMP:16-IN FWD OF SC-TS FIT-1 |
| TPC_ESE | 296.96 | 3.17 | 2.502e+00 | 2.164e+02 | K | ESE TEMP |
| TSAMYT | 317.34 | 0.67 | -1.097e+00 | 7.954e+01 | K | -Y WING SOLAR ARRAY TEMP |
| TSAPYT | 317.33 | 0.65 | -1.178e+00 | 6.778e+01 | K | +Y WING SOLAR ARRAY TEMP |
| MSID | MEAN | RMS | DELTA/YR | DELTA/YR/YR | UNITS | DESCRIPTION |
| TATECDRT | 291.66 | 1.22 | 9.997e-01 | 9.371e-01 | K | TEC DRIVER RDNT TEMP |
| TRSPMTPC | 302.42 | 3.94 | 2.528e+00 | -5.218e+00 | K | RAD SHR PNL TEMP:TTWN MUPS AND PCAD |
| TSCTSF1 | 309.82 | 4.22 | 3.451e+00 | -3.869e+00 | K | SC-TS FITTING -1 TEMP |
| TSCTSF2 | 282.04 | 1.99 | 1.476e+00 | -7.584e-01 | K | SC-TS FITTING -2 TEMP |
| MSID | MEAN | RMS | DELTA/YR | DELTA/YR/YR | UNITS | DESCRIPTION |
| TATECDRT | 292.37 | 1.05 | -1.195e+00 | 5.790e+01 | K | TEC DRIVER RDNT TEMP |
| TRSPMTPC | 303.99 | 3.35 | 1.061e+00 | 2.070e+02 | K | RAD SHR PNL TEMP:TTWN MUPS AND PCAD |
| TSCTSF1 | 311.57 | 3.82 | -4.625e+00 | 1.297e+02 | K | SC-TS FITTING -1 TEMP |
| TSCTSF2 | 282.86 | 1.72 | 3.810e-01 | 6.231e+01 | K | SC-TS FITTING -2 TEMP |
If you have any questions, please contact: swolk@head.cfa.harvard.edu
)
)
)
)
)
)
)
)
)
)
)
)
)
)
)
)
)
)
)
)
)
)
)
)
)
)
)
)
)
)