Archive of all weekly reports
Archive of monthly reports
Quiet
Although we prefer to quote CTI values of the cleanest data (FT <= -119.7 C, int time > 7000sec), the data that fulfills these conditions are getting rare. We now quote CTI based on temperature corrected data for Focal plane temperature <= -118.5 C).
The unit is now CTI/year not CTI/day.
| Average of ACIS-I CCDs (MnKa) slope: | 1.364e-02 CTI/year | (3.737e-05 CTI/day) |
|---|---|---|
| Detrended slope: | 1.817e-02 CTI/year | (4.977e-05 CTI/day) |
We display all bad pixels that have showed up in past, and, if any, previously unknown bad pixels appeared in the last 14 days. We also list hot pixels (defined as 1000 above the average of bias background). Warm columns 509-514 are probably due to boundaries.
New definitions of warm pixels and flickering pixels (May 15, 2014). If a pixel displays the level beyond a threshold for more than 70% of the time in the past two weeks, the pixel is categorized as a "warm" pixel. If a pixel is above the threshold more than 30% of time but less than 70% of the time in the past two weeks, the pixel is categorized as a "flickering" pixel.
| CCD0 | CCD1 | CCD2 | CCD3 | CCD4 | CCD5 | CCD6 | CCD7 | CCD8 | CCD9 | |
|---|---|---|---|---|---|---|---|---|---|---|
| Previously Unknown Bad Pixels | (332,324) | |||||||||
| Current Warm Pixels | (143,700) | (910,239) (802,665) | (811,637) (21,95) | (1000,214) | (335,412) | |||||
| Flickering Warm Pixels | (692,141) (476,852) | (427,125) (643,351) | (726,537) (178,149) (526,66) | (680,391) (669,458) (318,53) | (233,227) (607,281) (341,427) (369,376) (263,317) (161,206) (357,303) | (182,474) (597,187) (197,241) (881,53) (139,109) | (150,374) (636,819) (65,23) | |||
| Current Hot Pixels | ||||||||||
| Flickering Hot Pixels | ||||||||||
| Warm column candidates | 510 512 1022 | 512 1022 | ||||||||
| Flickering Warm Column Candidates |
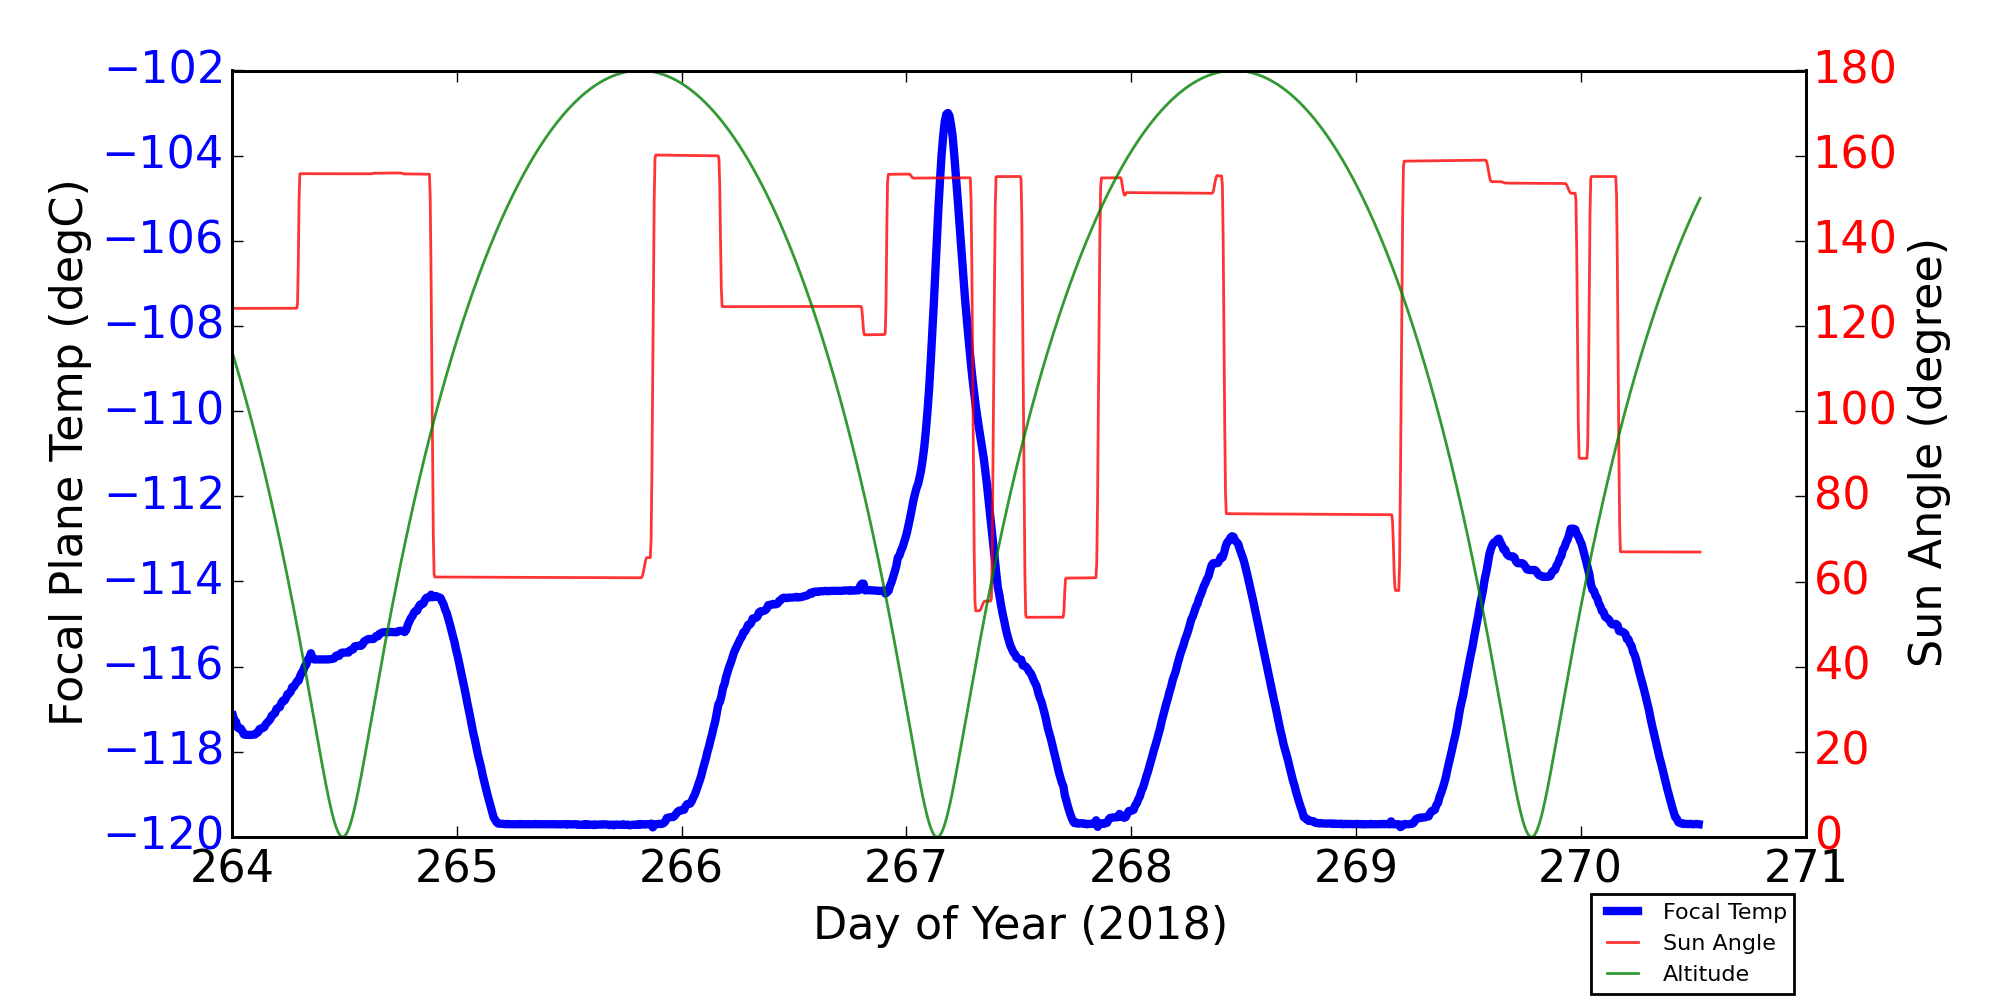
For this period, 4 peaks are observed.
| Day (DOY) | Temp (C) | Width (Days) | |
|---|---|---|---|
| 264.91 | -114.36 | 0.42 | |
| 267.19 | -103.06 | 1.84 | |
| 268.45 | -112.95 | 0.82 | |
| 269.98 | -112.78 | 0.85 |
Weekly focal plane temperature with sun angle, earth angle, and altitude overplotted. Sun angle is the solar array angle, that is the angle between the sun and the optical axis (+X axis). The earth angle is the angle between earth and the ACIS radiator (+Z axis). Altitude varies from 34 kkm to 128 kkm.
8 TSC moves this period
| weekly average time/step | 0.00131 s |
|---|---|
| mission average time/step | 0.00136 s |
New violations or new extrema are shown in blue cells.
| MSID | 09/21/18 | 09/22/18 | 09/23/18 | 09/24/18 | 09/25/18 | 09/26/18 | 09/27/18 | yellow limits (lower) upper | red limits (lower) upper | Units | Description |
| HRMACAV | (284.85) | (288.08) | (293.4) 294.8 | (292.8) 295.5 |
TEMP | # HRMA CAVITY AVG | |||||
| HRMACAV | 294.84 | 294.82 | (293.4) 294.8 | (292.8) 295.5 |
TEMP | # HRMA CAVITY AVG | |||||
| MZOBACONE | (221.33) | (221.33) | (260.2) 303.0 | (250.2) 308.0 |
CONE | # -Z SIDE OBA | |||||
| MZOBACONE | 303.81 | 304.86 | 305.67 | 304.81 | (260.2) 303.0 | (250.2) 308.0 |
CONE | # -Z SIDE OBA | |||
| TFTERANGE | (0.00) | (0.00) | (0.00) | (0.00) | (0.00) | (16.7) 37.5 | (11.1) 45.0 |
K | # TFTE VENT/RAD TEMP | ||
| TFTERANGE | 37.94 | 37.55 | (16.7) 37.5 | (11.1) 45.0 |
K | # TFTE VENT/RAD TEMP | |||||
| SCSTRUTRNGE | 24.96 | 24.86 | (-0.5) 24.0 | (-1.0) 40.0 |
K | # SC STRUT TEMP | |||||
| IMHVLV | (99.00) | (99.00) | (99.00) | (99.00) | (99.00) | (99.00) | (99.00) | (126.0) 128.0 | (125.0) 129.0 |
(2IMHVLV) | #Imaging bot MCP HV monitor |
| IMHBLV | (105.00) | (105.00) | (105.00) | (105.00) | (105.00) | (105.00) | (105.00) | (126.0) 128.0 | (125.0) 129.0 |
(2IMHBLV) | #Imaging bot and top MCP HV monitor |
| S2HVLV | (83.00) | (83.00) | (83.00) | (83.00) | (83.00) | (83.00) | (83.00) | (126.0) 128.0 | (125.0) 129.0 |
(2S2HVLV) | #Shield PMT 2 HV monitor |
| RSRFALV | 185.00 | 185.00 | 185.00 | 185.00 | 185.00 | 185.00 | 185.00 | (172.0) 174.0 | (171.0) 175.0 |
V | #Range switch setting (2RSRFALV) |
| SMTRATM | 55.20 | (-17.0) 45.0 | (-20.0) 50.0 |
C | #Selected motor temperature (2SMTRATM) | ||||||
| 3TSMXCET | 283.26 | 285.76 | 285.76 | 283.26 | 283.26 | 285.76 | 285.76 | (153.15) 263.15 | (148.15) 353.15 |
K | #-X TURTLE SHELL NR HRC CEA |
| 3TSMXSPT | 659.89 | 659.89 | 659.89 | 659.89 | 659.89 | 659.89 | 659.89 | (203.15) 283.15 | (148.15) 353.15 |
K | #-X TURTLE SHELL NR ACIS SS |
| ELBI | 63.99 | 64.77 | 61.89 | 64.77 | 63.99 | 64.25 | 65.03 | (16.0) 50.0 | (13.0) 66.0 |
AMP | #LOAD BUS CURRENT (ELBI_LOW) |
| TAPE2PST | (291.85) | (293.14) | (293.14) | (292.28) | (293.14) | (292.71) | (323.15) 330.15 | (318.15) 335.15 |
K | #PEA-2 POWER SUPPLY TEMP | |
| TATECDRT | (292.28) | (292.28) | (321.15) 328.15 | (316.15) 333.15 |
K | #TEC DRIVER RDNT TEMP | |||||
| 4PRT3AT | (258.46) | (258.46) | (258.46) | (258.46) | (258.46) | (258.46) | (258.46) | (273.15) 283.15 | (53.15) 368.15 |
K | #IP A: PRE-COLLIMATOR PRT 3 TEMPERATURE |
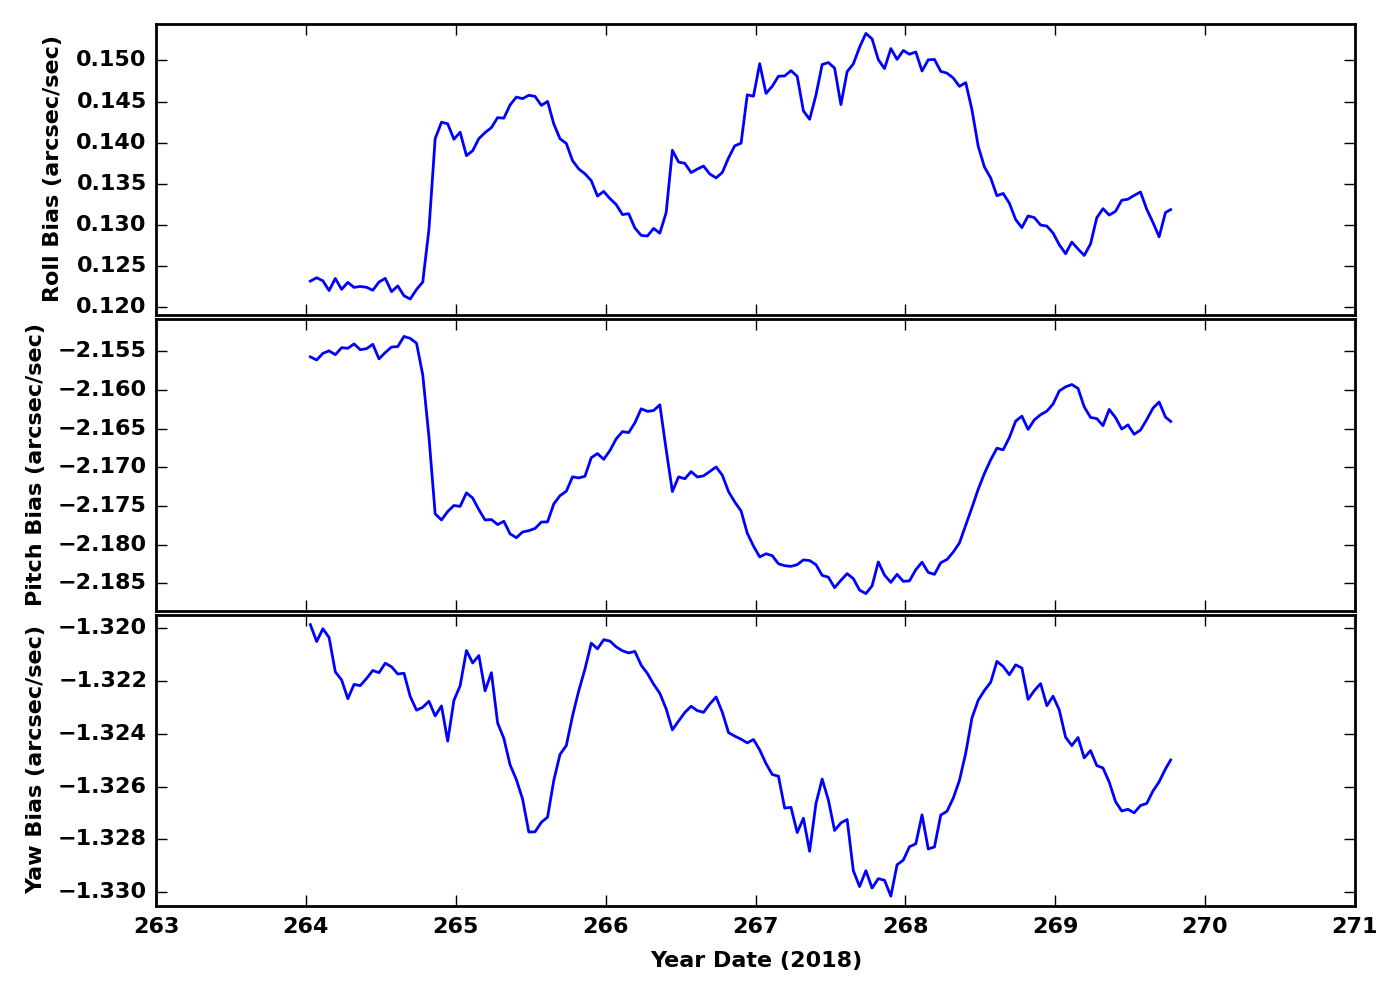
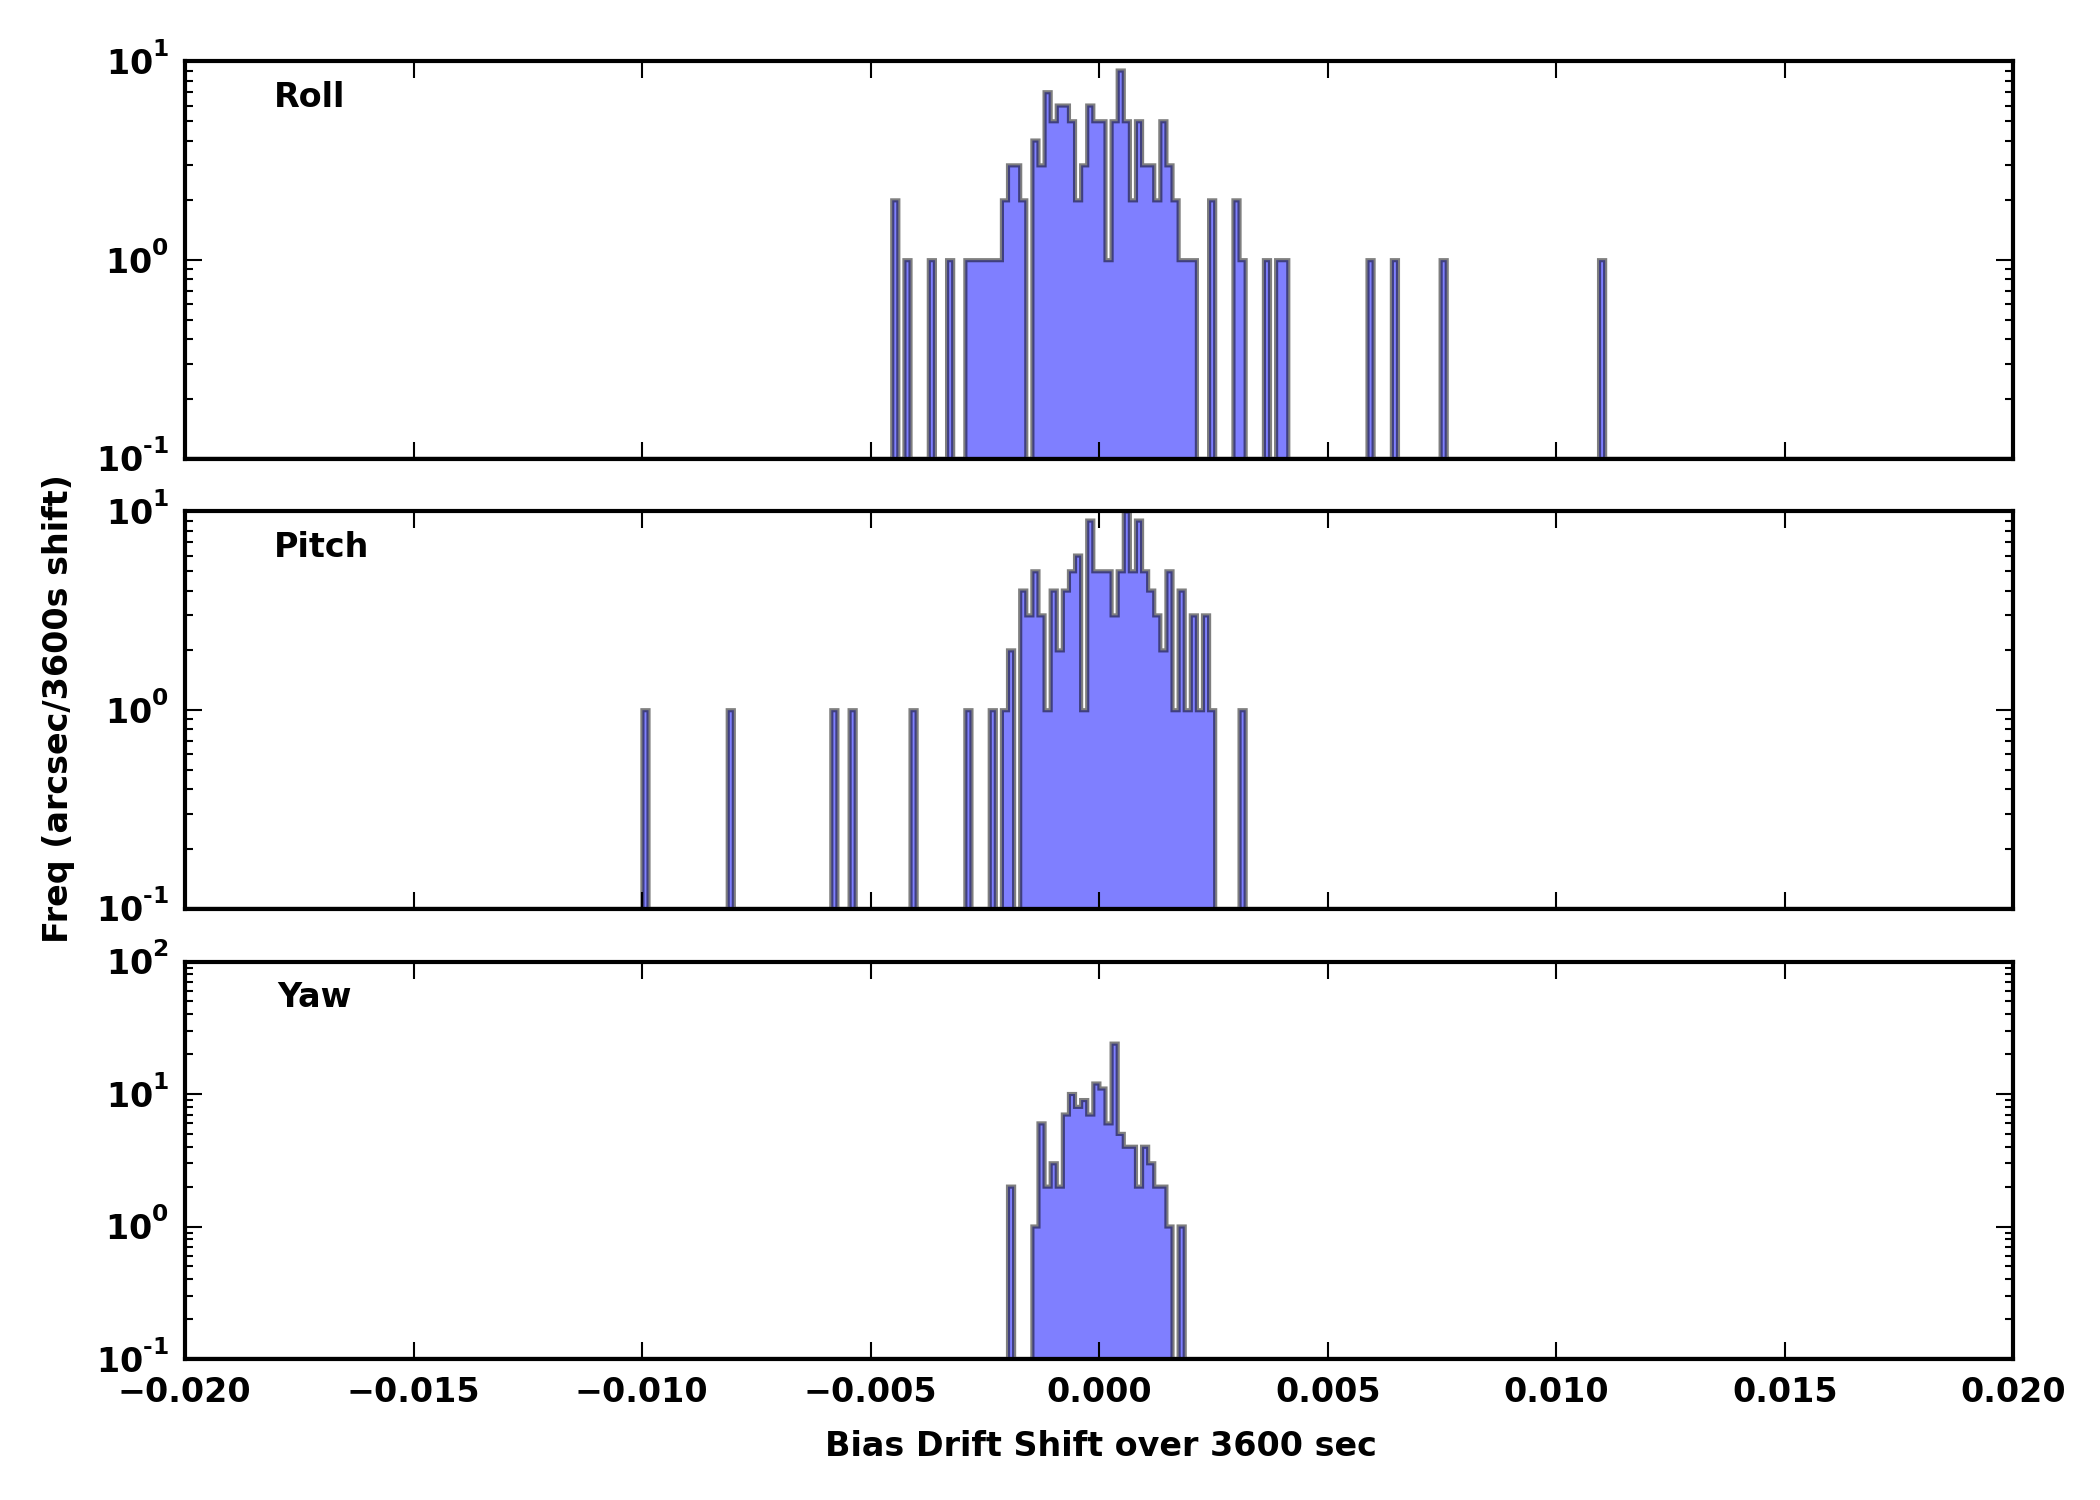
| Gyro Bias Drift | Gyro Bias Drift Histogram |
|---|---|
|
|
| OBSID | DETECTOR | GRATING | TARGET | ANALYSIS | ACA |
|---|---|---|---|---|---|
| 21850 | ACIS-6789 | NONE | LMWD 143 | OK | OK |
| 20436 | ACIS-3678 | NONE | SDSS J132916.20+530455.1 | OK | OK |
| 20930 | ACIS-01236 | NONE | CIZA J2242.8+5301 | OK | OK |
| 21848 | ACIS-0123 | NONE | Westerlund 2 | OK | OK |
| 21851 | ACIS-56789 | NONE | LMWD 143 | OK | OK |
| 21849 | ACIS-01236 | NONE | CIZA J2242.8+5301 | OK | OK |
| 20527 | ACIS-01236 | NONE | Perseus r200 NE | OK | OK |
| 20461 | ACIS-23678 | NONE | SDSS J132457.29+480241.2 | OK | OK |
| 20511 | ACIS-01236 | NONE | ClG J104513+580833 | OK | OK |
| 21020 | ACIS-56789 | NONE | LSBC F612-01 | OK | OK |
| 21545 | ACIS-0123 | NONE | CHIPS0005-2758 | OK | OK |
| 20589 | ACIS-01237 | NONE | Abell 2219 | OK | OK |
This week's focus is HRC
Last reported on
Jul 05.
Only the most interesting or representative msids are shown below.
For a full listing choose the bulletted link.
Min/max envelopes in dark blue appear on the trending plots. The envelopes are 4th degree fits to the monthly minimum and maximum values for each MSID. The final polynomial form and binning are still being experimented with. We will soon add to the trending pages a report of the fits and predictions they give on future limit violations. The light blue curve is our original smoothing of all the data over 30 day moving boxcars. The green/yellow line is a linear fit to all the data; the break occurs at a limit change.
| MSID | MEAN | RMS | DELTA/YR | DELTA/YR/YR | UNITS | DESCRIPTION |
| 2CEAHVPT | 299.56 | 2.16 | 6.211e-01 | 1.362e+00 | K | CEA RADIATOR TEMPERATURE AT CENTER |
| 2CHTRPZT | 296.03 | 2.13 | 6.065e-01 | 1.847e+00 | K | CENTRAL ELECTRONICS BOX TEMP |
| 2CONDMXT | 292.65 | 2.32 | 6.360e-01 | 4.178e+00 | K | CONDUIT -X FACE TEMPERATURE |
| 2DCENTRT | 291.75 | 2.08 | 6.875e-01 | 1.649e-01 | K | DETECTOR HOUSING TEMP 2 |
| 2DTSTATT | 292.52 | 2.03 | 6.604e-01 | -2.566e-01 | K | DETECTOR HOUSING TEMP 1 |
| 2FHTRMZT | 294.68 | 2.23 | 6.347e-01 | 6.136e-01 | K | FRONT END ELECTRONICS BOX TEMPERATURE |
| 2FRADPYT | 290.48 | 2.31 | 6.290e-01 | 8.614e-01 | K | FRONT END ASSEMBLY +Y AT RADIATOR CENTER TEMP |
| 2PMT1T | 293.61 | 2.67 | 7.890e-01 | 4.256e+00 | K | PMT 1 TEMPERATURE |
| 2PMT2T | 296.01 | 2.90 | 7.612e-01 | 5.886e+00 | K | PMT 2 TEMPERATURE |
| 2UVLSPXT | 287.75 | 2.53 | 6.153e-01 | -2.217e+00 | K | UV LIGHT SHIELD NEXT TO SNOUT TEMP |
| MSID | MEAN | RMS | DELTA/YR | DELTA/YR/YR | UNITS | DESCRIPTION |
| FE00ATM | 20.18 | 1.98 | 3.147e-01 | -9.114e-02 | C | Front end temperature (2FE00ATM) |
| FEPRATM | 22.59 | 2.29 | 3.635e-01 | -4.586e-02 | C | FE temp card temperature (2FEPRATM) |
| IMINATM | 16.70 | 2.63 | 3.422e-01 | 1.035e-01 | C | Imaging det temperature (2IMINATM) |
| LVPLATM | 26.20 | 1.98 | 2.948e-01 | 3.171e-02 | C | LVPS plate temperature (2LVPLATM) |
| PRBSCR | 1.59 | 4.119e-02 | -3.765e-03 | 9.319e-04 | AMP | Primary bus current (2PRBSCR) |
| PRBSVL | 27.80 | 0.53 | -1.451e-01 | -1.314e-02 | V | Primary bus voltage (2PRBSVL) |
If you have any questions, please contact: swolk@head.cfa.harvard.edu
)
)
)
)
)
)
)
)
)
)
)
)
)
)
)
)