Archive of all weekly reports
Archive of monthly reports
Quiet
Although we prefer to quote CTI values of the cleanest data (FT <= -119.7 C, int time > 7000sec), the data that fulfills these conditions are getting rare. We now quote CTI based on temperature corrected data for Focal plane temperature <= -118.5 C).
The unit is now CTI/year not CTI/day.
| Average of ACIS-I CCDs (MnKa) slope: | 1.373e-02 CTI/year | (3.761e-05 CTI/day) |
|---|---|---|
| Detrended slope: | 1.874e-02 CTI/year | (5.135e-05 CTI/day) |
We display all bad pixels that have showed up in past, and, if any, previously unknown bad pixels appeared in the last 14 days. We also list hot pixels (defined as 1000 above the average of bias background). Warm columns 509-514 are probably due to boundaries.
New definitions of warm pixels and flickering pixels (May 15, 2014). If a pixel displays the level beyond a threshold for more than 70% of the time in the past two weeks, the pixel is categorized as a "warm" pixel. If a pixel is above the threshold more than 30% of time but less than 70% of the time in the past two weeks, the pixel is categorized as a "flickering" pixel.
| CCD0 | CCD1 | CCD2 | CCD3 | CCD4 | CCD5 | CCD6 | CCD7 | CCD8 | CCD9 | |
|---|---|---|---|---|---|---|---|---|---|---|
| Previously Unknown Bad Pixels | (213,402) | |||||||||
| Current Warm Pixels | (21,95) | (1000,214) | (197,241) | |||||||
| Flickering Warm Pixels | (692,141) (143,700) | (910,239) (802,665) | (178,149) (726,537) (526,66) | (811,637) (680,391) (318,53) | (233,227) (607,281) (357,303) (282,385) (369,376) (669,577) (263,317) (280,313) (161,206) (258,797) (341,427) | (884,31) | (335,412) | (182,474) (881,53) (136,65) (139,109) | (150,374) (40,49) (636,819) (65,23) | |
| Current Hot Pixels | ||||||||||
| Flickering Hot Pixels | ||||||||||
| Warm column candidates | 510 512 1022 | 512 1022 | ||||||||
| Flickering Warm Column Candidates | 115 |
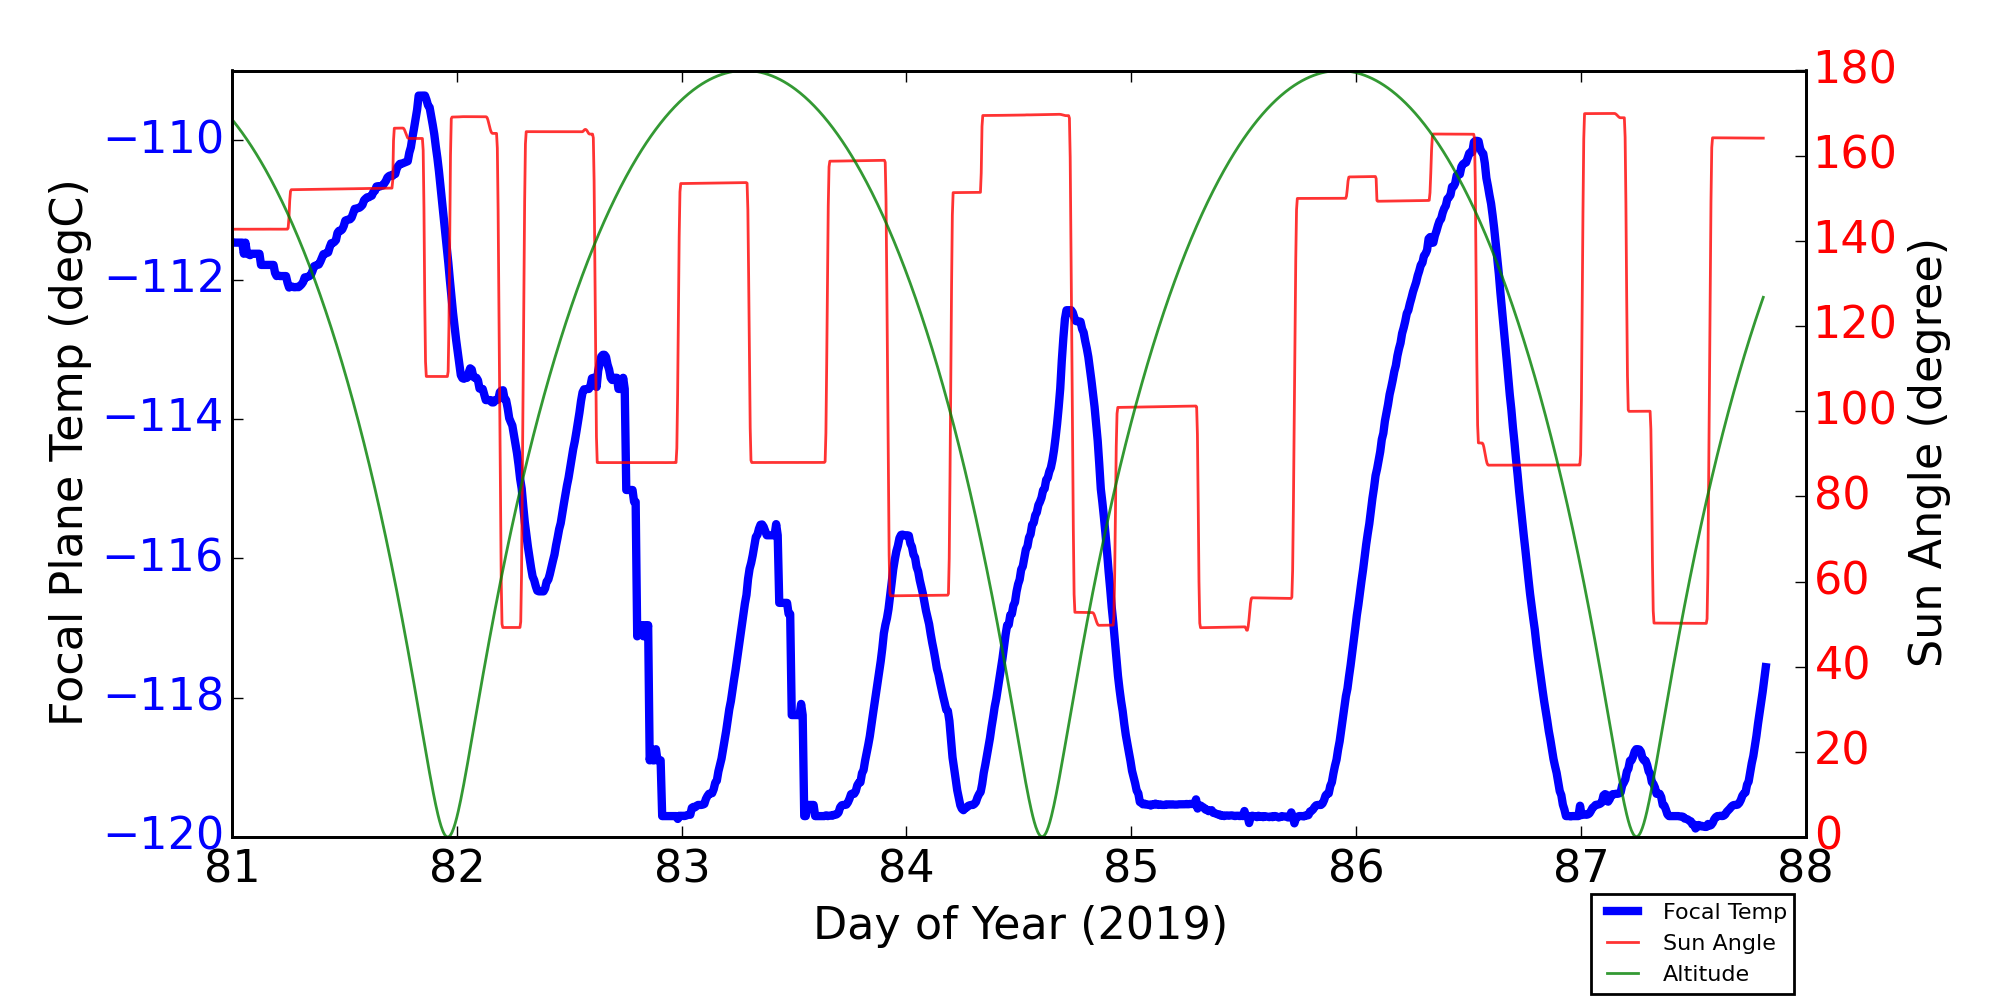
For this period, 6 peaks are observed.
| Day (DOY) | Temp (C) | Width (Days) | |
|---|---|---|---|
| 081.83 | -109.36 | 1.06 | |
| 082.66 | -113.11 | 2.76 | |
| 083.36 | -115.55 | 0.38 | |
| 083.99 | -115.67 | 0.49 | |
| 084.74 | -112.47 | 0.80 | |
| 086.53 | -110.01 | 1.13 |
Weekly focal plane temperature with sun angle, earth angle, and altitude overplotted. Sun angle is the solar array angle, that is the angle between the sun and the optical axis (+X axis). The earth angle is the angle between earth and the ACIS radiator (+Z axis). Altitude varies from 34 kkm to 128 kkm.
9 TSC moves this period
| weekly average time/step | 0.00128 s |
|---|---|
| mission average time/step | 0.00136 s |
New violations or new extrema are shown in blue cells.
| MSID | 03/22/19 | 03/23/19 | 03/24/19 | 03/25/19 | 03/26/19 | 03/27/19 | 03/28/19 | yellow limits (lower) upper | red limits (lower) upper | Units | Description |
| 1PIN1AT | 344.99 | 344.99 | 344.99 | 344.99 | 344.99 | 344.99 | 344.99 | (-21.65) 53.35 | (-26.65) 58.41 |
1A | #PSMC TEMP |
| HRMACAV | (284.85) | (284.85) | (284.85) | (284.85) | (284.85) | (288.23) | (284.85) | (293.4) 294.8 | (292.8) 295.5 |
TEMP | # HRMA CAVITY AVG |
| HRMACAV | 295.36 | 295.27 | 295.17 | 295.20 | 295.23 | 295.30 | 295.35 | (293.4) 294.8 | (292.8) 295.5 |
TEMP | # HRMA CAVITY AVG |
| MZOBACONE | (221.33) | (221.33) | (221.33) | (221.33) | (260.2) 303.0 | (250.2) 308.0 |
CONE | # -Z SIDE OBA | |||
| MZOBACONE | 305.24 | 303.48 | 304.98 | 305.71 | 304.13 | (260.2) 303.0 | (250.2) 308.0 |
CONE | # -Z SIDE OBA | ||
| TFTERANGE | (0.00) | (0.00) | (0.00) | (0.00) | (0.00) | (16.7) 37.5 | (11.1) 45.0 |
K | # TFTE VENT/RAD TEMP | ||
| TFTERANGE | 37.76 | 38.84 | 38.84 | 38.87 | 38.25 | (16.7) 37.5 | (11.1) 45.0 |
K | # TFTE VENT/RAD TEMP | ||
| IMHVLV | (0.00) | (99.00) | (126.0) 128.0 | (125.0) 129.0 |
(2IMHVLV) | #Imaging bot MCP HV monitor | |||||
| IMHVLV | 130.00 | (126.0) 128.0 | (125.0) 129.0 |
(2IMHVLV) | #Imaging bot MCP HV monitor | ||||||
| IMHBLV | (0.00) | (105.00) | (126.0) 128.0 | (125.0) 129.0 |
(2IMHBLV) | #Imaging bot and top MCP HV monitor | |||||
| IMHBLV | 160.00 | (126.0) 128.0 | (125.0) 129.0 |
(2IMHBLV) | #Imaging bot and top MCP HV monitor | ||||||
| SPHBLV | (62.00) | (28.00) | (78.00) | (79.0) 128.0 | (78.0) 129.0 |
(2SPHBLV) | #Spect bot and top MCP HV monitor | ||||
| S2HVLV | (0.00) | (82.00) | (82.00) | (83.00) | (83.00) | (83.00) | (83.00) | (126.0) 128.0 | (125.0) 129.0 |
(2S2HVLV) | #Shield PMT 2 HV monitor |
| RSRFALV | (0.00) | (3.00) | (59.00) | (150.00) | (150.00) | (172.0) 174.0 | (171.0) 175.0 |
V | #Range switch setting (2RSRFALV) | ||
| RSRFALV | 185.00 | 192.00 | 191.00 | 190.00 | 190.00 | 190.00 | 190.00 | (172.0) 174.0 | (171.0) 175.0 |
V | #Range switch setting (2RSRFALV) |
| PRBSCR | (-8.65) | (-2.99) | (1.24) 1.92 | (0.90) 2.26 |
AMP | #Primary bus current (2PRBSCR) | |||||
| PRBSVL | (-40.00) | (6.56) | (23.0) 34.0 | (22.0) 35.0 |
V | #Primary bus voltage (2PRBSVL) | |||||
| SPINATM | (-30.96) | (-34.50) | (-34.50) | (-12.0) 35.0 | (-15.0) 40.0 |
C | #Spect det temperature (2SPINATM) | ||||
| SPINATM | 131.47 | (-12.0) 35.0 | (-15.0) 40.0 |
C | #Spect det temperature (2SPINATM) | ||||||
| LVPLATM | (-51.40) | (-51.40) | (-51.40) | (-32.0) 50.0 | (-35.0) 55.0 |
C | #LVPS plate temperature (2LVPLATM) | ||||
| LVPLATM | 58.61 | (-32.0) 50.0 | (-35.0) 55.0 |
C | #LVPS plate temperature (2LVPLATM) | ||||||
| SMTRATM | (-54.93) | (-17.0) 45.0 | (-20.0) 50.0 |
C | #Selected motor temperature (2SMTRATM) | ||||||
| SMTRATM | 55.20 | 55.20 | 55.20 | (-17.0) 45.0 | (-20.0) 50.0 |
C | #Selected motor temperature (2SMTRATM) | ||||
| 3FLCABPT | 297.48 | 293.95 | (253.15) 293.15 | (235.65) 310.65 |
K | #FLCA BASEPLATE (+X) | |||||
| 3TSMXCET | 290.75 | 288.25 | 285.76 | 290.75 | 285.76 | 288.25 | 288.25 | (153.15) 263.15 | (148.15) 353.15 |
K | #-X TURTLE SHELL NR HRC CEA |
| 3TSMXSPT | 659.89 | 659.89 | 659.89 | 659.89 | 659.89 | 659.89 | 659.89 | (203.15) 283.15 | (148.15) 353.15 |
K | #-X TURTLE SHELL NR ACIS SS |
| 3TSMYDPT | 270.79 | 270.79 | (203.15) 263.15 | (148.15) 353.15 |
K | #-Y TURTLE SHELL NR ACIS DPA | |||||
| 3TSPZSPT | 293.24 | 295.74 | (233.15) 293.15 | (148.15) 353.15 |
K | #+Z TURTLE SHELL NR ACIS SS | |||||
| ELBI | 62.16 | 64.77 | 65.56 | 66.89 | 63.99 | 66.35 | 64.51 | (16.0) 50.0 | (13.0) 66.0 |
AMP | #LOAD BUS CURRENT (ELBI_LOW) |
| ELBV | (27.89) | (27.89) | (27.73) | (28.0) 32.5 | (25.0) 34.6 |
V | #LOAD BUS VOLTAGE | ||||
| TAPE1PST | (318.54) | (318.54) | (318.54) | (319.33) | (318.93) | (368.15) 376.15 | (363.15) 381.15 |
K | #PEA-1 POWER SUPPLY TEMP | ||
| TAPE2PST | (294.00) | (292.28) | (293.14) | (293.14) | (293.14) | (294.00) | (294.00) | (323.15) 330.15 | (318.15) 335.15 |
K | #PEA-2 POWER SUPPLY TEMP |
| TATECDRT | (293.57) | (292.28) | (292.28) | (292.28) | (293.57) | (293.14) | (321.15) 328.15 | (316.15) 333.15 |
K | #TEC DRIVER RDNT TEMP | |
| 4PRT3AT | (257.79) | (258.46) | (258.46) | (257.79) | (258.46) | (257.79) | (257.79) | (273.15) 283.15 | (53.15) 368.15 |
K | #IP A: PRE-COLLIMATOR PRT 3 TEMPERATURE |
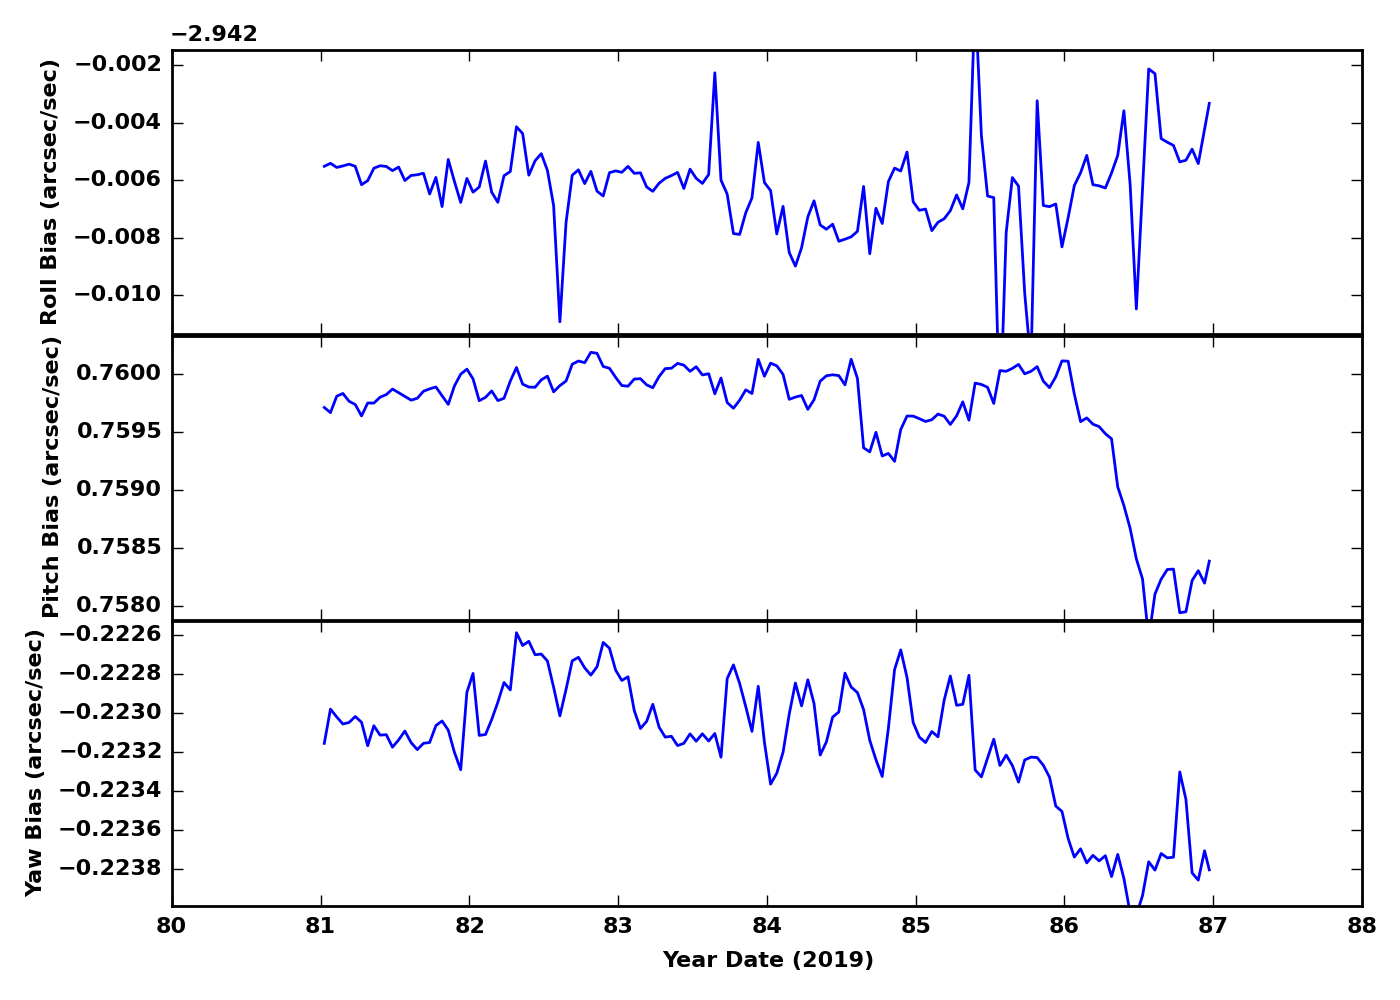
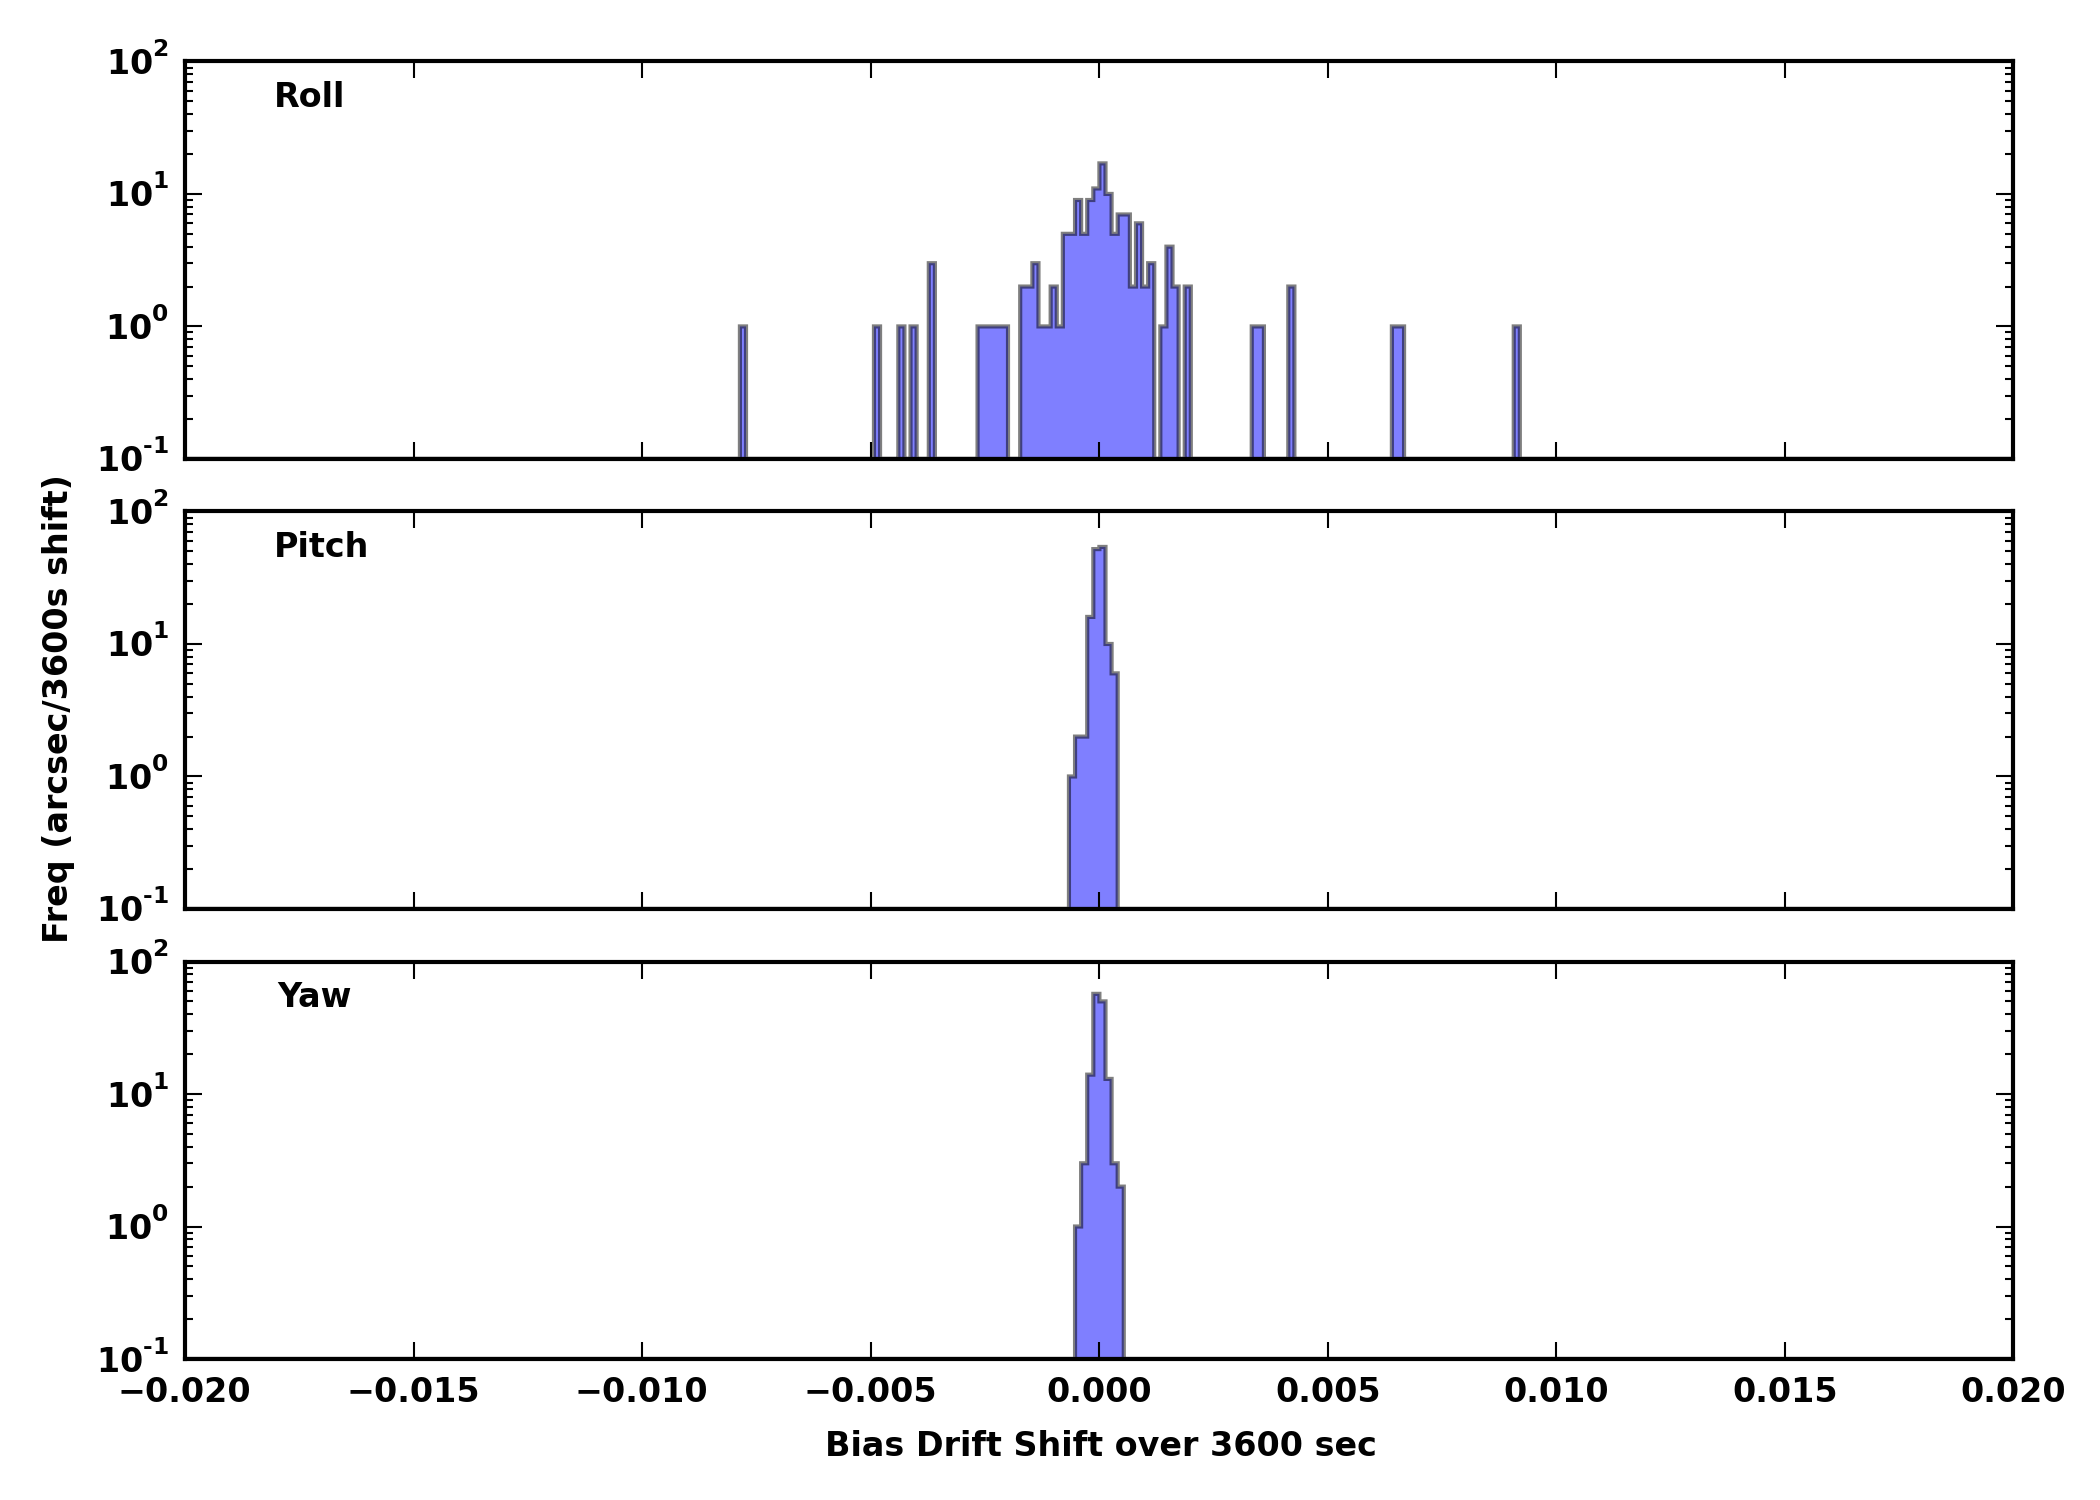
| Gyro Bias Drift | Gyro Bias Drift Histogram |
|---|---|
|
|
| OBSID | DETECTOR | GRATING | TARGET | ANALYSIS | ACA |
|---|---|---|---|---|---|
| 20734 | HRC-I | HETG | TW Hya | OK | OK |
| 21322 | ACIS-567 | NONE | GW170817 | OK | OK |
| 22157 | ACIS-567 | NONE | GW170817 | OK | OK |
| 22153 | ACIS-35678 | NONE | M84 | OK | OK |
| 22155 | HRC-S | LETG | SNR 1987A | OK | OK |
| 22158 | ACIS-5678 | NONE | GW170817 | OK | OK |
| 21441 | ACIS-56789 | NONE | 2M 1310-1714 | OK | OK |
| 22054 | ACIS-01236 | NONE | SPT-CLJ2259-5301 | OK | OK |
| 21495 | ACIS-67 | NONE | MRC1226-297 | OK | OK |
| 21215 | ACIS-456789 | HETG | Swift J1728.9-3613 | CC | OK |
| 21193 | ACIS-23678 | NONE | HD 201796 | OK | OK |
| 21446 | ACIS-23678 | NONE | J032224.64+401119.8 | OK | OK |
| 20572 | ACIS-0123 | NONE | SDSSJ1329+2243 | OK | OK |
| 21525 | ACIS-0123 | NONE | J140018.94+010454.0 | OK | OK |
| 21470 | ACIS-678 | NONE | UGC 09215 | OK | OK |
| 21457 | ACIS-7 | NONE | M87 | OK | OK |
| 21362 | ACIS-67 | NONE | N132D | OK | OK |
| 21845 | ACIS-3567 | NONE | M84 | OK | OK |
| 21458 | ACIS-7 | NONE | M87 | OK | OK |
| 21634 | ACIS-678 | NONE | SDSS_J135225.80+132853.2 | OK | OK |
This week's focus is PCAD
Last reported on
Jan 10.
Only the most interesting or representative msids are shown below.
For a full listing choose the bulletted link.
| MSID | Mean | RMS | Delta/Yr | Delta/Yr/Yr | Unit | Description |
|---|---|---|---|---|---|---|
| afsspc2v | 1.196 | 1.666 | 0.021+/-0.001 | (5.41+/-2.21)e-5 | V | FSS POWER CONV 2 VOLTAGE |
| airu2g1i | 85.707 | 37.564 | 4.317+/-0.058 | 0.037+/-0.031 | MAMP | IRU-2 GYRO #1 CURRENT |
| airu2g2i | 87.080 | 41.800 | 5.704+/-0.055 | 0.238+/-0.037 | MAMP | IRU-2 GYRO #2 CURRENT |
| airu2g2t | 332.325 | 20.176 | 2.743+/-0.052 | -0.002+/-0.000 | K | IRU-2 GYRO #2 TEMP |
| MSID | Mean | RMS | Delta/Yr | Delta/Yr/Yr | Unit | Description |
|---|---|---|---|---|---|---|
| aogyrct1 | 10.408 | 742.838 | -2.624+/-0.835 | -7.872+/-9.846 | CNTS | ACCUMULATED GYRO PULSE COUNTS FROM OBC SELECTED GYRO 1 |
| aogyrct2 | 16.541 | 698.258 | 0.380+/-0.371 | -7.501+/-5.756 | CNTS | ACCUMULATED GYRO PULSE COUNTS FROM OBC SELECTED GYRO 2 |
| aogyrct3 | -32.988 | 2927.846 | 4.992+/-4.553 | -0.426+/-50.063 | CNTS | ACCUMULATED GYRO PULSE COUNTS FROM OBC SELECTED GYRO 3 |
| aogyrct4 | -29.841 | 875.721 | 0.724+/-0.321 | 2.244+/-4.663 | CNTS | ACCUMULATED GYRO PULSE COUNTS FROM OBC SELECTED GYRO 4 |
If you have any questions, please contact: swolk@head.cfa.harvard.edu