Archive of all weekly reports
Archive of monthly reports
Quiet
Although we prefer to quote CTI values of the cleanest data (FT <= -119.7 C, int time > 7000sec), the data that fulfills these conditions are getting rare. We now quote CTI based on temperature corrected data for Focal plane temperature <= -118.5 C).
The unit is now CTI/year not CTI/day.
| Average of ACIS-I CCDs (MnKa) slope: | 6.028e-02 CTI/year | (1.652e-04 CTI/day) |
|---|---|---|
| Detrended slope: | 6.636e-02 CTI/year | (1.818e-04 CTI/day) |
We display all bad pixels that have showed up in past, and, if any, previously unknown bad pixels appeared in the last 14 days. We also list hot pixels (defined as 1000 above the average of bias background). Warm columns 509-514 are probably due to boundaries.
New definitions of warm pixels and flickering pixels (May 15, 2014). If a pixel displays the level beyond a threshold for more than 70% of the time in the past two weeks, the pixel is categorized as a "warm" pixel. If a pixel is above the threshold more than 30% of time but less than 70% of the time in the past two weeks, the pixel is categorized as a "flickering" pixel.
| CCD0 | CCD1 | CCD2 | CCD3 | CCD4 | CCD5 | CCD6 | CCD7 | CCD8 | CCD9 | |
|---|---|---|---|---|---|---|---|---|---|---|
| Previously Unknown Bad Pixels | ||||||||||
| Current Warm Pixels | (143,700) (692,141) | (910,239) (802,665) | (178,149) (526,66) (726,537) | (21,95) (680,391) | (335,412) | |||||
| Flickering Warm Pixels | (370,70) | (665,25) | (669,458) (811,637) (318,53) | (367,511) (357,303) (258,797) (369,376) (341,427) (161,206) (263,317) | (1000,214) | (139,109) (881,53) (182,474) (197,241) | ||||
| Current Hot Pixels | ||||||||||
| Flickering Hot Pixels | ||||||||||
| Warm column candidates | 512 510 1022 | 512 1022 | ||||||||
| Flickering Warm Column Candidates |
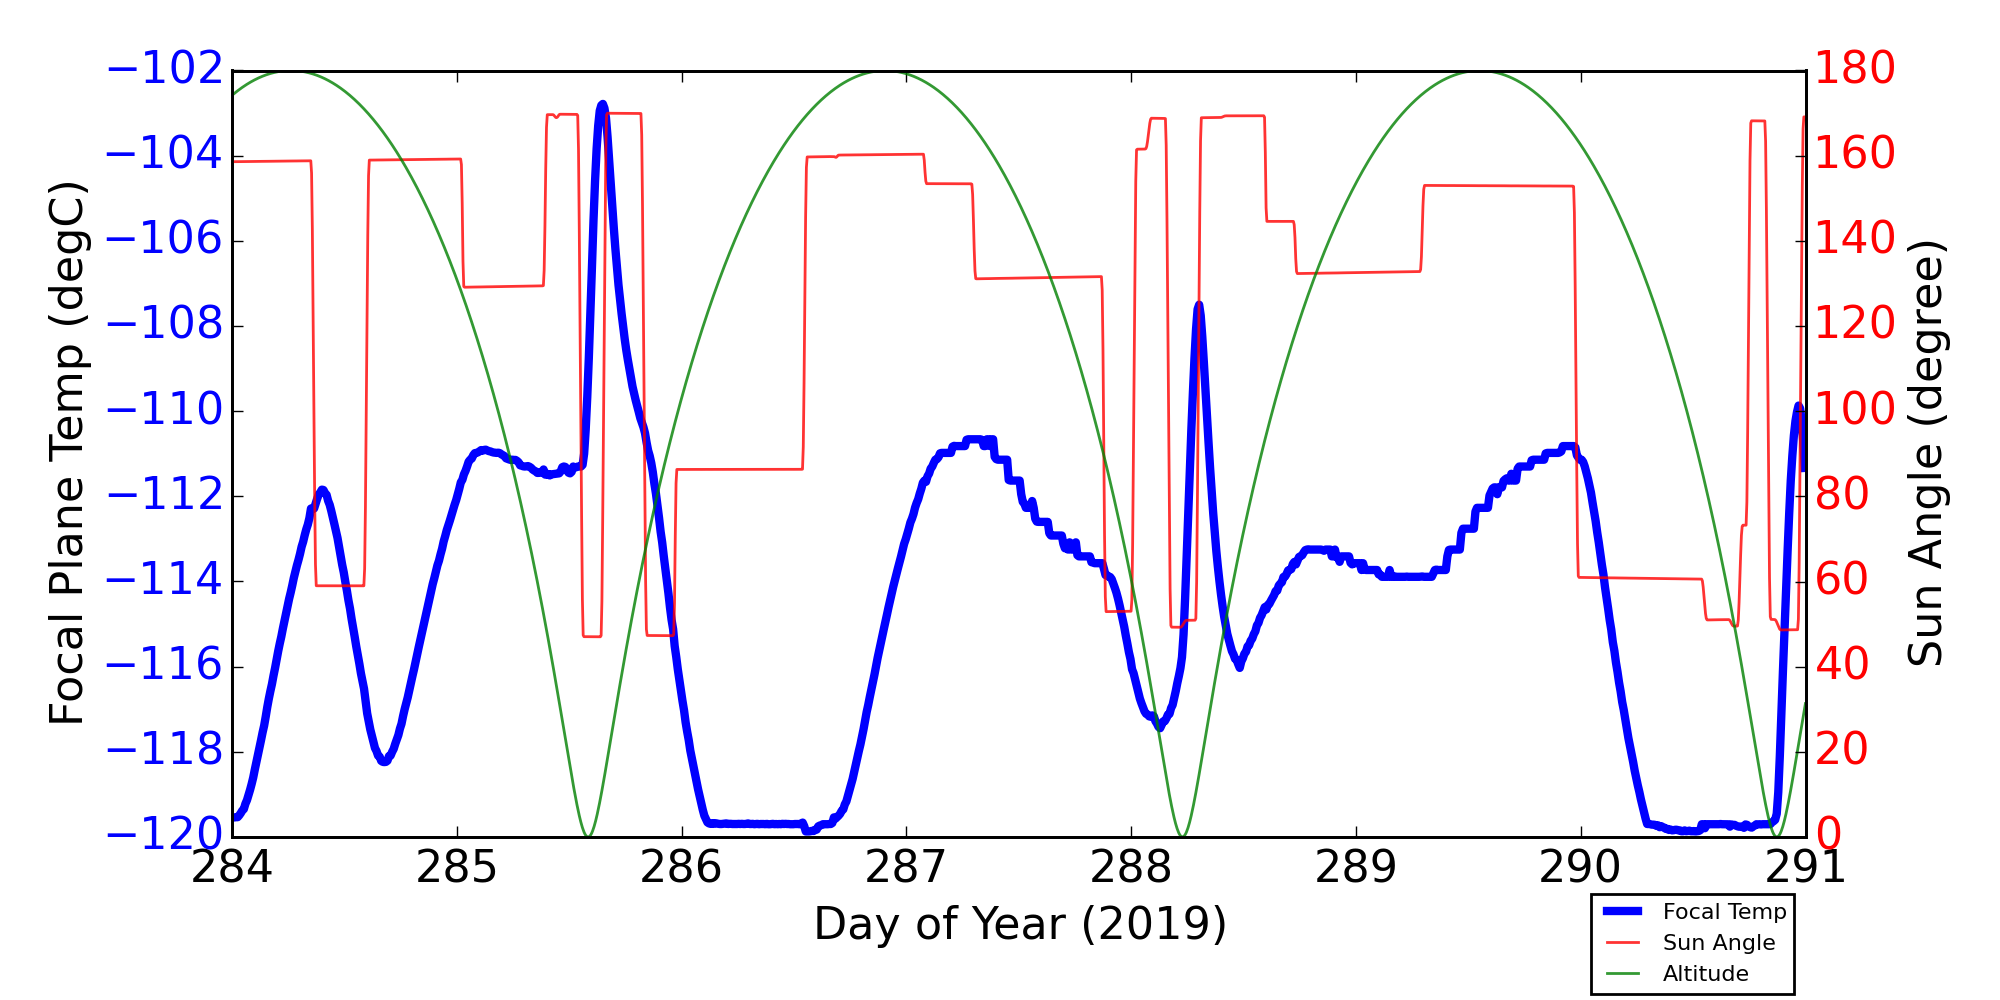
For this period, 7 peaks are observed.
| Day (DOY) | Temp (C) | Width (Days) | |
|---|---|---|---|
| 283.32 | -115.83 | 0.44 | |
| 284.41 | -111.85 | 0.74 | |
| 285.66 | -102.88 | 1.45 | |
| 287.34 | -110.68 | 1.40 | |
| 288.31 | -107.75 | 0.35 | |
| 289.98 | -110.85 | 1.81 | |
| 290.98 | -109.94 | 0.21 |
Weekly focal plane temperature with sun angle, earth angle, and altitude overplotted. Sun angle is the solar array angle, that is the angle between the sun and the optical axis (+X axis). The earth angle is the angle between earth and the ACIS radiator (+Z axis). Altitude varies from 34 kkm to 128 kkm.
13 TSC moves this period
| weekly average time/step | 0.00129 s |
|---|---|
| mission average time/step | 0.00136 s |
New violations or new extrema are shown in blue cells.
| MSID | 10/11/19 | 10/12/19 | 10/13/19 | 10/14/19 | 10/15/19 | 10/16/19 | 10/17/19 | yellow limits (lower) upper | red limits (lower) upper | Units | Description |
| TSCTSF3 | (268.43) | (278.15) 359.15 |
(269.15) 483.15 |
K | SC-TS FITTING -3 TEMP | ||||||
| TSCTSF4 | (268.79) | (283.15) 359.15 |
(269.15) 483.15 |
K | SC-TS FITTING -4 TEMP | ||||||
| SPHBLV | (72.00) | (72.00) | (45.00) | (79.0) 128.0 |
(78.0) 129.0 |
(2SPHBLV) | Spect Bot & Top MCP HV Monitor | ||||
| CTXBPWR | (0.00) | (0.00) | (0.00) | (0.00) | (0.00) | (0.00) | (0.00) | (36.12) 37.0 |
(36.0) 38.0 |
DBM | TRANSMITTER B OUTPUT POWER |
| CALPALV | (72.00) | (126.0) 128.0 |
(125.0) 129.0 |
V | Cal Pulser Amplitude | ||||||
| OBACONEAVG | 304.96 | 303.19 | 303.20 | 302.39 | 304.14 | (282.5) 300.0 |
(281.8) 301.0 |
K | OBA CONE AVG TEMP | ||
| S2HVLV | (82.00) | (126.0) 128.0 |
(125.0) 129.0 |
(2S2HVLV) | Shield PMT 2 HV Monitor | ||||||
| TCM_TX1 | (268.79) | (266.61) | (266.61) | (266.61) | (266.97) | (266.61) | (266.97) | (283.15) 348.15 |
(269.15) 404.15 |
K | TRANSPONDER-1 EXT BPL TEMP |
| TEP_PSU2 | (264.06) | (264.06) | (264.06) | (283.15) 343.15 |
(264.15) 393.15 |
K | PSU-2 TEMP | ||||
| TCM_PA1 | (258.16) | (258.56) | (258.16) | (258.56) | (257.76) | (259.32) | (269.15) 348.15 |
(260.15) 413.15 |
K | RF POWER AMP-1 EXT BPL TEMP | |
| TCM_PA2 | (259.32) | (259.32) | (259.32) | (259.69) | (258.96) | (269.15) 348.15 |
(260.15) 413.15 |
K | RF POWER AMP-2 EXT BPL TEMP | ||
| HRMACAV | 295.55 | (293.4) 294.8 |
(292.8) 295.5 |
TEMP | HRMA CAVITY AVG TEMP | ||||||
| 1PIN1AT | 344.99 | 344.99 | (253.15) 303.15 |
(236.65) 309.65 |
K | PSMC TEMP 1A | |||||
| SPINATM | (-67.99) | (-117.76) | (-12.0) 35.0 |
(-15.0) 40.0 |
C | Spect Det Temperature | |||||
| TPCP_RW3 | (277.53) | (288.15) 363.15 |
(278.15) 404.15 |
K | RWA -3 TEMP (+Z PCAD COMP) | ||||||
| TPCP_RW2 | (277.89) | (288.15) 363.15 |
(278.15) 404.15 |
K | RWA -2 TEMP (+Z PCAD COMP) | ||||||
| S1HVLV | (78.00) | (73.00) | (80.0) 128.0 |
(79.0) 129.0 |
(2S1HVLV) | Shield PMT 1 HV Monitor | |||||
| 1PIN1ATC | 71.84 | 71.84 | (-20.0) 30.0 |
(-36.5) 36.5 |
C | PSMC TEMP 1A | |||||
| OBAAVG | 301.31 | (282.5) 300.0 |
(281.4) 301.0 |
K | OBA/TFTE TEMP |
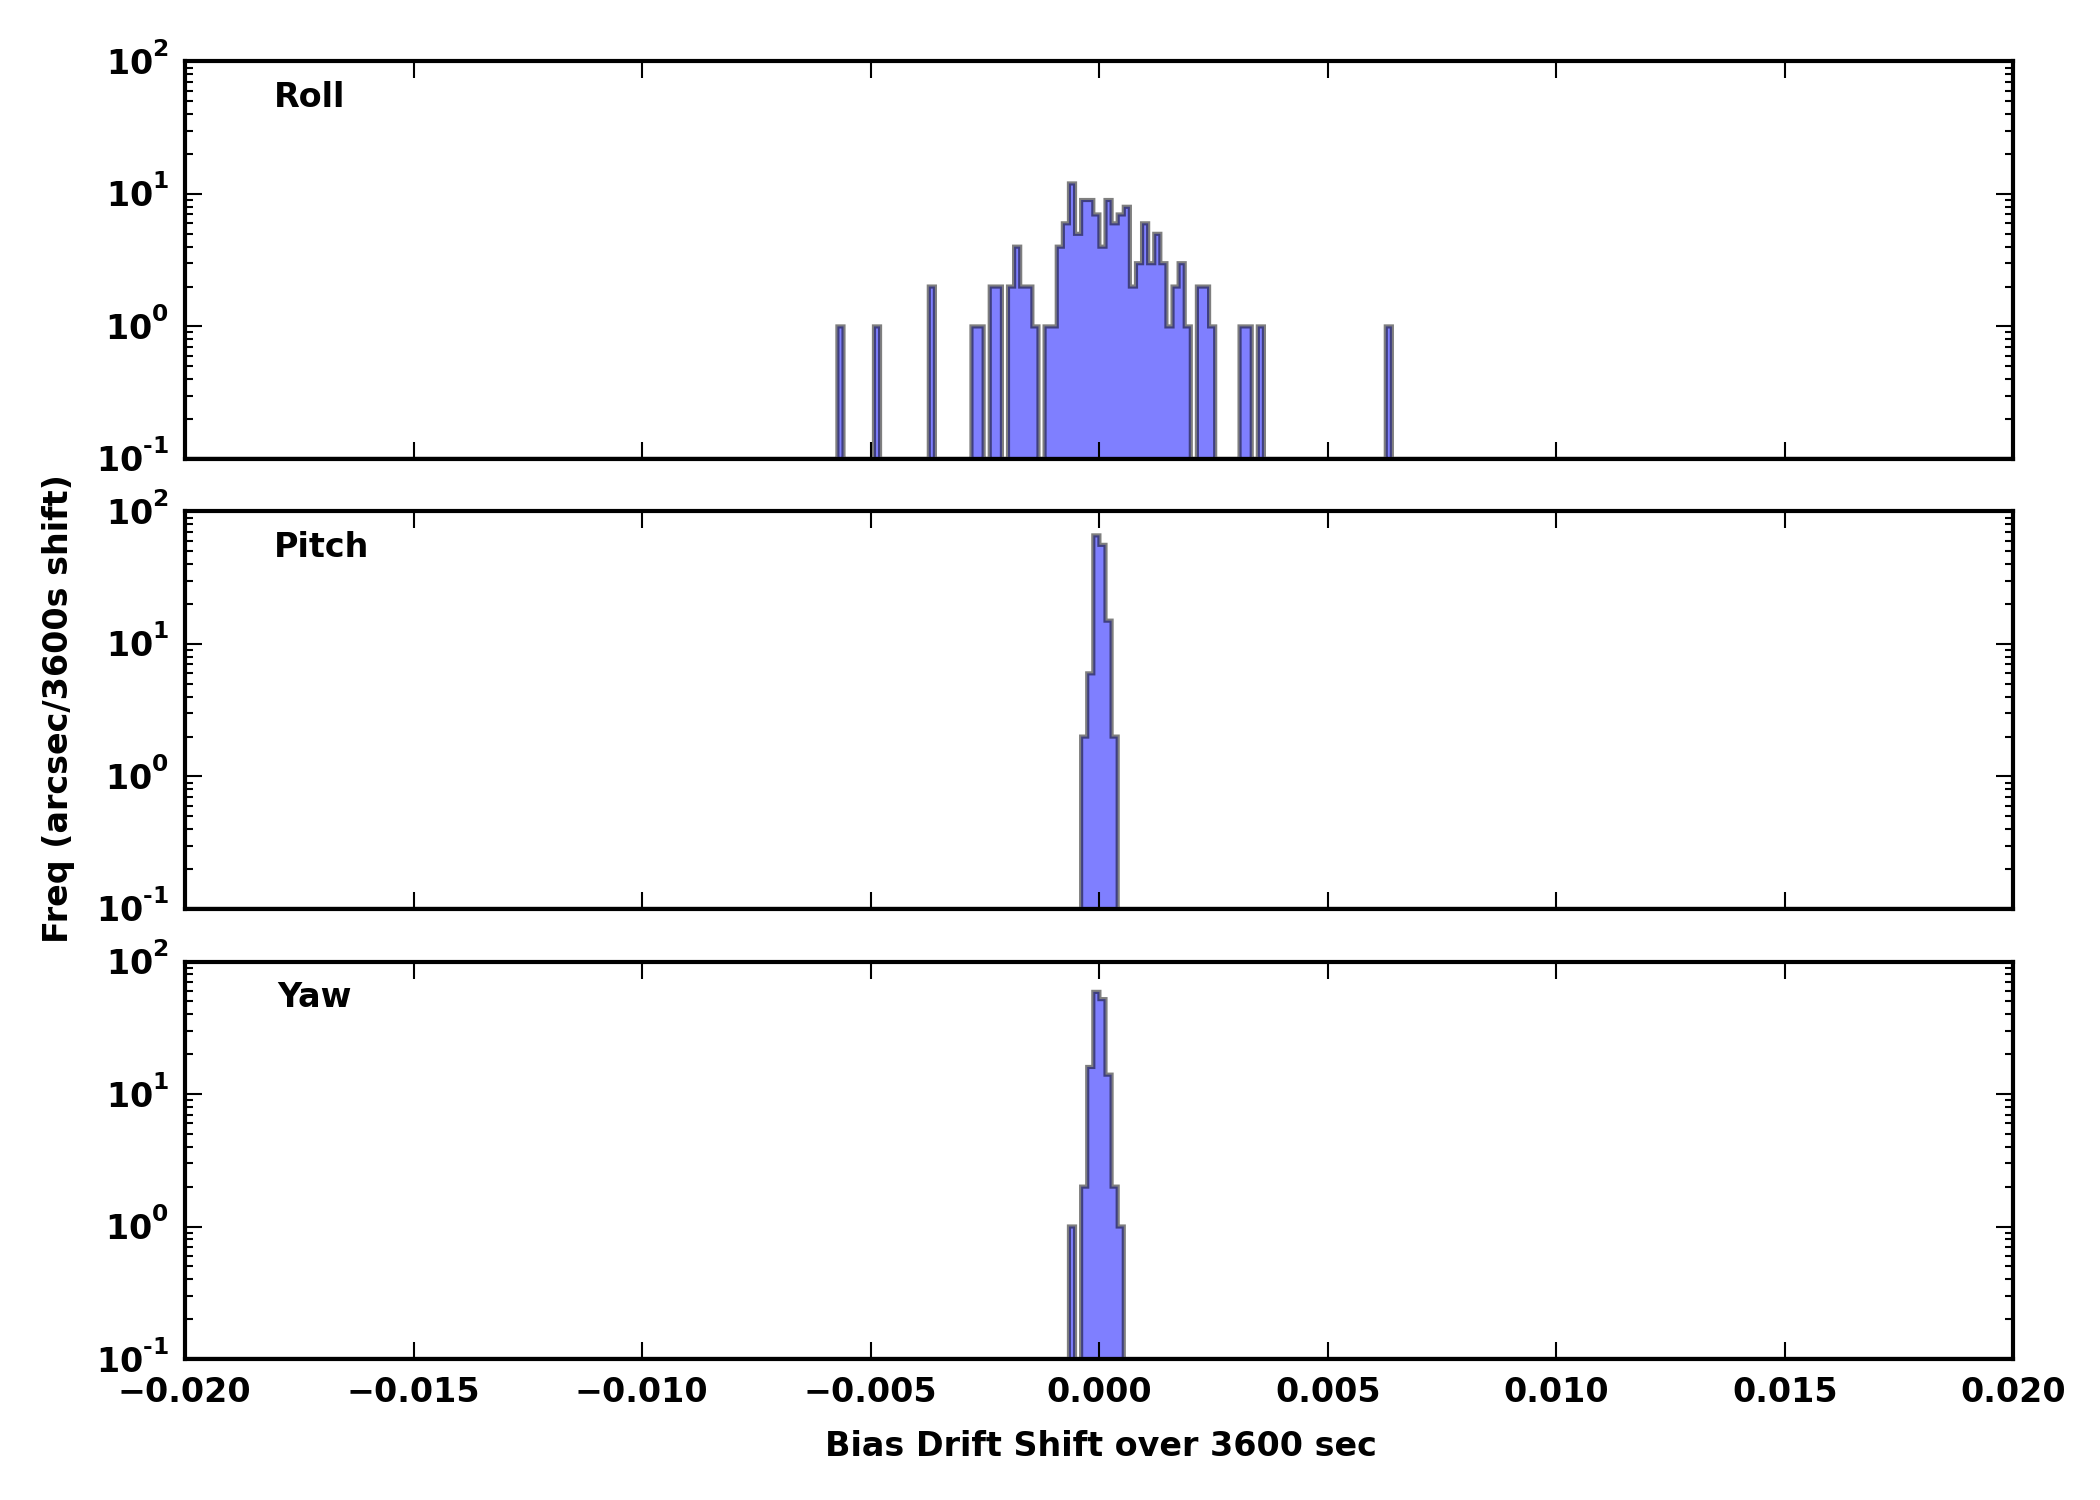
| Gyro Bias Drift | Gyro Bias Drift Histogram |
|---|---|
|
|
| OBSID | DETECTOR | GRATING | TARGET | ANALYSIS | ACA |
|---|---|---|---|---|---|
| 21423 | ACIS-7 | NONE | 2MASXJ00253292+6821442 | OK | OK |
| 22866 | ACIS-5678 | HETG | Eta Carinae | OK | OK |
| 22868 | ACIS-0123 | NONE | XLSSC 122 | OK | OK |
| 22867 | ACIS-5678 | HETG | Eta Carinae | OK | OK |
| 22869 | ACIS-0123 | NONE | XLSSC 122 | OK | OK |
| 21390 | ACIS-25678 | NONE | AT2019pev | OK | OK |
| 21650 | ACIS-012367 | NONE | JWST-DTDF-7 | OK | OK |
| 22871 | ACIS-7 | NONE | UGC1479 | OK | OK |
| 22870 | ACIS-0123 | NONE | XLSSC 122 | OK | OK |
| 22344 | HRC-S | LETG | UV Cet | OK | OK |
| 21404 | HRC-S | LETG | AT2019pev | OK | OK |
| 21491 | ACIS-67 | NONE | MRC0941-200 | OK | OK |
| 21488 | ACIS-67 | NONE | MRC0222-234 | OK | OK |
| 22875 | HRC-S | LETG | AT2019pev | OK | OK |
| 21422 | ACIS-7 | NONE | ESO137-G034 | OK | OK |
| 22064 | ACIS-2367 | NONE | SDSS J1008+0220 | OK | OK |
This week's focus is Ground Computations
Last reported on
Aug 01.
Only the most interesting or representative msids are shown below.
For a full listing choose the bulletted link.
| MSID | Mean | RMS | Delta/Yr | Delta/Yr/Yr | Unit | Description |
|---|---|---|---|---|---|---|
| 1dppwra | 35.299 | 5.935 | -0.561+/-0.019 | -0.069+/-0.090 | W | DPA POWER A W |
| 1dppwrb | 31.579 | 6.064 | -0.420+/-0.022 | -0.101+/-0.110 | W | DPA P WER B W |
| MSID | Mean | RMS | Delta/Yr | Delta/Yr/Yr | Unit | Description |
|---|---|---|---|---|---|---|
| flexadif | 64.192 | 5.373 | -0.383+/-0.007 | -0.031+/-0.079 | K | DIFF FLEX A & SET |
| flexbdif | 60.357 | 4.831 | -0.048+/-0.006 | -0.071+/-0.085 | K | DIFF FLEX B & SET |
| flexcdif | 72.538 | 9.514 | -0.406+/-0.019 | 0.026+/-0.286 | K | DIFF FLEX C & SET |
If you have any questions, please contact: swolk@head.cfa.harvard.edu