| CCD0 | CCD1 | CCD2 | CCD3 | CCD4 | CCD5 | CCD6 | CCD7 | CCD8 | CCD9 | |
|---|---|---|---|---|---|---|---|---|---|---|
| Previously Unknown Bad Pixels | ||||||||||
| Current Warm Pixels | (335,412) | |||||||||
| Flickering Warm Pixels | (143,700) (154,9) (692,141) | (910,239) (787,181) (802,665) | (726,537) (526,66) (665,25) (178,149) | (753,344) (21,95) (144,50) (811,637) | (670,387) (287,164) (1000,214) | (139,109) (881,53) (197,241) (675,304) | ||||
| Current Hot Pixels | ||||||||||
| Flickering Hot Pixels | ||||||||||
| Warm column candidates | 1022 510 512 | 1022 512 | ||||||||
| Flickering Warm column candidates |
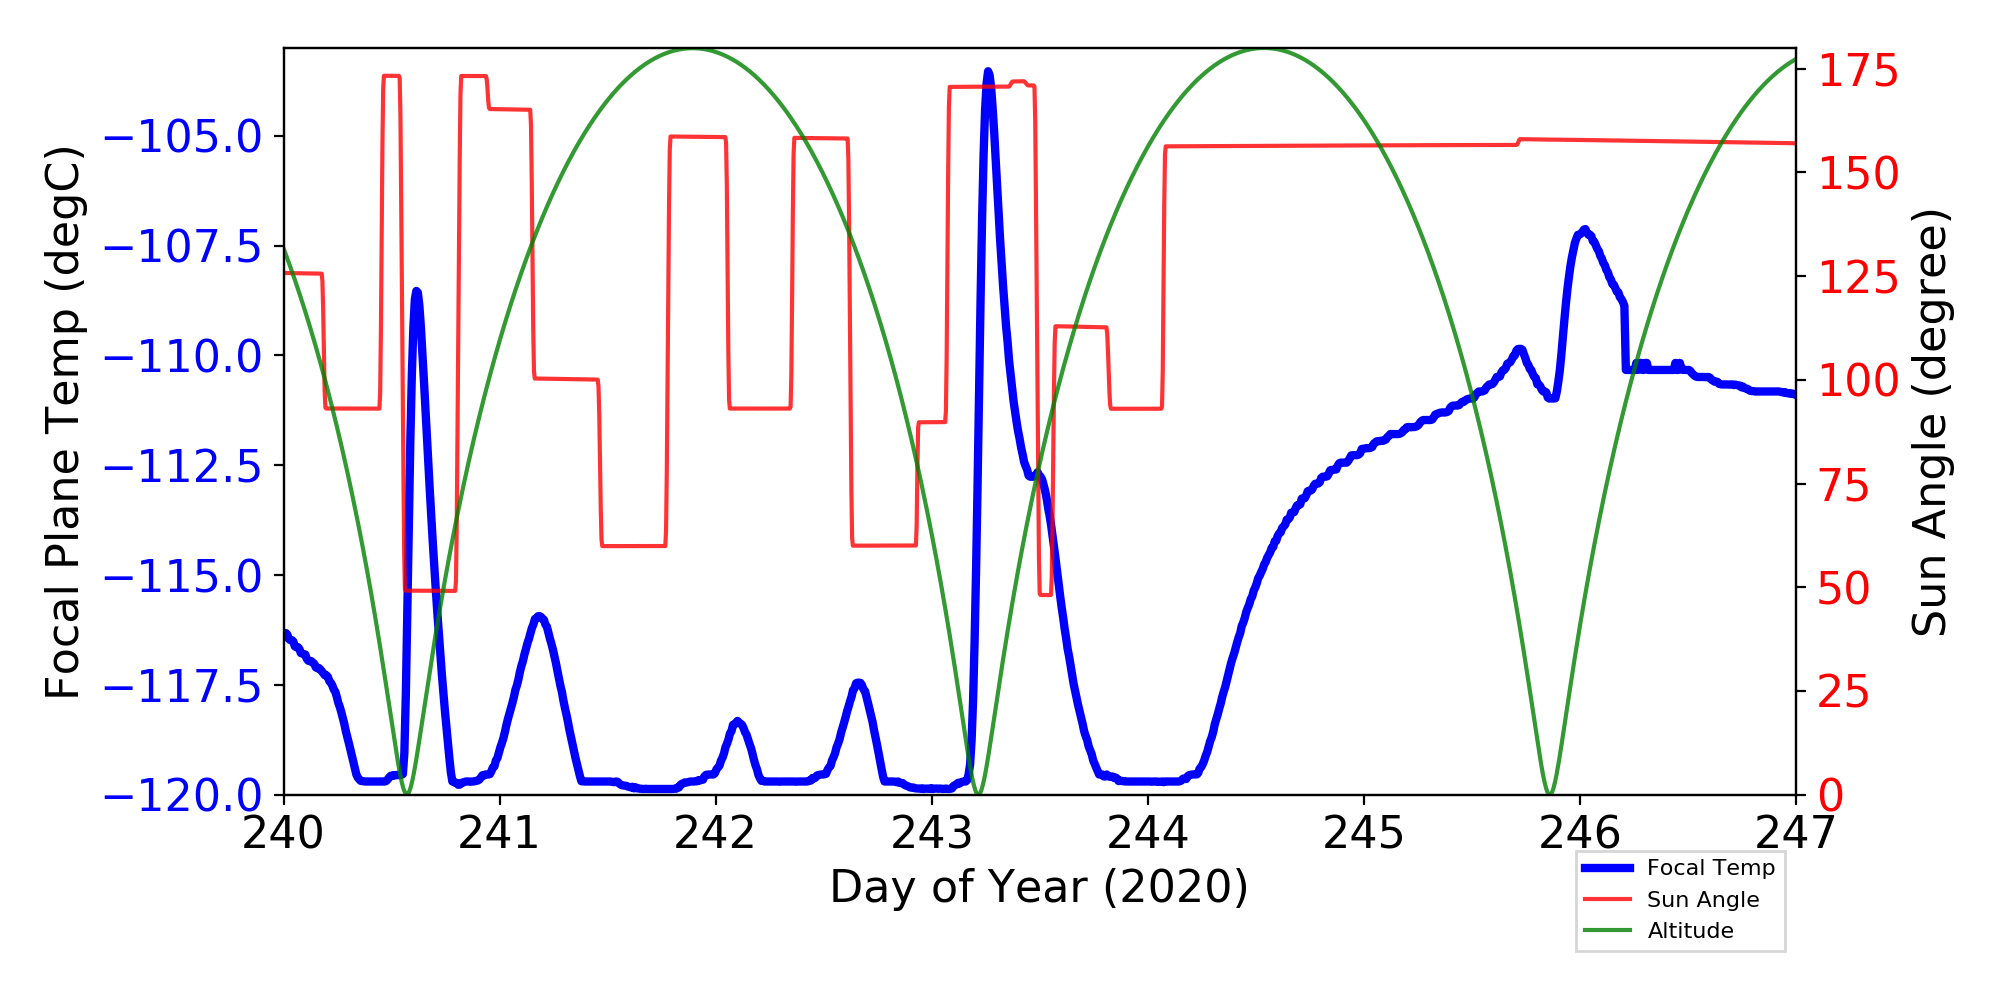
ACIS Focal Plane Temperature
For this period, 6 peaks are observed.
| Day (DOY) | Temp (C) | Width (Days) | |
|---|---|---|---|
| 240.62 | -108.57 | 0.28 | |
| 241.19 | -115.95 | 0.45 | |
| 242.11 | -118.35 | 0.28 | |
| 242.67 | -117.45 | 0.33 | |
| 243.27 | -103.62 | 0.65 | |
| 246.03 | -107.20 | 3.74 |
Weekly focal plane temperature with sun angle, earth angle, and altitude overplotted. Sun angle is the solar array angle, that is the angle between the sun and the optical axis (+X axis). The earth angle is the angle between earth and the ACIS radiator (+Z axis). Altitude varies from 34 kkm to 128 kkm.
SIM Movements
9 TSC moves this period
| weekly average time/step | 0.00134 s |
|---|---|
| mission average time/step | 0.00136 s |
Telemetry
New violations or new extrema are shown in blue cells.
| MSID | 08/28/20 | 08/29/20 | 08/30/20 | 08/31/20 | 09/01/20 | 09/02/20 | 09/03/20 | yellow limits (lower) upper | red limits (lower) upper | Units | Description |
| TSCTSF3 | (267.70) | (278.15) 359.15 |
(269.15) 483.15 |
K | SC-TS FITTING -3 TEMP | ||||||
| HRMACAV | 295.54 | 295.55 | (293.4) 294.8 |
(292.8) 295.5 |
TEMP | HRMA CAVITY AVG TEMP | |||||
| TEP_PSU2 | (263.69) | (263.69) | (263.69) | (283.15) 343.15 |
(264.15) 393.15 |
K | PSU-2 TEMP | ||||
| TCM_TX1 | (267.33) | (266.61) | (266.97) | (266.61) | (266.61) | (266.97) | (266.97) | (283.15) 348.15 |
(269.15) 404.15 |
K | TRANSPONDER-1 EXT BPL TEMP |
| TCM_PA2 | (259.32) | (260.05) | (259.32) | (258.96) | (258.96) | (258.96) | (269.15) 348.15 |
(260.15) 413.15 |
K | RF POWER AMP-2 EXT BPL TEMP | |
| TPCP_RW3 | (277.17) | (288.15) 363.15 |
(278.15) 404.15 |
K | RWA -3 TEMP (+Z PCAD COMP) | ||||||
| TCM_PA1 | (259.32) | (258.56) | (258.96) | (258.56) | (257.36) | (257.36) | (257.36) | (269.15) 348.15 |
(260.15) 413.15 |
K | RF POWER AMP-1 EXT BPL TEMP |
| MZOBACONE | 308.17 | 308.26 | (260.2) 303.0 |
(250.2) 308.0 |
CONE | -Z SIDE OBA CONE | |||||
| TSCTSF4 | (268.43) | (283.15) 359.15 |
(269.15) 483.15 |
K | SC-TS FITTING -4 TEMP | ||||||
| OBAAVG | 301.43 | 301.68 | 301.73 | (282.5) 300.0 |
(281.4) 301.0 |
K | OBA/TFTE TEMP | ||||
| TPCP_RW2 | (275.34) | (288.15) 363.15 |
(278.15) 404.15 |
K | RWA -2 TEMP (+Z PCAD COMP) | ||||||
| OBACONEAVG | 304.30 | 305.35 | 305.41 | (282.5) 300.0 |
(281.8) 301.0 |
K | OBA CONE AVG TEMP |
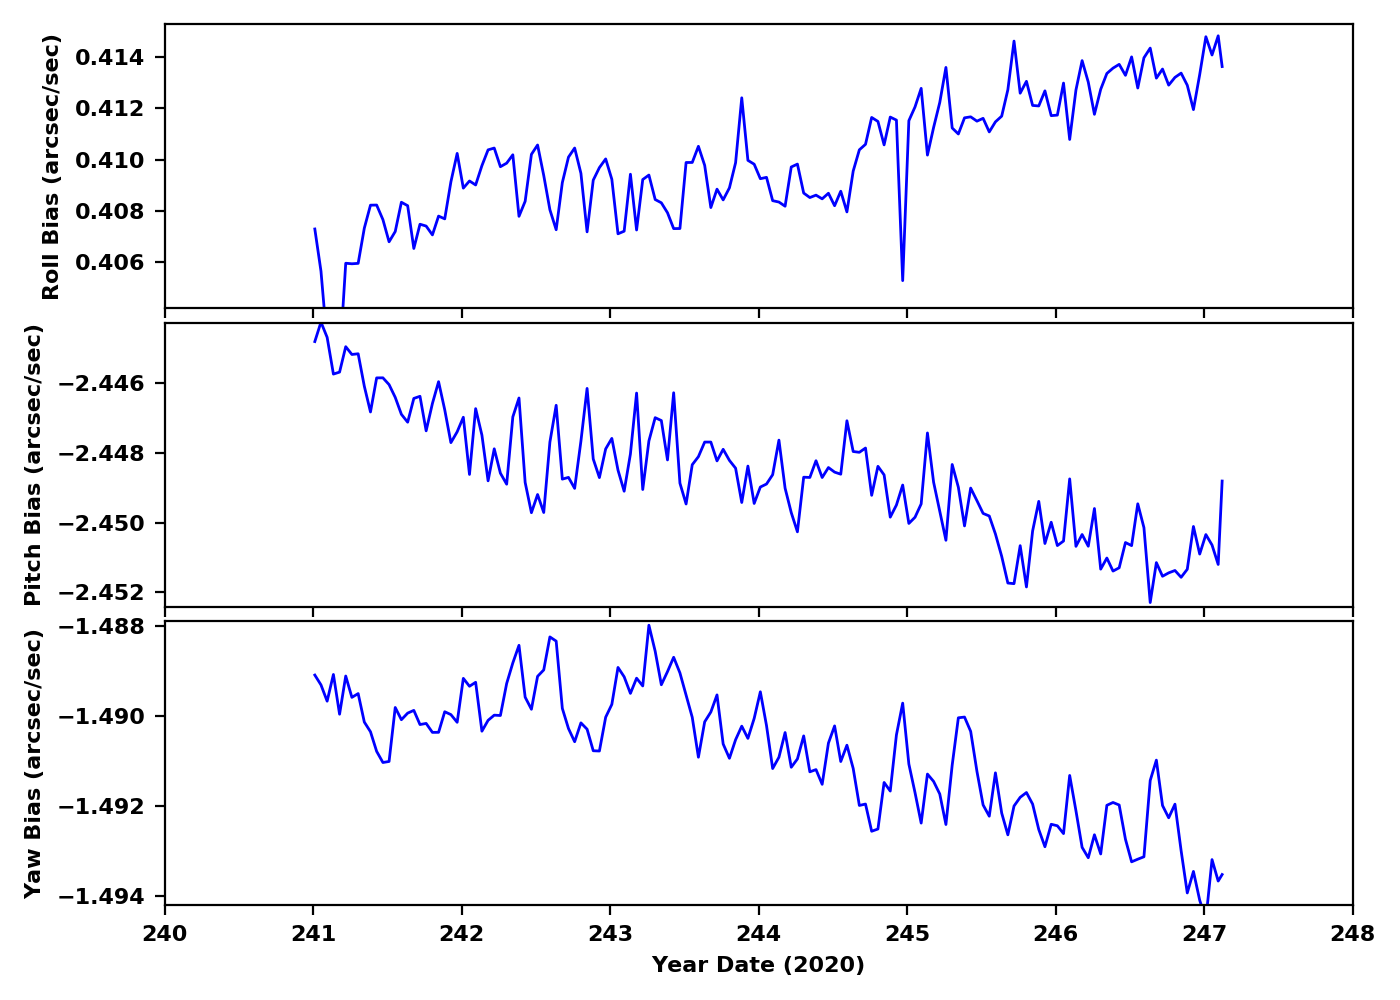
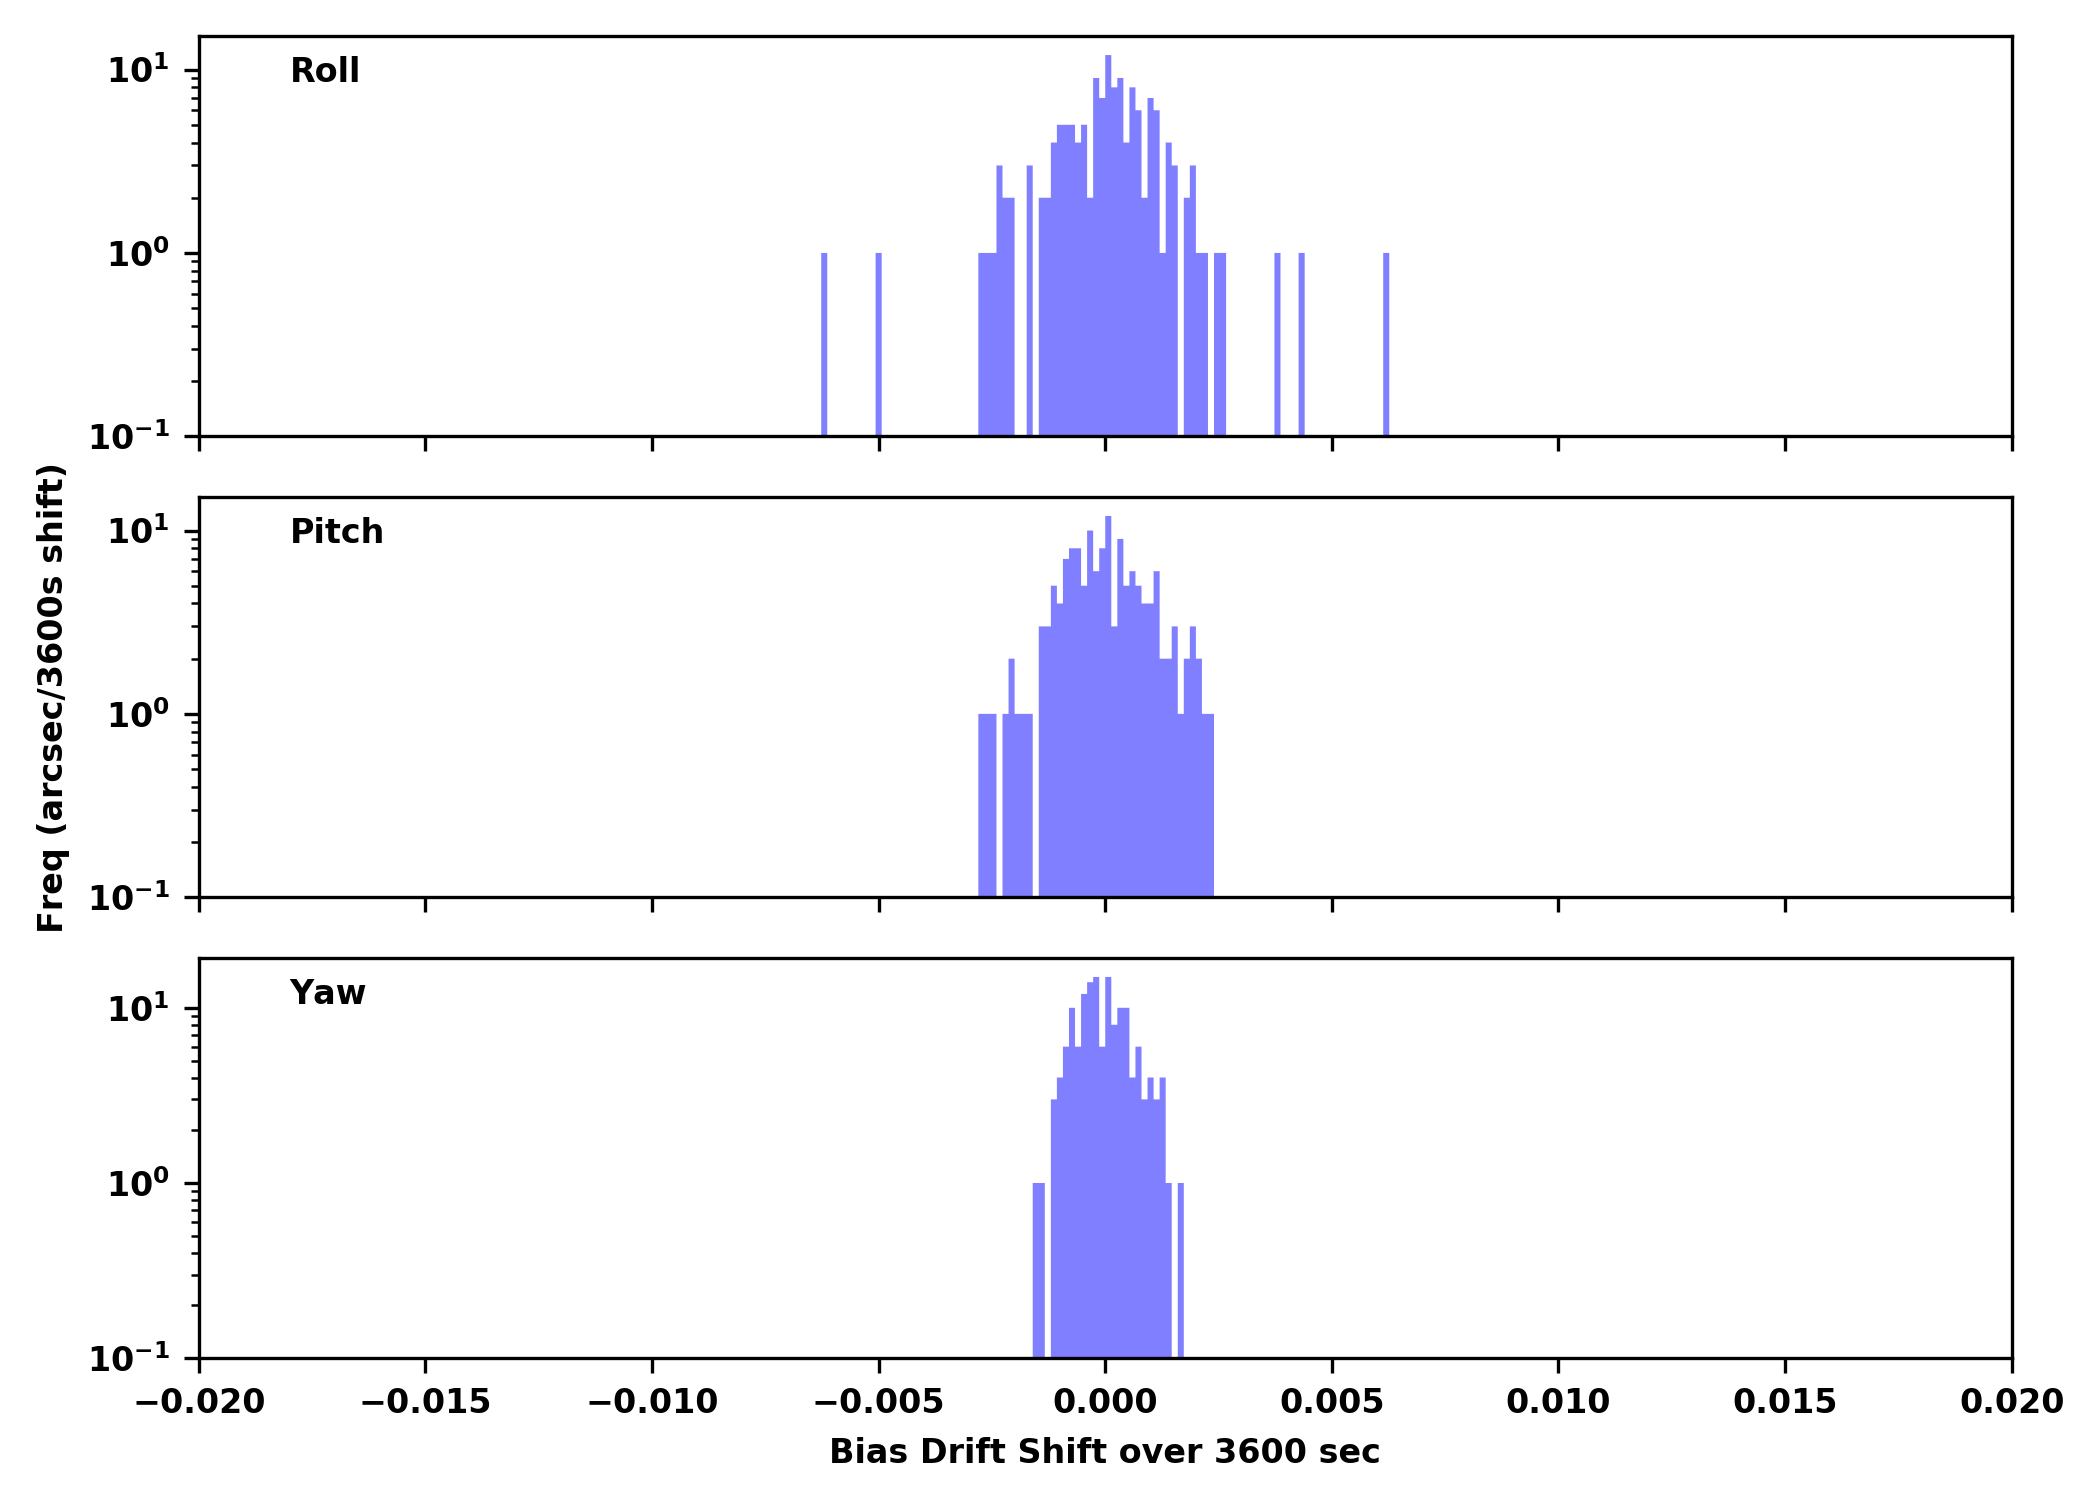
IRUs
| Gyro Bias Drift | Gyro Bias Drift Histogram |
|---|---|
|
|
Recent Observations
There was No Observations in the Last Eight Days
Trending
This week's focus is SIM
Last reported on
Jun 18.
Only the most interesting or representative msids are shown below.
For a full listing choose the bulletted link.
| MSID | Mean | RMS | Delta/Yr | Delta/Yr/Yr | Unit | Description | |
|---|---|---|---|---|---|---|---|
| 3btu_bpt | 0.462 | 0.012 | (2.65+/-0.07)e2 | -0.10 +/- 0.27 | K | BTU BASEPLATE (+X)), ABORT HTR TSC2 | |
| 3fabraat | -0.114 | 0.005 | (2.65+/-0.03)e2 | -(7.45+/-9491.00)e-5 | K | FA STRUCTURE AT BEARING A ABORT HTR. FA6 TEMP | |
| 3fabrcat | -0.185 | 0.011 | (2.74+/-0.06)e2 | -0.04 +/- 0.23 | K | FA STRUCTURE AT BEARING C ABORT HTR. FA6 TEMP | |
| 3famyzat | -1.204 | 0.016 | (2.81+/-0.12)e2 | -0.06 +/- 0.28 | K | FA STRUCTURE +X FACE AT -Y-Z END ABORT HTR. FA6 TEMP | |
| 3fapyzat | -1.458 | 0.013 | (2.79+/-0.11)e2 | -0.05 +/- 0.11 | K | FA STRUCTURE +X FACE AT +Y+Z END ABORT HTR. FA6 TEMP | |
| 3faralat | -0.624 | 0.017 | (2.75+/-0.10)e2 | -0.06 +/- 0.37 | K | FA STRUCTURE AT RAIL -Z, ABORT HEATER FA6 TEMP | |
| 3flcabpt | 0.459 | 0.005 | (2.81+/-0.04)e2 | -0.16 +/- 0.10 | K | FLCA BASEPLATE (+X) | |
| 3rctubpt | 0.617 | 0.014 | (2.72+/-0.09)e2 | -0.15 +/- 0.34 | K | RCTU BASEPLATE (+X) | |
| 3tsmxcet | 2.200 | 0.033 | (2.24+/-0.22)e2 | -0.37 +/- 0.64 | K | -X TURTLE SHELL NR HRC CEA | |
| 3tsmxspt | 7.359 | 0.107 | (2.85+/-0.73)e2 | 0.73 +/- 0.93 | K | -X TURTLE SHELL NR ACIS SS | |
| 3tsmydpt | 1.033 | 0.013 | (2.32+/-0.10)e2 | -0.24 +/- 0.26 | K | -Y TURTLE SHELL NR ACIS DPA | |
| 3tspyfet | 0.483 | 0.008 | (2.34+/-0.05)e2 | -0.34 +/- 0.18 | K | +Y TURTLE SHELL NR HRC FEA | |
| 3tspzdet | 0.710 | 0.011 | (2.66+/-0.07)e2 | -0.17 +/- 0.23 | K | +Z TURTLE SHELL NR ACIS DEA | |
| 3tspzspt | 0.801 | 0.010 | (2.70+/-0.07)e2 | -0.21 +/- 0.20 | K | +Z TURTLE SHELL NR ACIS SS | |
| 3ttacs1t | 0.138 | 0.004 | (2.65+/-0.02)e2 | -0.00 +/- 0.08 | K | TT at ACIS Attach #1 Abort Htr | |
| 3ttacs2t | 0.120 | 0.005 | (2.65+/-0.03)e2 | -0.01 +/- 0.10 | K | TT at ACIS Attach #2 Abort Htr | |
| 3ttacs3t | 0.121 | 0.002 | (2.62+/-0.01)e2 | -0.02 +/- 0.03 | K | TT at ACIS Attach #3 Abort Htr | |
| 3ttbrgbt | 0.193 | 0.016 | (2.59+/-0.09)e2 | -0.06 +/- 0.36 | K | TT at Bearing B, Abort Htr TSC4 | |
| 3tthrc1t | 0.228 | 0.016 | (2.68+/-0.09)e2 | -0.15 +/- 0.38 | K | TT at HRC Bipod Attach #1 | |
| 3tthrc2t | 0.230 | 0.016 | (2.72+/-0.09)e2 | -0.17 +/- 0.37 | K | TT at HRC Bipod Attach #2 | |
| 3tthrc3t | 0.134 | 0.004 | (2.67+/-0.03)e2 | 0.01 +/- 0.09 | K | TT at HRC Bipod Attach #3 | |
| 3ttralat | 0.258 | 0.010 | (2.46+/-0.06)e2 | -0.04 +/- 0.18 | K | TT at Rail A, Abort Htr TSC3 | |
| 3ttralct | 0.112 | 0.007 | (2.66+/-0.04)e2 | 0.06 +/- 0.16 | K | TT at Rail C, Abort Htr TSC3 | |
| 3ttvalvt | 0.386 | 0.013 | (2.53+/-0.07)e2 | -0.28 +/- 0.27 | K | TT at Vent Valve, Abort Htr TSC7 |
If you have any questions, please contact: swolk@head.cfa.harvard.edu