| CCD0 | CCD1 | CCD2 | CCD3 | CCD4 | CCD5 | CCD6 | CCD7 | CCD8 | CCD9 | |
|---|---|---|---|---|---|---|---|---|---|---|
| Previously Unknown Bad Pixels | ||||||||||
| Current Warm Pixels | (143,700) (154,9) | (802,665) (910,239) | (526,66) | (670,387) | ||||||
| Flickering Warm Pixels | (692,141) | (427,125) | (726,537) (178,149) (803,225) (665,25) | (21,95) | (607,281) (357,303) (369,376) | (1000,214) (287,164) | (335,412) | (197,241) | (150,374) | |
| Current Hot Pixels | ||||||||||
| Flickering Hot Pixels | ||||||||||
| Warm column candidates | 512 510 1022 | 512 1022 | ||||||||
| Flickering Warm column candidates |
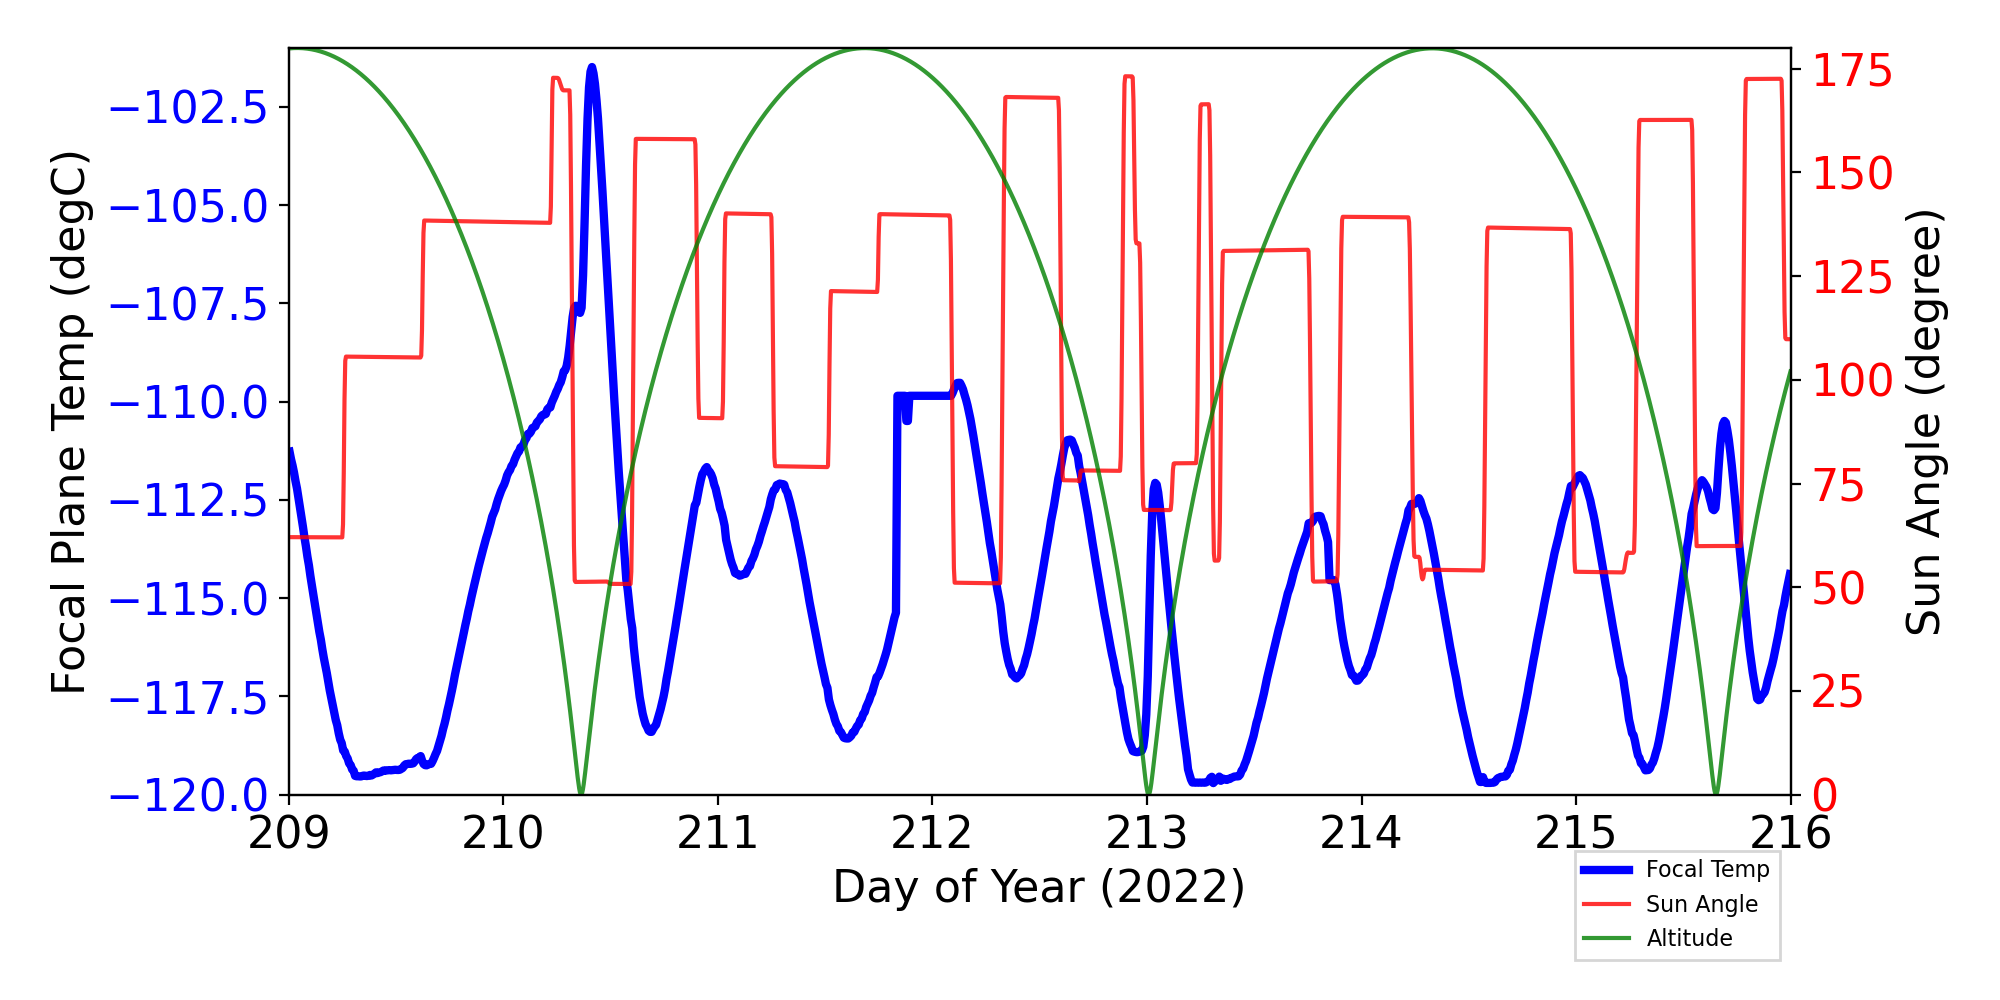
ACIS Focal Plane Temperature
For this period, 9 peaks are observed.
| Day (DOY) | Temp (C) | Width (Days) | |
|---|---|---|---|
| 208.28 | -111.15 | 0.56 | |
| 208.97 | -110.97 | 0.73 | |
| 210.42 | -101.64 | 1.04 | |
| 210.95 | -111.74 | 0.92 | |
| 212.14 | -109.59 | 0.79 | |
| 212.65 | -110.98 | 0.56 | |
| 213.05 | -112.11 | 0.26 | |
| 213.81 | -112.92 | 0.59 | |
| 214.27 | -112.53 | 0.58 |
Weekly focal plane temperature with sun angle, earth angle, and altitude overplotted. Sun angle is the solar array angle, that is the angle between the sun and the optical axis (+X axis). The earth angle is the angle between earth and the ACIS radiator (+Z axis). Altitude varies from 34 kkm to 128 kkm.
SIM Movements
17 TSC moves this period
| weekly average time/step | 0.00139 s |
|---|---|
| mission average time/step | 0.00132 s |
Telemetry
New violations or new extrema are shown in blue cells.
| MSID | 07/29/22 | 07/30/22 | 07/31/22 | 08/01/22 | 08/02/22 | 08/03/22 | 08/04/22 | yellow limits (lower) upper | red limits (lower) upper | Units | Description |
| SPHBLV | (0.00) | (79.0) 128.0 |
(78.0) 129.0 |
(2SPHBLV) | Spect Bot & Top MCP HV Monitor | ||||||
| MZOBACONE | 308.18 | 310.86 | (260.2) 303.0 |
(250.2) 308.0 |
CONE | -Z SIDE OBA CONE | |||||
| AWD1TQI | (-3.39) | (-3.31) | (-1.98) | (-1.22) 1.22 |
(-3.3) 3.3 |
AMP | WHEEL 1 TORQUE CURRENT | ||||
| SPHVLV | (0.00) | (72.0) 128.0 |
(71.0) 129.0 |
(2SPHVLV) | Spect Bot MCP HV Monitor | ||||||
| TCM_PA1 | (259.69) | (259.69) | (259.69) | (260.05) | (269.15) 348.15 |
(260.15) 413.15 |
K | RF POWER AMP-1 EXT BPL TEMP | |||
| img_roll_rms | 20.02 | (0.0) 5.0 |
(0.0) 20.0 |
Aspect image RMS roll err | |||||||
| OBACONEAVG | 304.93 | 304.74 | 304.59 | 308.08 | (282.5) 300.0 |
(281.8) 301.0 |
K | OBA CONE AVG TEMP | |||
| TSCTSF3 | (268.06) | (268.43) | (268.79) | (267.70) | (278.15) 359.15 |
(269.15) 483.15 |
K | SC-TS FITTING -3 TEMP | |||
| AWD6TQI | (-3.47) | (-3.39) | (-3.43) | (-1.22) 1.22 |
(-3.3) 3.3 |
AMP | WHEEL 6 TORQUE CURRENT | ||||
| HRMAAVG | 309.10 | 309.06 | 309.10 | 309.04 | 309.07 | 309.07 | 309.11 | (306.0) 308.0 |
(305.0) 309.0 |
K | AVG OF HRMA METRICS |
| OBAAVG | 301.60 | 302.26 | 301.43 | 301.71 | 301.06 | 301.13 | 304.00 | (282.5) 300.0 |
(281.4) 301.0 |
K | OBA/TFTE TEMP |
| OBADIAGRAD | 4.09 | 4.39 | 4.45 | 4.38 | 3.96 | 4.33 | (-1.11) 3.5 |
(-2.78) 3.9 |
K | OBA DIAM GRAD | |
| TCM_TX1 | (267.70) | (267.33) | (268.06) | (267.70) | (268.79) | (267.33) | (283.15) 348.15 |
(269.15) 404.15 |
K | TRANSPONDER-1 EXT BPL TEMP | |
| S2HVLV | (0.00) | (126.0) 128.0 |
(125.0) 129.0 |
(2S2HVLV) | Shield PMT 2 HV Monitor |
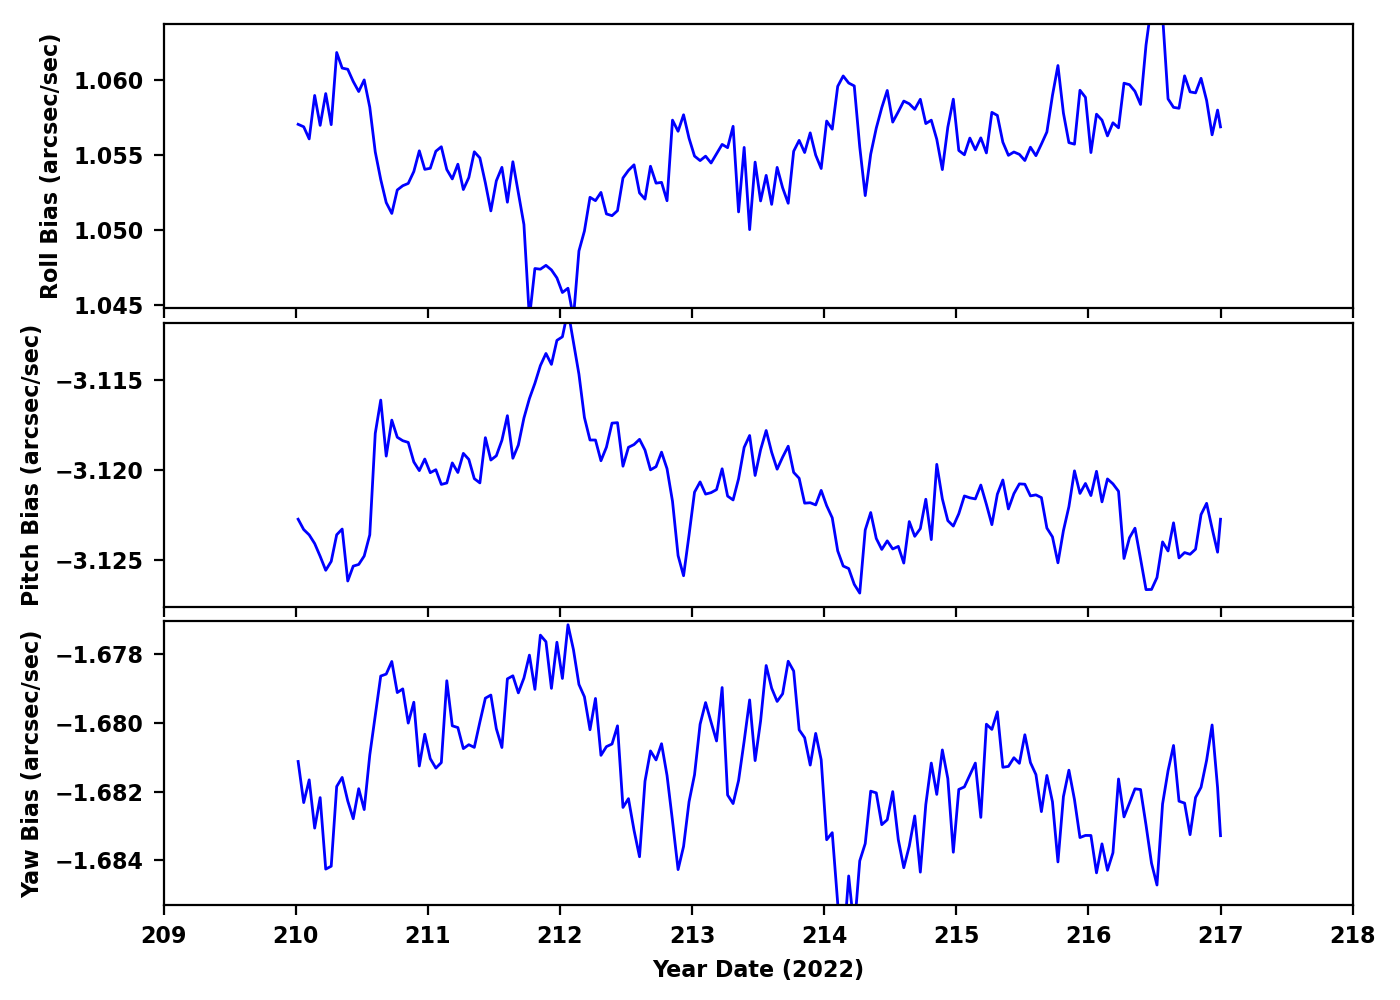
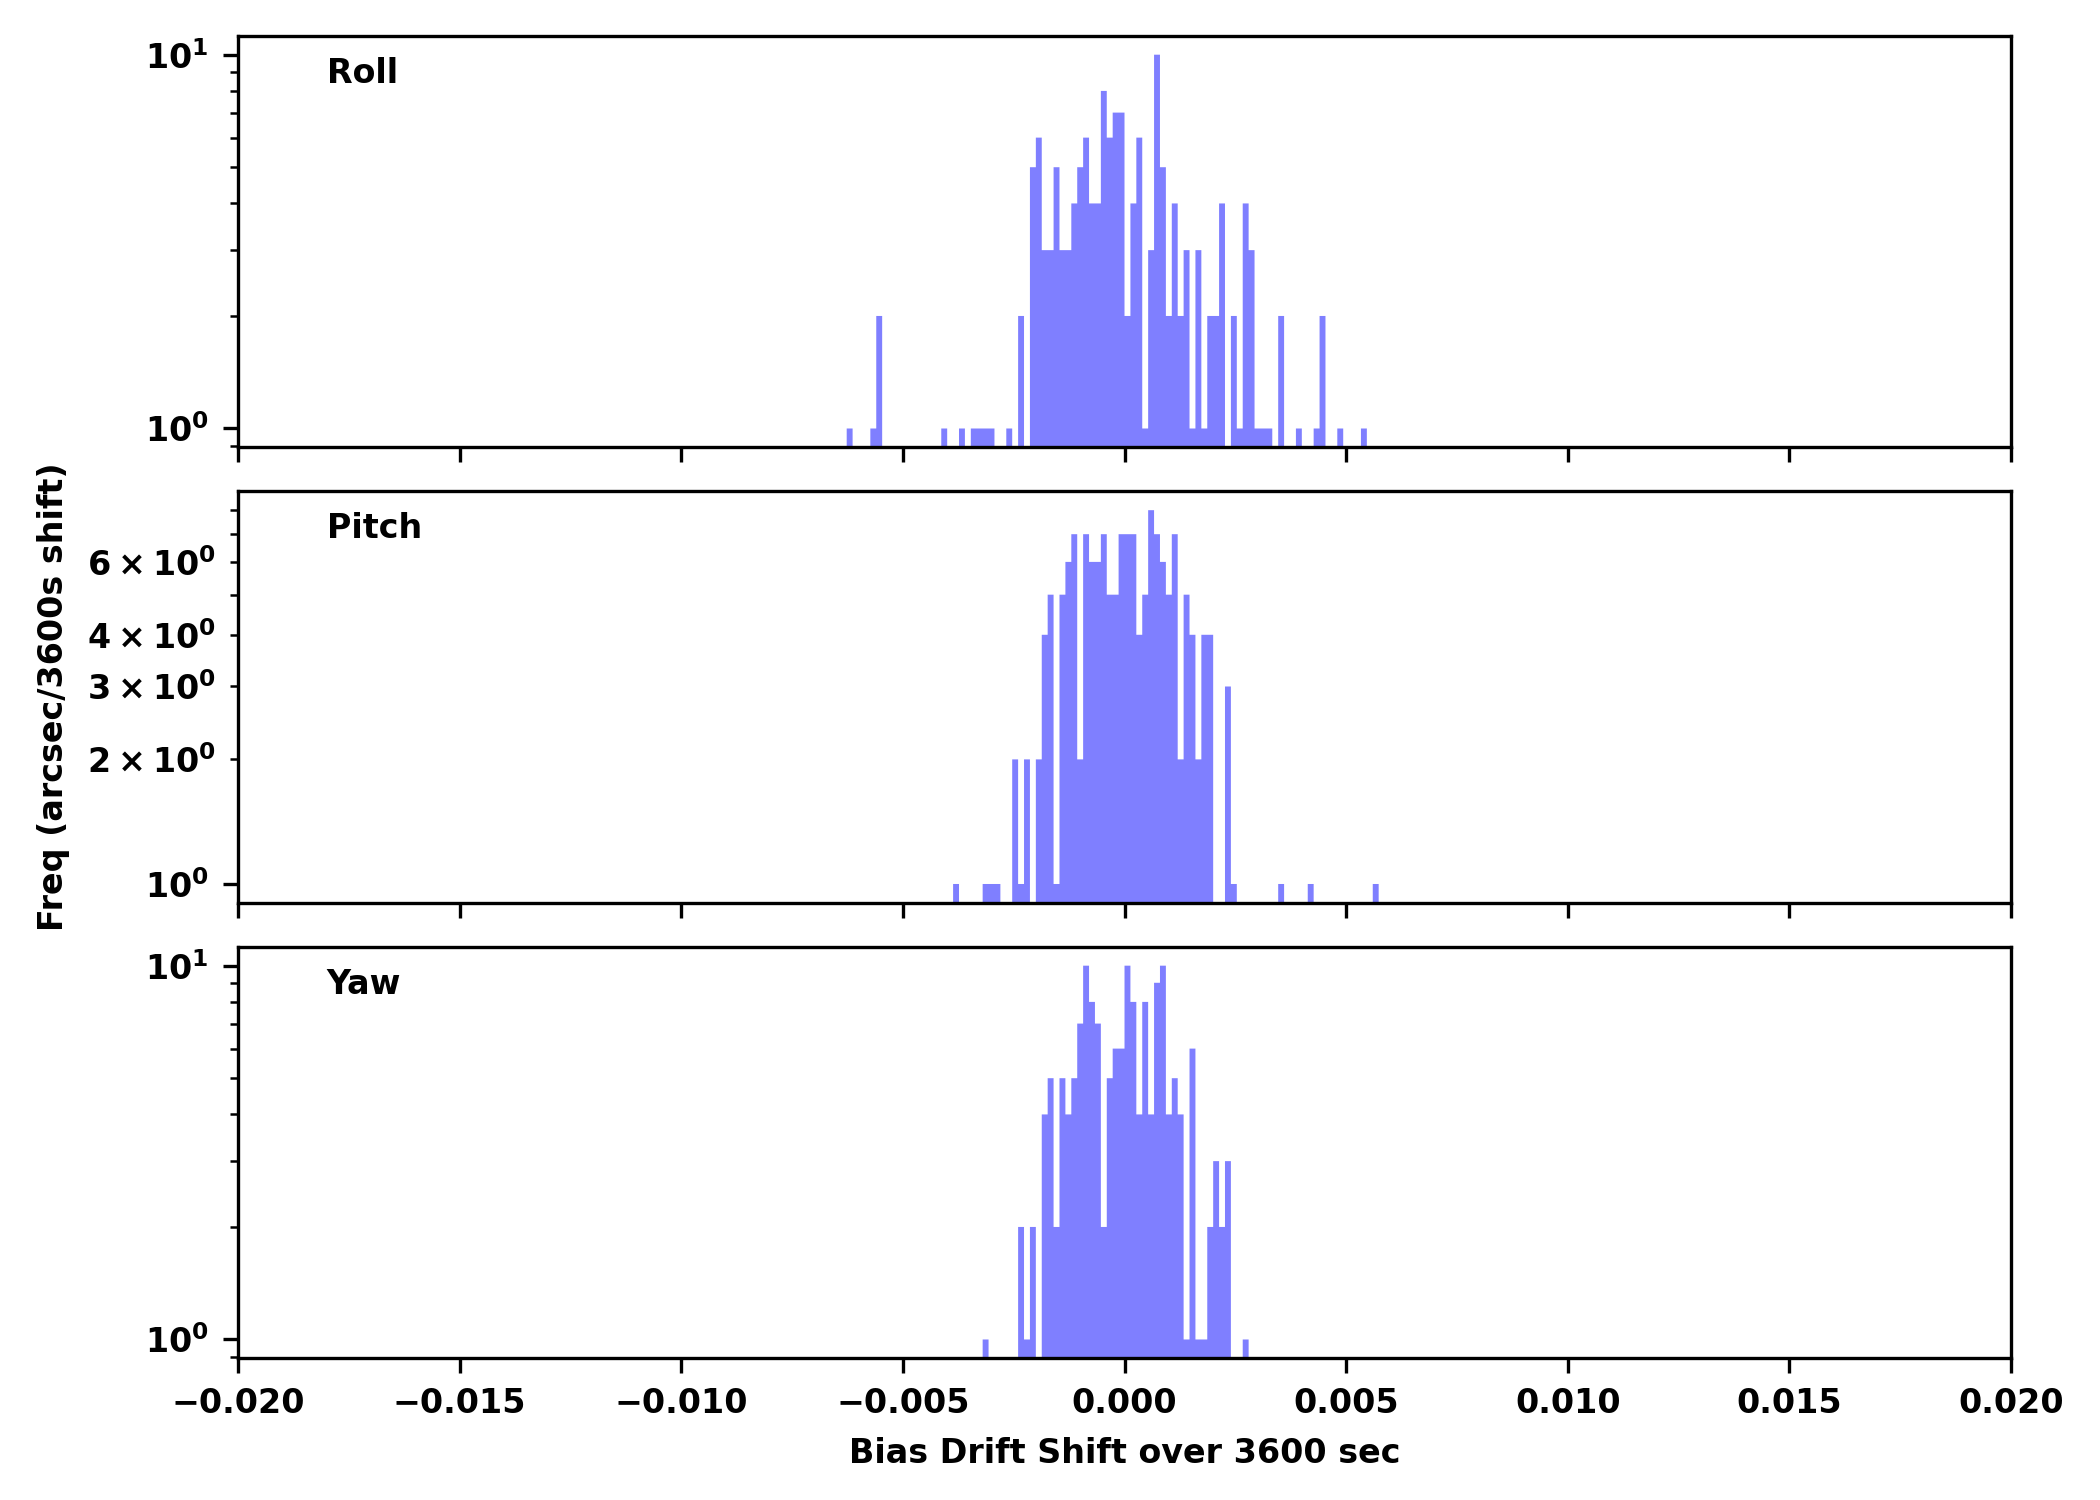
IRUs
| Gyro Bias Drift | Gyro Bias Drift Histogram |
|---|---|
|
|
Recent Observations
| OBSID | DETECTOR | GRATING | TARGET | ANALYSIS | ACA |
|---|---|---|---|---|---|
| 23395 | ACIS-67 | NONE | NLTT 44989 | OK | OK |
| 25235 | ACIS-0123 | NONE | [WHB2007] GC0607 | OK | OK |
| 26479 | ACIS-5678 | NONE | SPT-CLJ2031-4037 | OK | OK |
| 24822 | ACIS-0123 | NONE | CMZ Molecular Cloud | OK | OK |
| 25167 | ACIS-0123 | NONE | ZTF J1406+1222 | OK | OK |
| 26481 | ACIS-56789 | HETG | rho Oph A | OK /Grat | OK |
| 24769 | ACIS-5678 | HETG | GX 3+1 | OK /Grat | OK |
| 25275 | ACIS-23567 | NONE | SDSS J122011.26+302008.1 | OK | OK |
| 25486 | ACIS-01236 | NONE | PSZ2G357.43+69.50 | OK | OK |
| 26476 | ACIS-67 | NONE | 2RXS J195401.8-143722 | OK | OK |
| 25463 | ACIS-23678 | NONE | NVSS J145412+492639 | OK | OK |
| 26464 | ACIS-3 | NONE | DQ Tau | OK | OK |
| 25967 | ACIS-0123 | NONE | Abell 2744 | OK | OK |
| 26463 | HRC-S | LETG | Capella | OK/NA | OK |
| 26465 | ACIS-3 | NONE | DQ Tau | OK | OK |
| 23654 | ACIS-367 | NONE | 3CR 394 | OK | OK |
| 25220 | ACIS-678 | NONE | ngc 4631 | OK | OK |
| 24372 | ACIS-0123 | NONE | CMZ Molecular Cloud | OK | OK |
| 26466 | ACIS-3 | NONE | DQ Tau | OK | OK |
| 26484 | ACIS-678 | NONE | ngc 4631 | OK | OK |
| 25377 | ACIS-5678 | NONE | AM2113-341 | OK | OK |
| 24451 | ACIS-235678 | NONE | [DAG2016] PSZ1-ARC G311.6602-18.4624 | OK | OK |
| 26467 | ACIS-3 | NONE | DQ Tau | OK | OK |
| 24488 | ACIS-0123 | NONE | Abell 2142 | OK | OK |
Trending
This week's focus is PCAD
Last reported on
May 19.
Only the most interesting or representative msids are shown below.
For a full listing choose the bulletted link.
| MSID | Mean | RMS | Delta/Yr | Delta/Yr/Yr | Unit | Description | |
|---|---|---|---|---|---|---|---|
| afsspc2v | on | 0.006 | 8.094e-04 | 3.51 +/- 0.17 | (4.21+/-9.43)e-5 | V | FSS POWER CONV 2 VOLTAGE | off | 5.659e-04 | 5.345e-04 | 0.01 +/- 0.14 | (0.00+/-0.00)e0 |
| airu2g1i | on | -0.419 | 0.012 | (1.02+/-0.07)e2 | -0.07 +/- 0.04 | mA | IRU-2 GYRO | off | -0.401 | 0.101 | 9.74 +/- 4.56 | -0.17 +/- 0.37 |
| airu2g2i | on | -0.090 | 0.051 | (1.03+/-0.26)e2 | 0.26 +/- 0.06 | mA | IRU-2 GYRO | off | -0.401 | 0.103 | 9.74 +/- 4.65 | -0.12 +/- 0.33 |
| airu2g2t | on | -0.208 | 0.012 | (3.41+/-0.06)e2 | -(5.53+/-156.80)e-5 | K | IRU-2 GYRO | off | -0.191 | 0.060 | (2.93+/-0.03)e2 | -0.03 +/- 0.02 |
| MSID | Mean | RMS | Delta/Yr | Delta/Yr/Yr | Unit | Description | |
|---|---|---|---|---|---|---|---|
| aogyrct1 | -0.572 | 1.308 | 14.46 +/- 839.83 | -26.30 +/- 13.47 | CNTS | ACCUMULATED GYRO PULSE COUNTS FROM OBC SELECTED GYRO 1 | |
| aogyrct2 | -1.862 | 1.645 | 15.12 +/- 1056.64 | 14.26 +/- 16.83 | CNTS | ACCUMULATED GYRO PULSE COUNTS FROM OBC SELECTED GYRO 2 | |
| aogyrct3 | 2.974 | 4.153 | -27.16 +/- 2666.61 | 3.01 +/- 48.72 | CNTS | ACCUMULATED GYRO PULSE COUNTS FROM OBC SELECTED GYRO 3 | |
| aogyrct4 | 0.577 | 1.466 | -31.95 +/- 941.15 | -0.97 +/- 7.66 | CNTS | ACCUMULATED GYRO PULSE COUNTS FROM OBC SELECTED GYRO 4 |
If you have any questions, please contact: swolk@head.cfa.harvard.edu