| CCD0 | CCD1 | CCD2 | CCD3 | CCD4 | CCD5 | CCD6 | CCD7 | CCD8 | CCD9 | |
|---|---|---|---|---|---|---|---|---|---|---|
| Previously Unknown Bad Pixels | (304,43) | |||||||||
| Current Warm Pixels | (154,9) | (526,66) | (811,637) (21,95) (318,53) | (670,387) | (335,412) | (182,474) (197,241) (136,65) (447,769) (275,393) (130,26) (139,109) | ||||
| Flickering Warm Pixels | (692,141) (143,700) | (36,614) (271,24) (370,70) (910,239) | (178,149) (803,225) (665,25) (104,31) (726,537) | (617,159) (931,553) (680,391) (144,50) | (641,669) (161,206) (669,577) (233,227) (263,317) (258,797) (282,385) (369,376) (233,102) (270,726) (357,303) (728,340) (877,408) (367,511) (554,484) | (884,31) (287,164) (1004,5) (414,5) (1000,214) (357,29) | (874,186) | (675,304) (721,286) (178,399) (881,53) (220,813) (333,466) (34,645) | ||
| Current Hot Pixels | ||||||||||
| Flickering Hot Pixels | ||||||||||
| Warm column candidates | 510 512 1022 | 512 1022 | ||||||||
| Flickering Warm column candidates |
ACIS Focal Plane Temperature
For this period, 12 peaks are observed.
| Day (DOY) | Temp (C) | Width (Days) | |
|---|---|---|---|
| 320.43 | -110.33 | 0.45 | |
| 320.84 | -111.33 | 0.52 | |
| 321.51 | -96.58 | 0.82 | |
| 322.68 | -111.30 | 0.62 | |
| 323.05 | -111.97 | 0.40 | |
| 323.45 | -112.31 | 0.38 | |
| 323.79 | -114.04 | 0.29 | |
| 324.15 | -95.43 | 0.92 | |
| 325.20 | -110.79 | 0.53 | |
| 325.64 | -111.90 | 0.42 | |
| 326.07 | -110.64 | 0.44 | |
| 326.80 | -96.40 | 0.80 |
Weekly focal plane temperature with sun angle, earth angle, and altitude overplotted. Sun angle is the solar array angle, that is the angle between the sun and the optical axis (+X axis). The earth angle is the angle between earth and the ACIS radiator (+Z axis). Altitude varies from 34 kkm to 128 kkm.

SIM Movements
13 TSC moves this period
| weekly average time/step | 0.00162 s |
|---|---|
| mission average time/step | 0.00131 s |
Telemetry
New violations or new extrema are shown in blue cells.
| MSID | 11/18/22 | 11/19/22 | 11/20/22 | 11/21/22 | 11/22/22 | 11/23/22 | 11/24/22 | yellow limits (lower) upper | red limits (lower) upper | Units | Description |
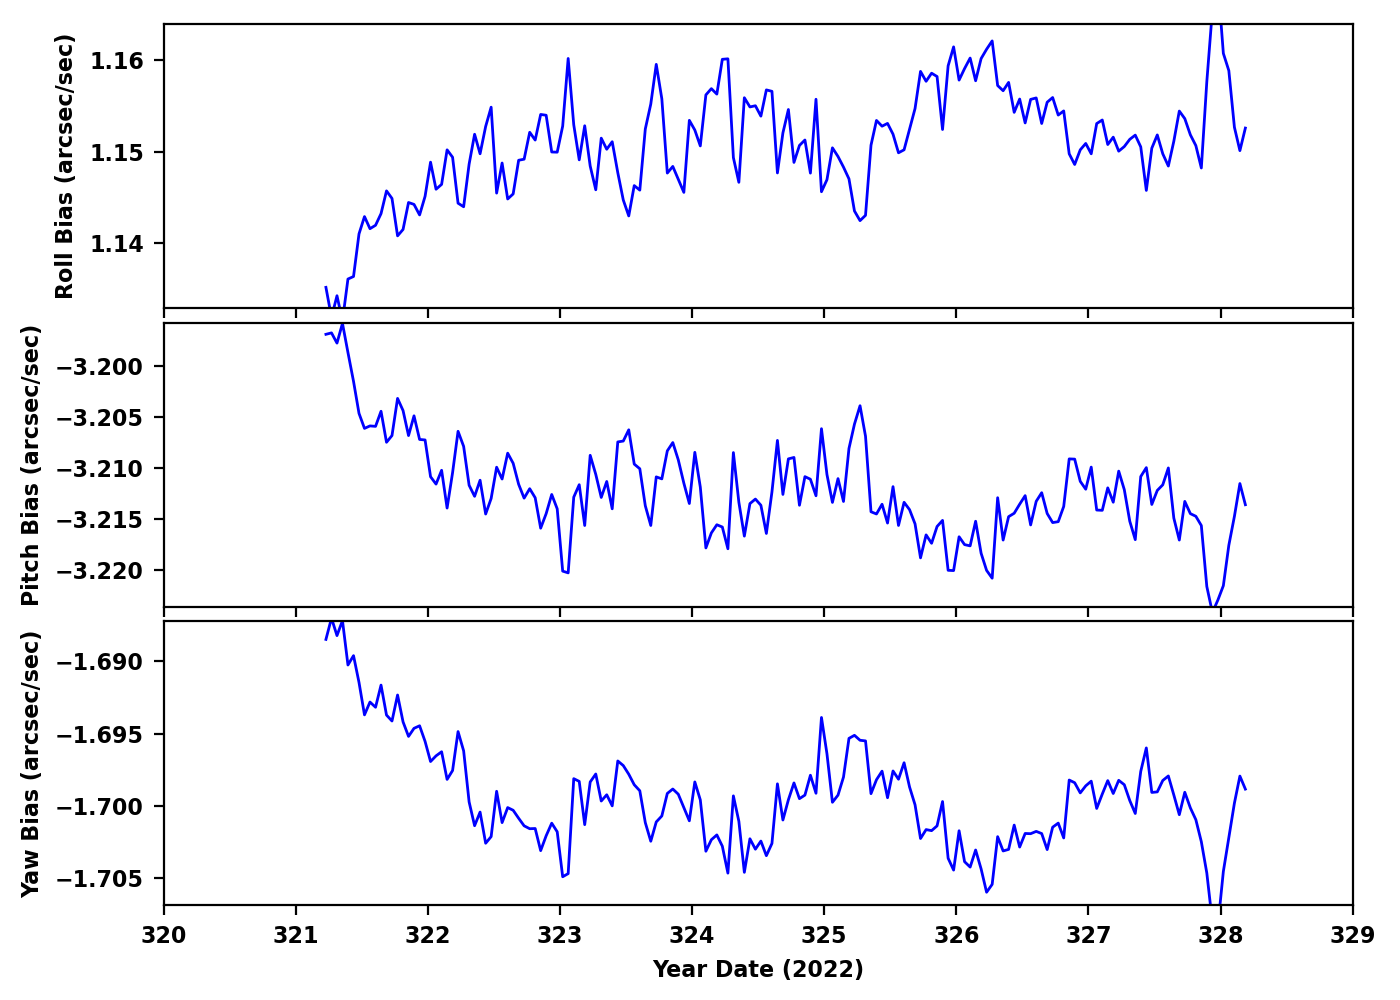
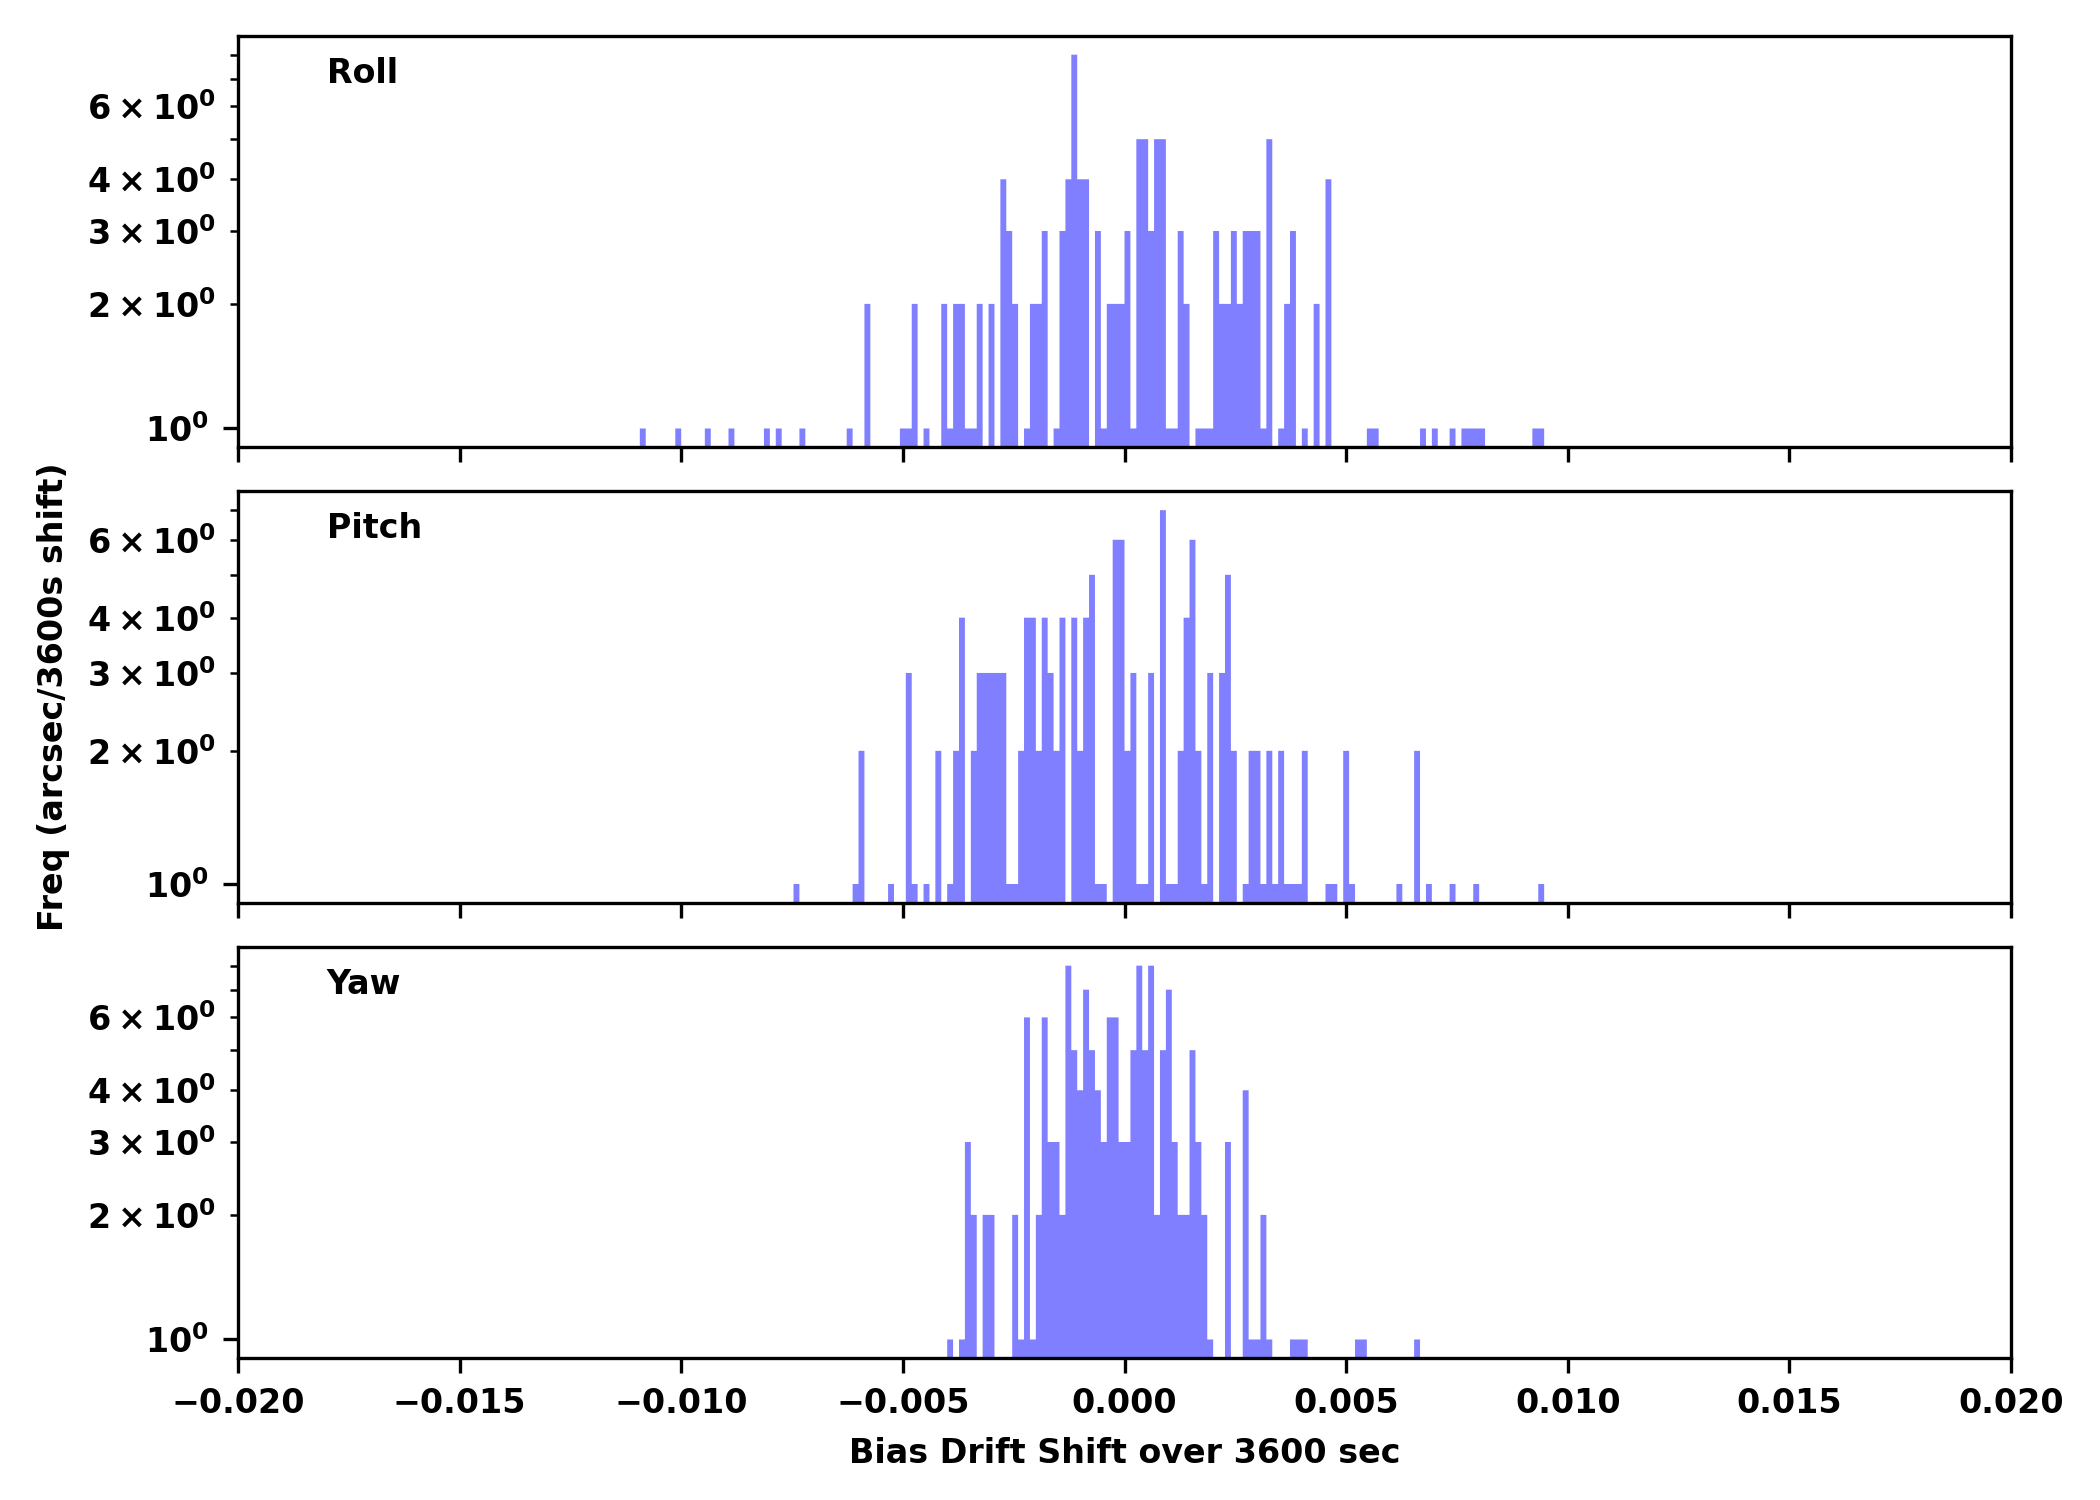
IRUs
| Gyro Bias Drift | Gyro Bias Drift Histogram |
|---|---|
|
|
Recent Observations
| OBSID | DETECTOR | GRATING | TARGET | ANALYSIS | ACA |
|---|
Trending
This week's focus is Gratings
Last reported on
Sep 08.
Only the most interesting or representative msids are shown below.
For a full listing choose the bulletted link.
| MSID | Mean | RMS | Delta/Yr | Delta/Yr/Yr | Unit | Description | |
|---|---|---|---|---|---|---|---|
| 4hposaro | -0.110 | 0.031 | 68.07 +/- 20.12 | 0.99 +/- 0.88 | na | NA | |
| 4hposbro | -0.106 | 0.031 | 68.65 +/- 20.34 | 0.99 +/- 0.89 | na | NA | |
| 4lposaro | 0.033 | 0.019 | 73.91 +/- 12.62 | 0.29 +/- 0.51 | na | NA | |
| 4lposbro | 0.038 | 0.020 | 72.97 +/- 12.98 | 0.31 +/- 0.52 | na | NA | |
| 4mp28av | 0.011 | 0.001 | 0.40 +/- 0.73 | -0.01 +/- 0.02 | V | MCE A: +28 VOLT MONITOR | |
| 4mp28bv | 0.070 | 0.005 | 1.95 +/- 3.14 | -0.04 +/- 0.12 | V | MCE B: +28 VOLT MONITOR | |
| 4mp5av | 0.017 | 0.001 | 0.47 +/- 0.76 | -0.01 +/- 0.03 | V | MCE A: +5 VOLT MONITOR | |
| 4mp5bv | 0.013 | 8.621e-04 | 0.35 +/- 0.57 | -0.00 +/- 0.02 | V | MCE B: +5 VOLT MONITOR |
If you have any questions, please contact: swolk@head.cfa.harvard.edu