| CCD0 | CCD1 | CCD2 | CCD3 | CCD4 | CCD5 | CCD6 | CCD7 | CCD8 | CCD9 | |
|---|---|---|---|---|---|---|---|---|---|---|
| Previously Unknown Bad Pixels | (308,284) | |||||||||
| Current Warm Pixels | (104,31) (178,149) (803,225) | (21,95) | (884,31) (414,5) (287,164) (1000,214) | (335,412) | ||||||
| Flickering Warm Pixels | (692,141) (143,700) (154,9) | (802,665) (36,614) (910,239) (427,125) | (526,66) (665,25) (726,537) | (811,637) (680,391) | (233,227) (258,797) (669,577) (641,669) (161,206) (357,303) (728,340) (270,726) (369,376) (233,102) (263,317) (282,385) (367,511) | (670,387) | (197,241) (139,109) (721,286) (893,490) (136,65) (275,393) (182,474) (447,769) (881,53) (675,304) | |||
| Current Hot Pixels | ||||||||||
| Flickering Hot Pixels | ||||||||||
| Warm column candidates | 512 510 1022 | 512 1022 | ||||||||
| Flickering Warm column candidates |
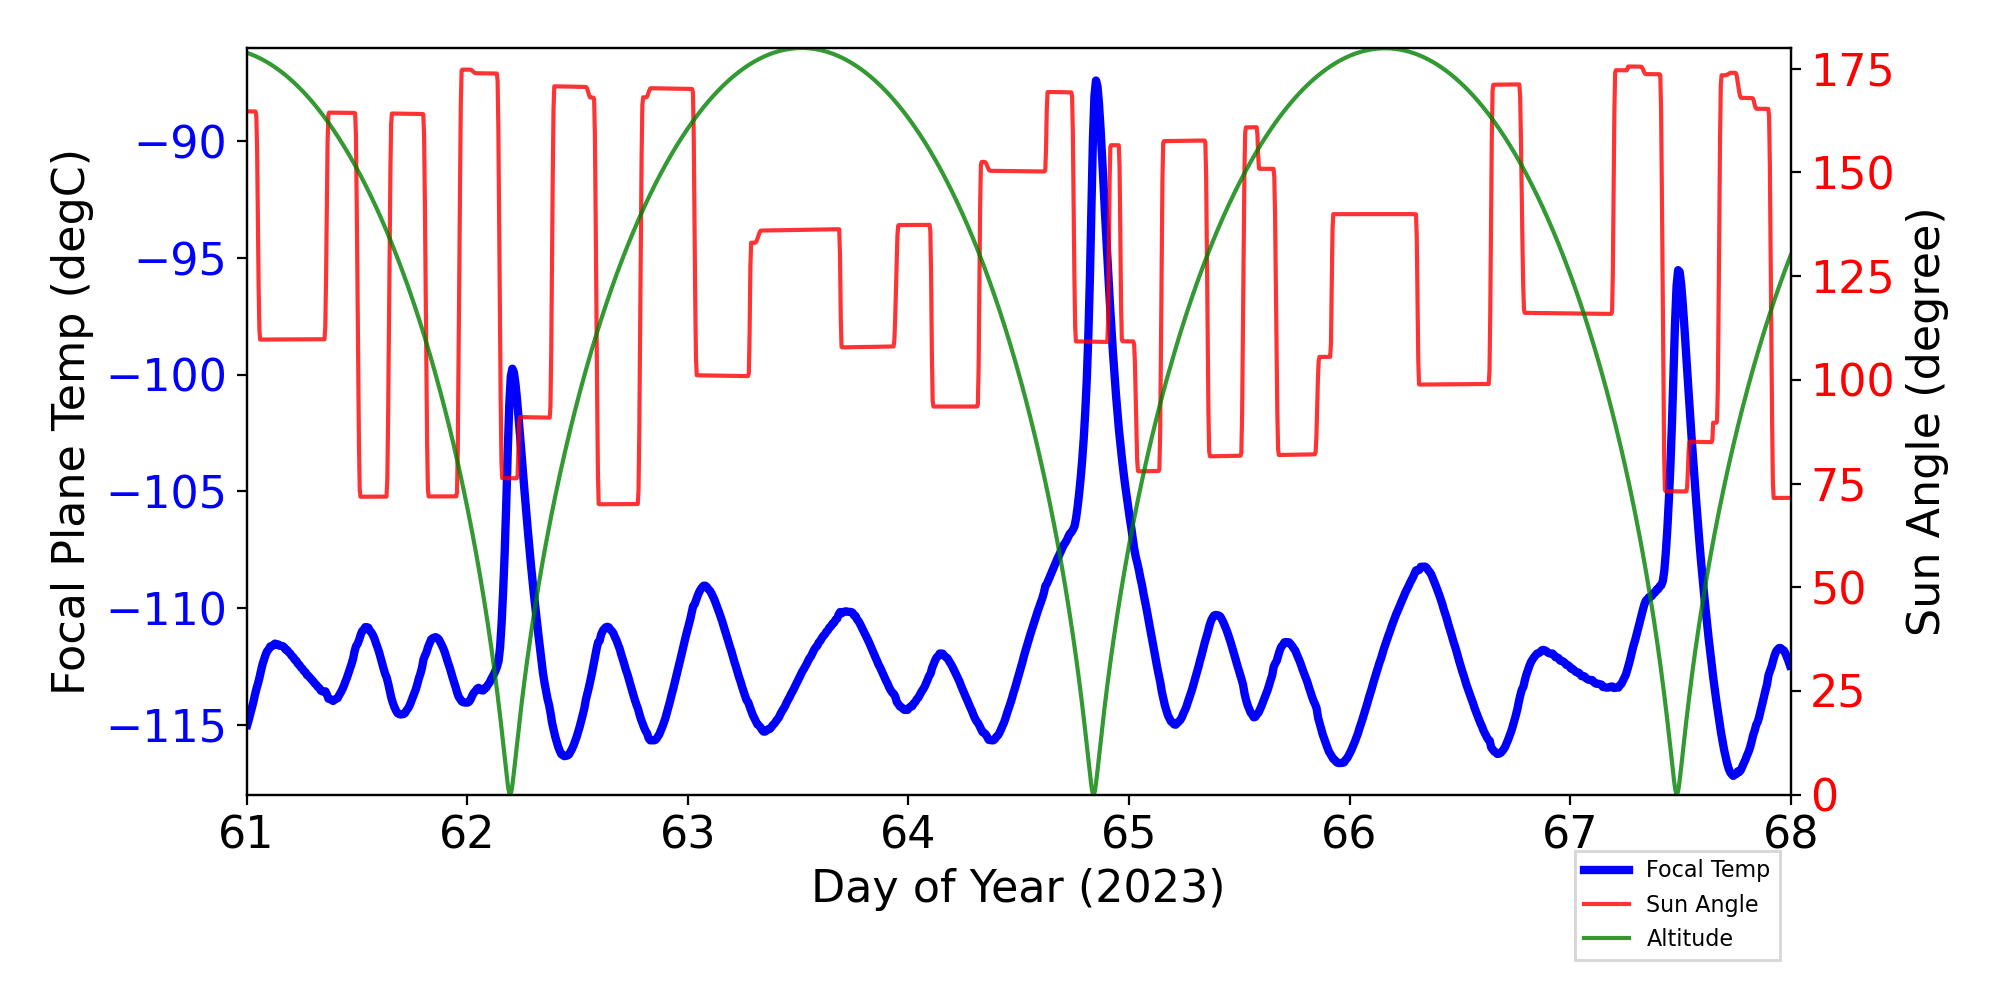
ACIS Focal Plane Temperature
For this period, 8 peaks are observed.
| Day (DOY) | Temp (C) | Width (Days) | |
|---|---|---|---|
| 060.35 | -114.58 | 0.43 | |
| 060.64 | -112.91 | 0.50 | |
| 062.21 | -99.90 | 1.51 | |
| 062.64 | -110.83 | 0.39 | |
| 063.08 | -109.05 | 0.51 | |
| 063.73 | -110.16 | 1.03 | |
| 064.86 | -87.65 | 1.58 | |
| 066.35 | -108.29 | 0.72 |
Weekly focal plane temperature with sun angle, earth angle, and altitude overplotted. Sun angle is the solar array angle, that is the angle between the sun and the optical axis (+X axis). The earth angle is the angle between earth and the ACIS radiator (+Z axis). Altitude varies from 34 kkm to 128 kkm.
SIM Movements
7 TSC moves this period
| weekly average time/step | 0.00219 s |
|---|---|
| mission average time/step | 0.00132 s |
Telemetry
New violations or new extrema are shown in blue cells.
| MSID | 03/03/23 | 03/04/23 | 03/05/23 | 03/06/23 | 03/07/23 | 03/08/23 | 03/09/23 | yellow limits (lower) upper | red limits (lower) upper | Units | Description |
| TFTERANGE | 46.06 | 48.04 | 47.92 | 48.22 | 48.80 | 46.80 | (16.7) 37.5 |
(11.1) 45.0 |
K | TFTE VENT/RAD TEMP | |
| TSCTSF3 | (267.33) | (267.33) | (278.15) 359.15 |
(269.15) 483.15 |
K | SC-TS FITTING -3 TEMP | |||||
| HRMAAVG | 309.22 | 309.00 | 309.15 | 309.32 | 309.05 | (306.0) 308.0 |
(305.0) 309.0 |
K | AVG OF HRMA METRICS | ||
| AWD1TQI | (-3.39) | (-1.22) 1.22 |
(-3.3) 3.3 |
AMP | WHEEL 1 TORQUE CURRENT | ||||||
| AWD6TQI | (-3.47) | (-3.43) | (-1.22) 1.22 |
(-3.3) 3.3 |
AMP | WHEEL 6 TORQUE CURRENT | |||||
| MZOBACONE | 308.14 | 310.42 | 309.41 | 311.56 | 309.72 | (260.2) 303.0 |
(250.2) 308.0 |
CONE | -Z SIDE OBA CONE | ||
| TCM_TX1 | (267.70) | (266.97) | (267.33) | (266.97) | (267.70) | (266.97) | (267.33) | (283.15) 348.15 |
(269.15) 404.15 |
K | TRANSPONDER-1 EXT BPL TEMP |
| OBADIAGRAD | 4.57 | 4.56 | 4.40 | 4.64 | 4.37 | 4.55 | 4.56 | (-1.11) 3.5 |
(-2.78) 3.9 |
K | OBA DIAM GRAD |
| CTXBPWR | (0.00) | (0.00) | (0.00) | (0.00) | (36.12) 37.0 |
(36.0) 38.0 |
DBM | TRANSMITTER B OUTPUT POWER | |||
| TEP_PSU2 | (264.06) | (264.06) | (283.15) 343.15 |
(264.15) 393.15 |
K | PSU-2 TEMP | |||||
| OBAAVG | 302.39 | 301.49 | 303.32 | 302.49 | (282.5) 300.0 |
(281.4) 301.0 |
K | OBA/TFTE TEMP | |||
| TCM_PA2 | (259.69) | (260.05) | (259.69) | (260.05) | (269.15) 348.15 |
(260.15) 413.15 |
K | RF POWER AMP-2 EXT BPL TEMP | |||
| TCM_PA1 | (259.32) | (258.96) | (259.32) | (258.96) | (259.69) | (259.32) | (258.96) | (269.15) 348.15 |
(260.15) 413.15 |
K | RF POWER AMP-1 EXT BPL TEMP |
| OBACONEAVG | 304.21 | 305.74 | 307.81 | 304.68 | (282.5) 300.0 |
(281.8) 301.0 |
K | OBA CONE AVG TEMP | |||
| ESAMYI | (0.06) | (0.06) | (0.06) | (5.63) 27.0 |
(5.3) 33.0 |
AMP | S/A -Y CURRENT | ||||
| ESAPYI | (0.14) | (0.14) | (0.14) | (5.54) 27.0 |
(5.2) 33.0 |
AMP | S/A +Y CURRENT |
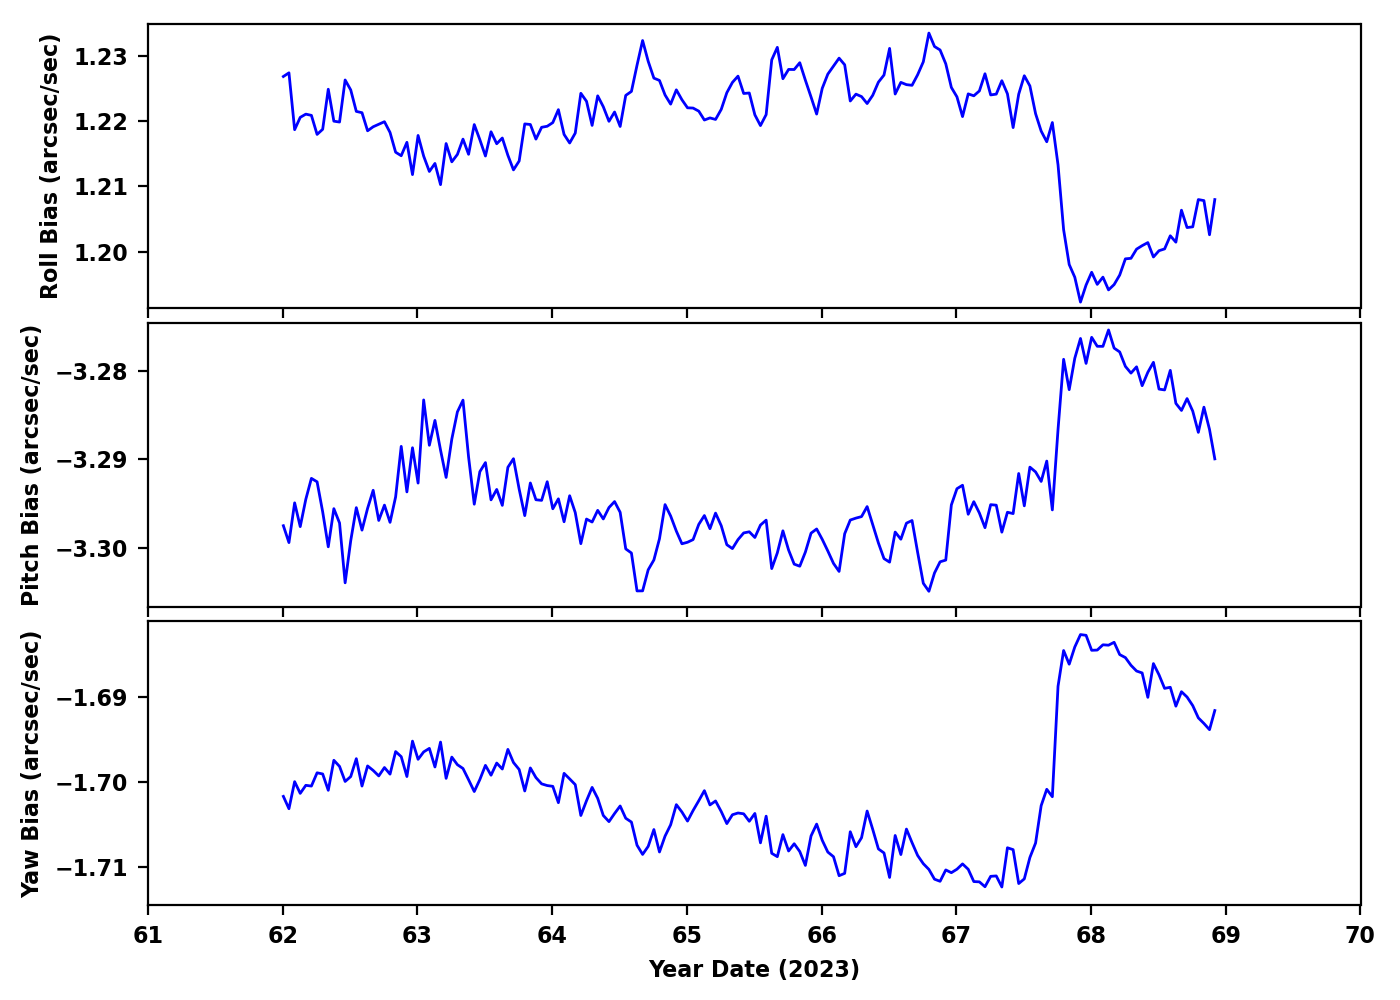
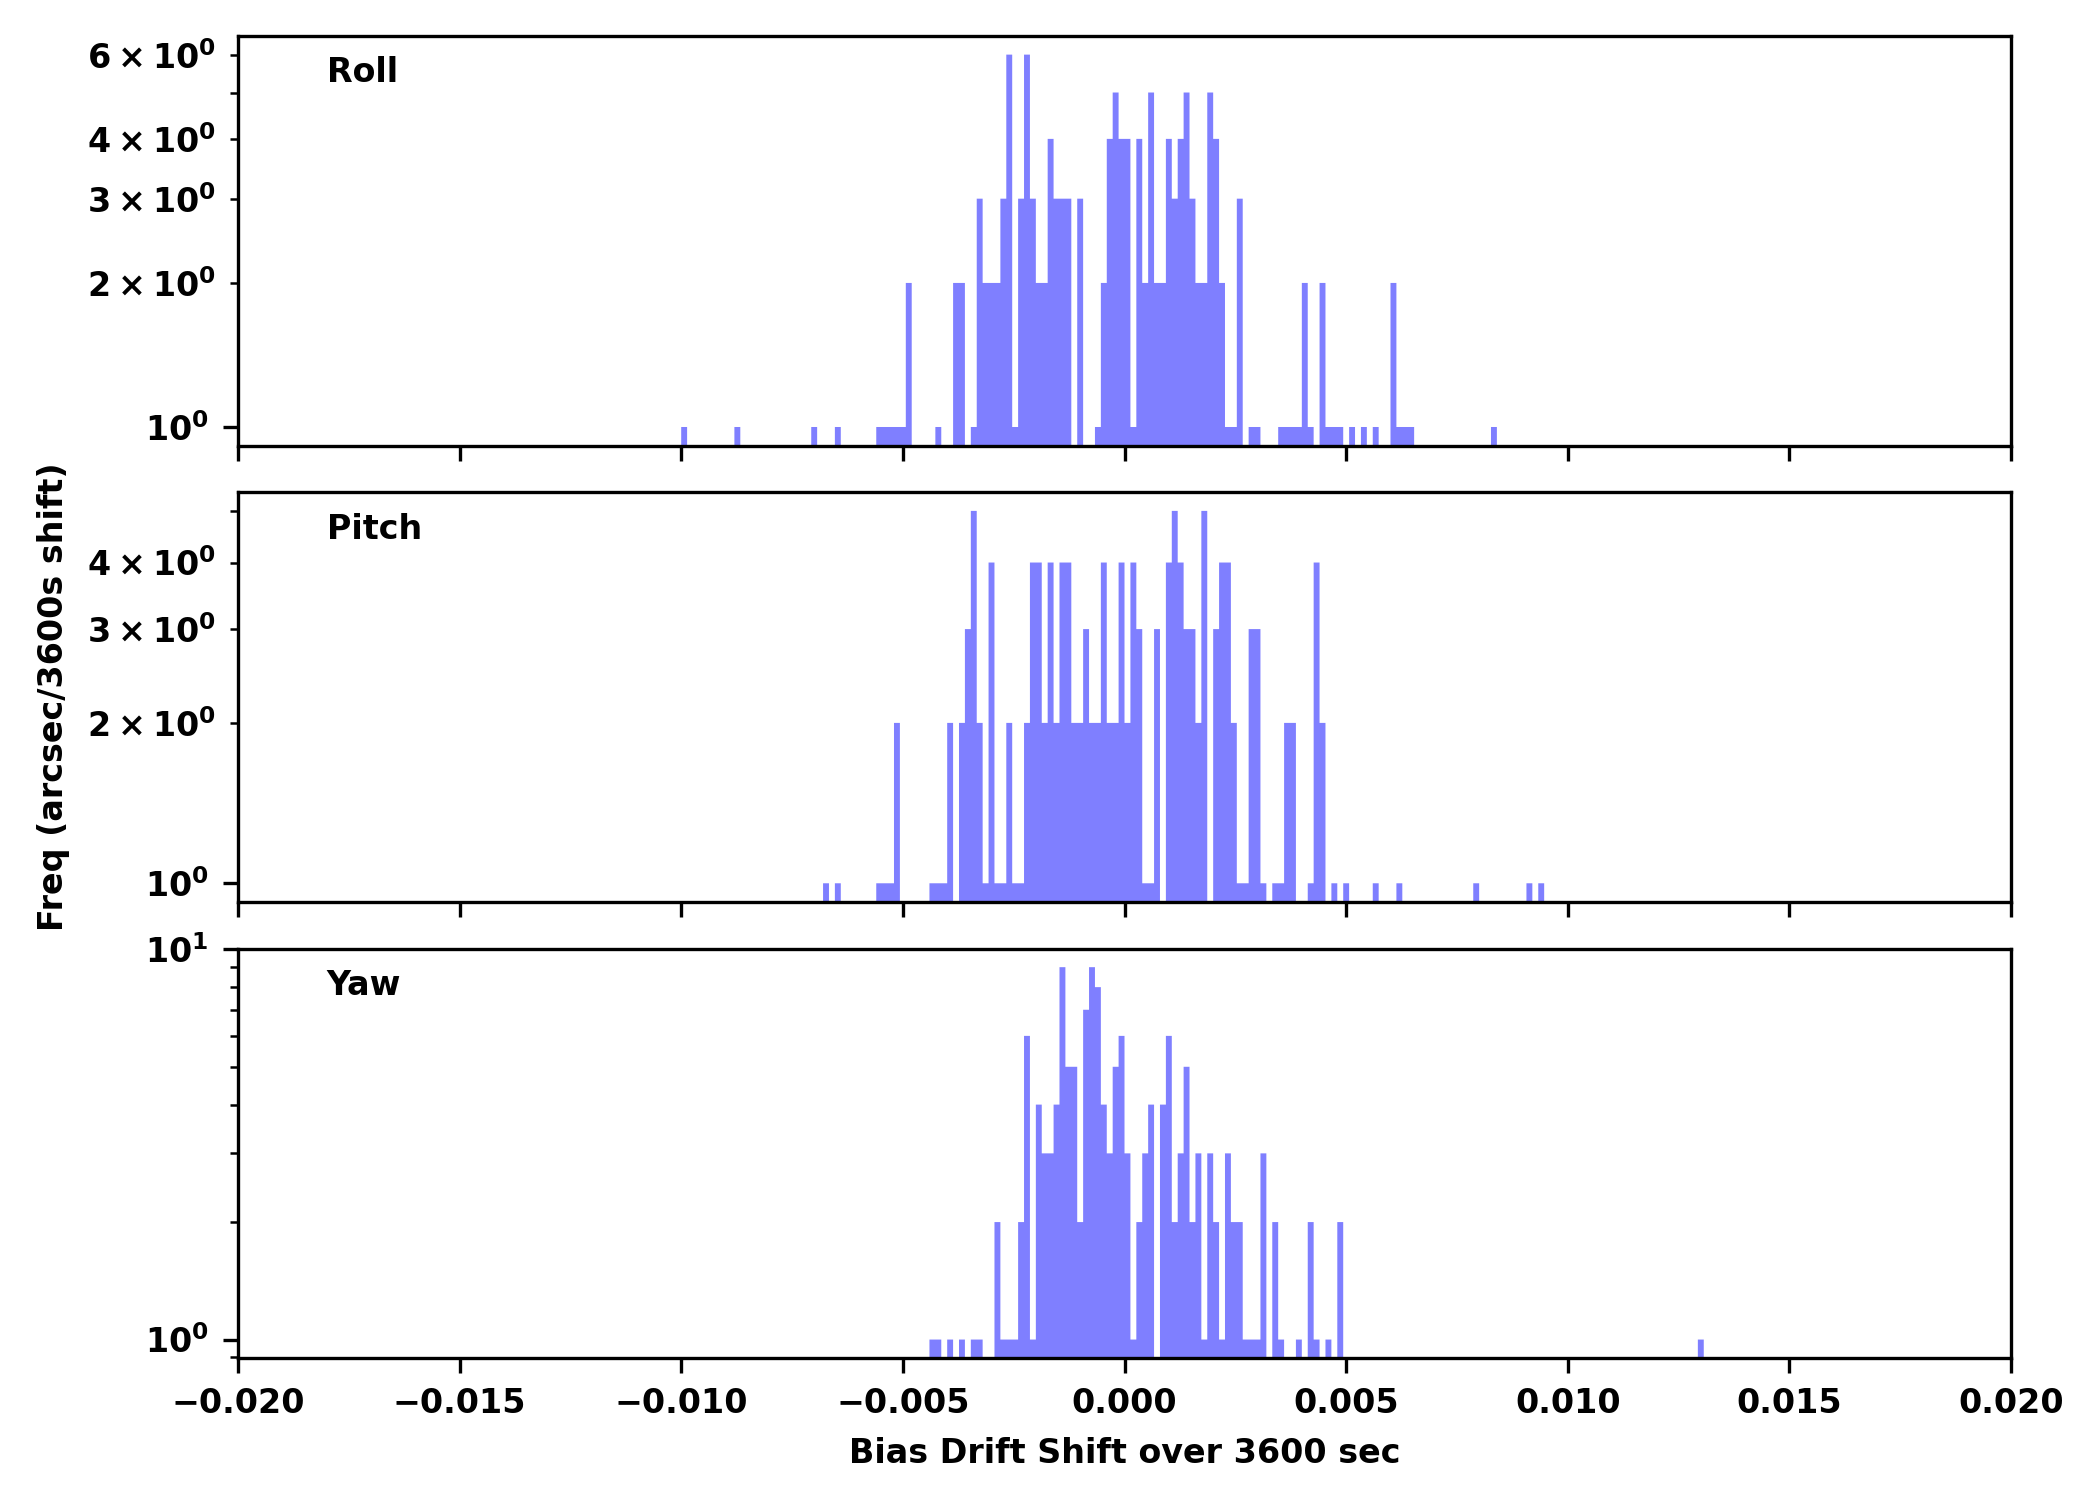
IRUs
| Gyro Bias Drift | Gyro Bias Drift Histogram |
|---|---|
|
|
Recent Observations
| OBSID | DETECTOR | GRATING | TARGET | ANALYSIS | ACA |
|---|---|---|---|---|---|
| 27729 | ACIS-67 | NONE | QSO J1016+2037 | OK | OK |
| 27730 | ACIS-678 | NONE | PSZ2 G075.85+15.53 | OK | OK |
| 26099 | ACIS-678 | NONE | PSZ2 G075.85+15.53 | OK | OK |
| 23846 | ACIS-012367 | NONE | A2319 | OK | OK |
| 26731 | ACIS-012367 | NONE | [APH2018] SDSS J1020+1040 nebula | OK | OK |
| 27139 | ACIS-0123 | NONE | [APH2018] SDSS J1020+1040 nebula | OK | OK |
| 27720 | ACIS-67 | NONE | 2RXS J053421.8+512738 | OK | OK |
| 27091 | ACIS-67 | NONE | GW170817 | OK | OK |
| 25696 | ACIS-67 | NONE | NGC 5005 | OK | OK |
| 27722 | ACIS-67 | NONE | 2RXS J145923.0-401319 | OK | OK |
| 27725 | ACIS-012367 | NONE | JWST-DTDF-1 | OK | OK |
| 27713 | ACIS-0123 | NONE | DELS J091054.53-041406.8 | OK | OK |
| 26371 | ACIS-5678 | NONE | [PLP2016] 188.073826+12.107060 | OK | OK |
| 26088 | ACIS-456789 | HETG | GX 1+4 | OK/NA | OK |
| 25438 | ACIS-235678 | NONE | NGC 4245 | OK | OK |
| 25343 | ACIS-67 | NONE | SDSSJ122016.87+112628.1 | OK | OK |
| 27735 | ACIS-456789 | HETG | GX 1+4 | OK/NA | OK |
| 25356 | ACIS-67 | NONE | SDSSJ155912.34+482819.9 | OK | OK |
| 25118 | ACIS-2367 | NONE | SDSS J123045.53+410943.8 | OK | OK |
| 26853 | ACIS-67 | NONE | AGC 210735 | OK | OK |
| 25530 | ACIS-67 | NONE | CFHQS J164121+375520 | OK | OK |
| 25334 | ACIS-67 | NONE | SDSSJ110352.74+100403.1 | OK | OK |
| 25367 | ACIS-67 | NONE | MCG+11-11-032 | OK | OK |
| 25331 | ACIS-67 | NONE | SDSSJ102632.97+032950.6 | OK | OK |
| 25336 | ACIS-67 | NONE | SDSSJ111017.13+193012.5 | OK | OK |
| 25316 | ACIS-235678 | NONE | B1152+199 | OK | OK |
| 27726 | ACIS-0123 | NONE | JWST-DTDF-1 | OK | OK |
| 24406 | ACIS-0123 | NONE | A2319 | OK | OK |
| 27734 | ACIS-012367 | NONE | A2319 | OK | OK |
| 26747 | ACIS-23567 | NONE | VCC 318 | OK | OK |
Trending
This week's focus is EPHIN
Last reported on
Dec 22.
Only the most interesting or representative msids are shown below.
For a full listing choose the bulletted link.
| MSID | Mean | RMS | Delta/Yr | Delta/Yr/Yr | Unit | Description | |
|---|---|---|---|---|---|---|---|
| 5eiot | 0.222 | 0.026 | (3.37+/-0.18)e2 | 0.01 +/- 0.39 | K | EIO TEMP | |
| 5ephint | 2.280 | 0.011 | (3.18+/-0.18)e2 | -0.14 +/- 0.17 | K | EPHIN TEMP | |
| teio | 1.528 | 0.022 | (3.16+/-0.18)e2 | -0.29 +/- 0.42 | K | EPHIN ELECTRONICS HOUSING TEMP | |
| tephin | 2.277 | 0.011 | (3.18+/-0.18)e2 | -0.12 +/- 0.18 | K | EPHIN SENSOR HOUSING TEMP |
If you have any questions, please contact: swolk@head.cfa.harvard.edu