| CCD0 | CCD1 | CCD2 | CCD3 | CCD4 | CCD5 | CCD6 | CCD7 | CCD8 | CCD9 | |
|---|---|---|---|---|---|---|---|---|---|---|
| Previously Unknown Bad Pixels | (989,219) | |||||||||
| Current Warm Pixels | (143,700) (154,9) | (36,614) (910,239) (802,665) | (803,225) (526,66) (178,149) (837,378) | (21,95) | (670,387) | (335,412) | ||||
| Flickering Warm Pixels | (787,181) (427,125) | (104,31) (726,537) (665,25) | (931,553) (680,391) (811,637) (318,53) | (233,227) (161,206) (357,303) (367,511) (669,577) (233,102) (728,340) (282,385) (263,317) (369,376) | (414,5) (1000,214) (287,164) | (874,186) | (881,53) (139,109) (597,187) (447,769) (541,41) (675,304) (182,474) (136,65) (838,239) (275,393) (721,286) | |||
| Current Hot Pixels | ||||||||||
| Flickering Hot Pixels | ||||||||||
| Warm column candidates | 510 512 1022 | 512 1022 | ||||||||
| Flickering Warm column candidates |
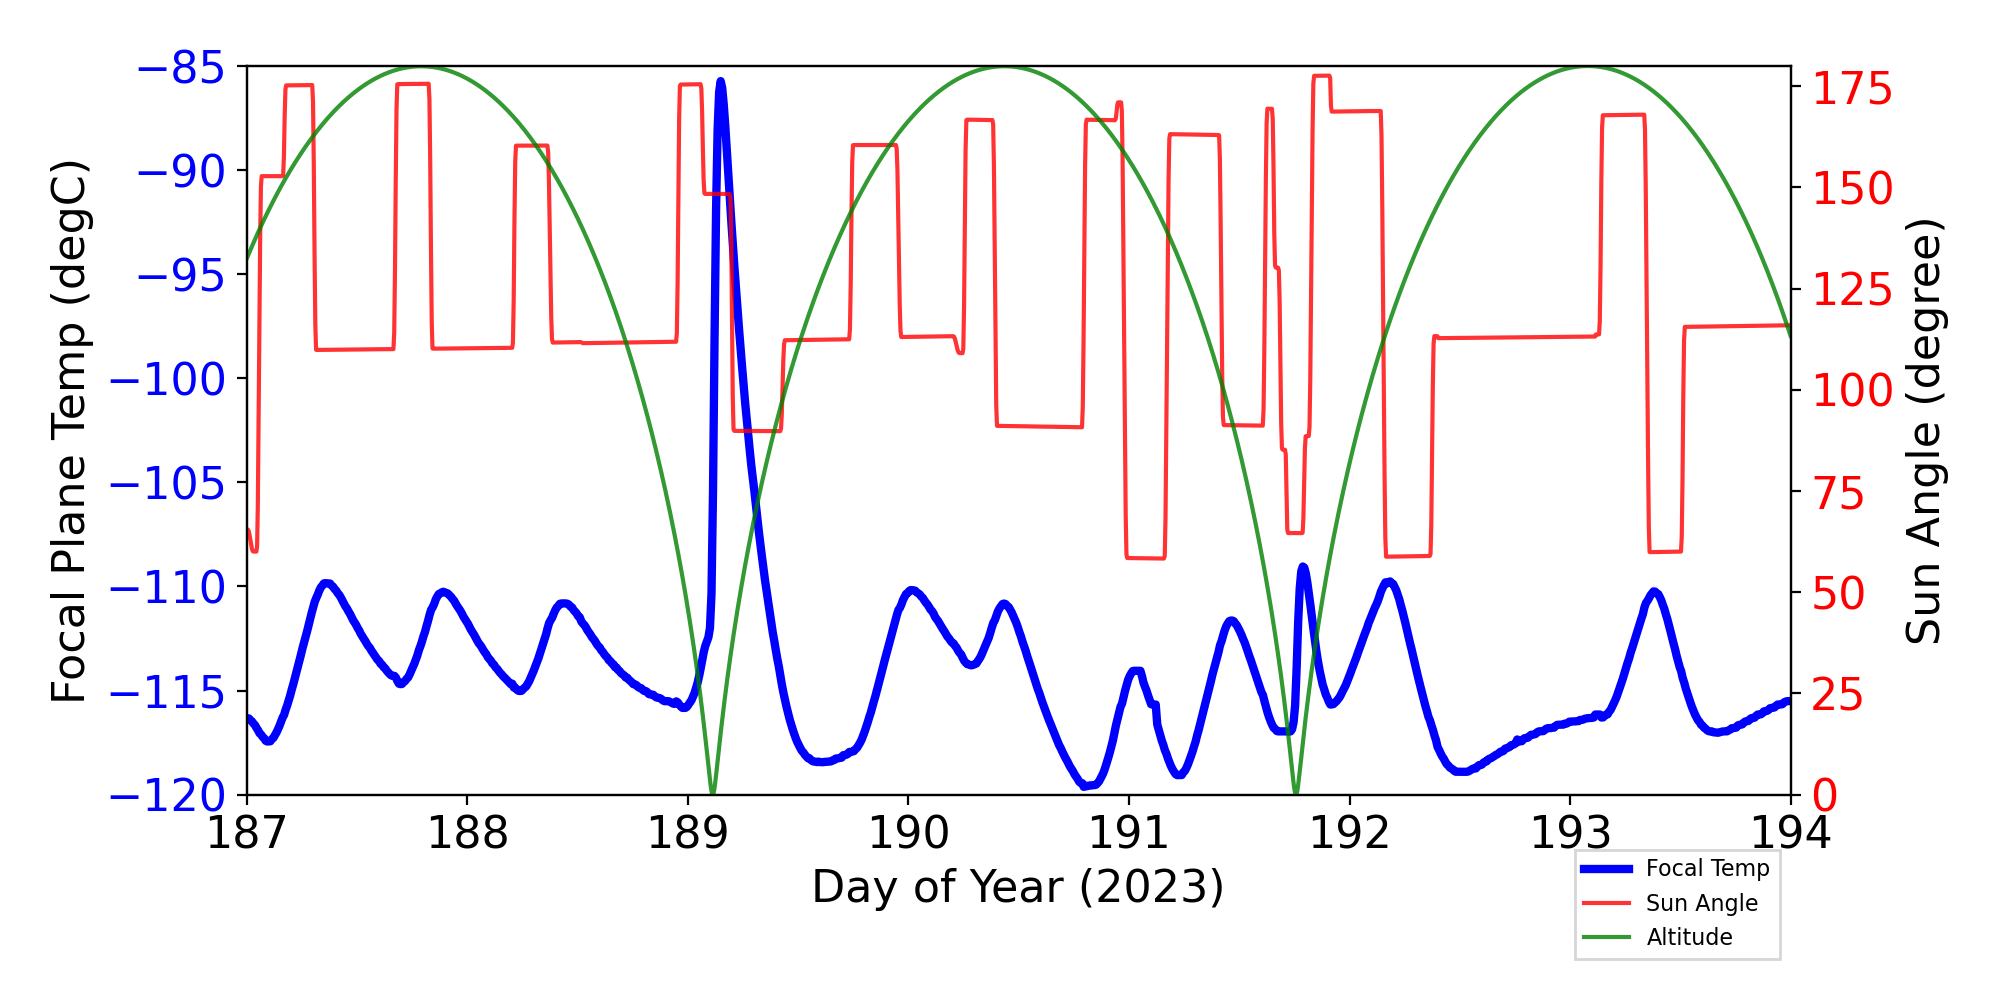
ACIS Focal Plane Temperature
For this period, 10 peaks are observed.
| Day (DOY) | Temp (C) | Width (Days) | |
|---|---|---|---|
| 186.58 | -105.86 | 0.92 | |
| 187.01 | -116.34 | 0.17 | |
| 187.36 | -109.84 | 1.15 | |
| 188.45 | -110.81 | 0.66 | |
| 189.16 | -86.05 | 0.61 | |
| 190.02 | -110.19 | 1.06 | |
| 191.06 | -114.30 | 0.28 | |
| 191.48 | -111.67 | 0.46 | |
| 191.80 | -109.10 | 0.19 | |
| 192.19 | -109.84 | 0.57 |
Weekly focal plane temperature with sun angle, earth angle, and altitude overplotted. Sun angle is the solar array angle, that is the angle between the sun and the optical axis (+X axis). The earth angle is the angle between earth and the ACIS radiator (+Z axis). Altitude varies from 34 kkm to 128 kkm.
SIM Movements
7 TSC moves this period
| weekly average time/step | 0.00219 s |
|---|---|
| mission average time/step | 0.00132 s |
Telemetry
New violations or new extrema are shown in blue cells.
| MSID | 07/07/23 | 07/08/23 | 07/09/23 | 07/10/23 | 07/11/23 | 07/12/23 | 07/13/23 | yellow limits (lower) upper | red limits (lower) upper | Units | Description |
| TFTERANGE | 48.03 | 47.79 | 46.10 | 47.73 | 47.91 | 48.03 | (16.7) 37.5 |
(11.1) 45.0 |
K | TFTE VENT/RAD TEMP | |
| AWD3TQI | (-3.39) | (-1.22) 1.22 |
(-3.3) 3.3 |
AMP | WHEEL 3 TORQUE CURRENT | ||||||
| OBAAVG | 302.03 | 301.85 | 301.12 | 301.90 | (282.5) 300.0 |
(281.4) 301.0 |
K | OBA/TFTE TEMP | |||
| CTXBPWR | (0.00) | (0.00) | (36.12) 37.0 |
(36.0) 38.0 |
DBM | TRANSMITTER B OUTPUT POWER | |||||
| TCM_TX1 | (266.61) | (266.97) | (266.61) | (266.97) | (266.97) | (283.15) 348.15 |
(269.15) 404.15 |
K | TRANSPONDER-1 EXT BPL TEMP | ||
| TCM_PA1 | (258.16) | (258.16) | (258.56) | (258.96) | (258.16) | (269.15) 348.15 |
(260.15) 413.15 |
K | RF POWER AMP-1 EXT BPL TEMP | ||
| TCM_PA2 | (259.32) | (259.32) | (259.69) | (260.05) | (259.32) | (269.15) 348.15 |
(260.15) 413.15 |
K | RF POWER AMP-2 EXT BPL TEMP | ||
| SPHBLV | (77.00) | (0.00) | (79.0) 128.0 |
(78.0) 129.0 |
(2SPHBLV) | Spect Bot & Top MCP HV Monitor | |||||
| AWD4TQI | (-3.43) | (-1.22) 1.22 |
(-3.3) 3.3 |
AMP | WHEEL 4 TORQUE CURRENT | ||||||
| OBACONEAVG | 303.69 | 305.29 | 306.25 | (282.5) 300.0 |
(281.8) 301.0 |
K | OBA CONE AVG TEMP | ||||
| AWD6TQI | (-3.39) | (-3.43) | (-3.43) | (-1.22) 1.22 |
(-3.3) 3.3 |
AMP | WHEEL 6 TORQUE CURRENT | ||||
| AWD1TQI | (-3.39) | (-3.39) | (-1.22) 1.22 |
(-3.3) 3.3 |
AMP | WHEEL 1 TORQUE CURRENT | |||||
| SPHVLV | (0.00) | (72.0) 128.0 |
(71.0) 129.0 |
(2SPHVLV) | Spect Bot MCP HV Monitor | ||||||
| TEP_PSU2 | (264.06) | (264.06) | (264.06) | (283.15) 343.15 |
(264.15) 393.15 |
K | PSU-2 TEMP | ||||
| OBADIAGRAD | 4.49 | 4.49 | 4.46 | 4.48 | 4.14 | 4.31 | (-1.11) 3.5 |
(-2.78) 3.9 |
K | OBA DIAM GRAD | |
| IMHVLV | (79.00) | (126.0) 128.0 |
(125.0) 129.0 |
(2IMHVLV) | Imaging Bot MCP HV Monitor | ||||||
| HRMACAV | 295.63 | (293.4) 294.8 |
(292.8) 295.5 |
TEMP | HRMA CAVITY AVG TEMP | ||||||
| MZOBACONE | 309.59 | 309.87 | 308.30 | 309.01 | (260.2) 303.0 |
(250.2) 308.0 |
CONE | -Z SIDE OBA CONE |
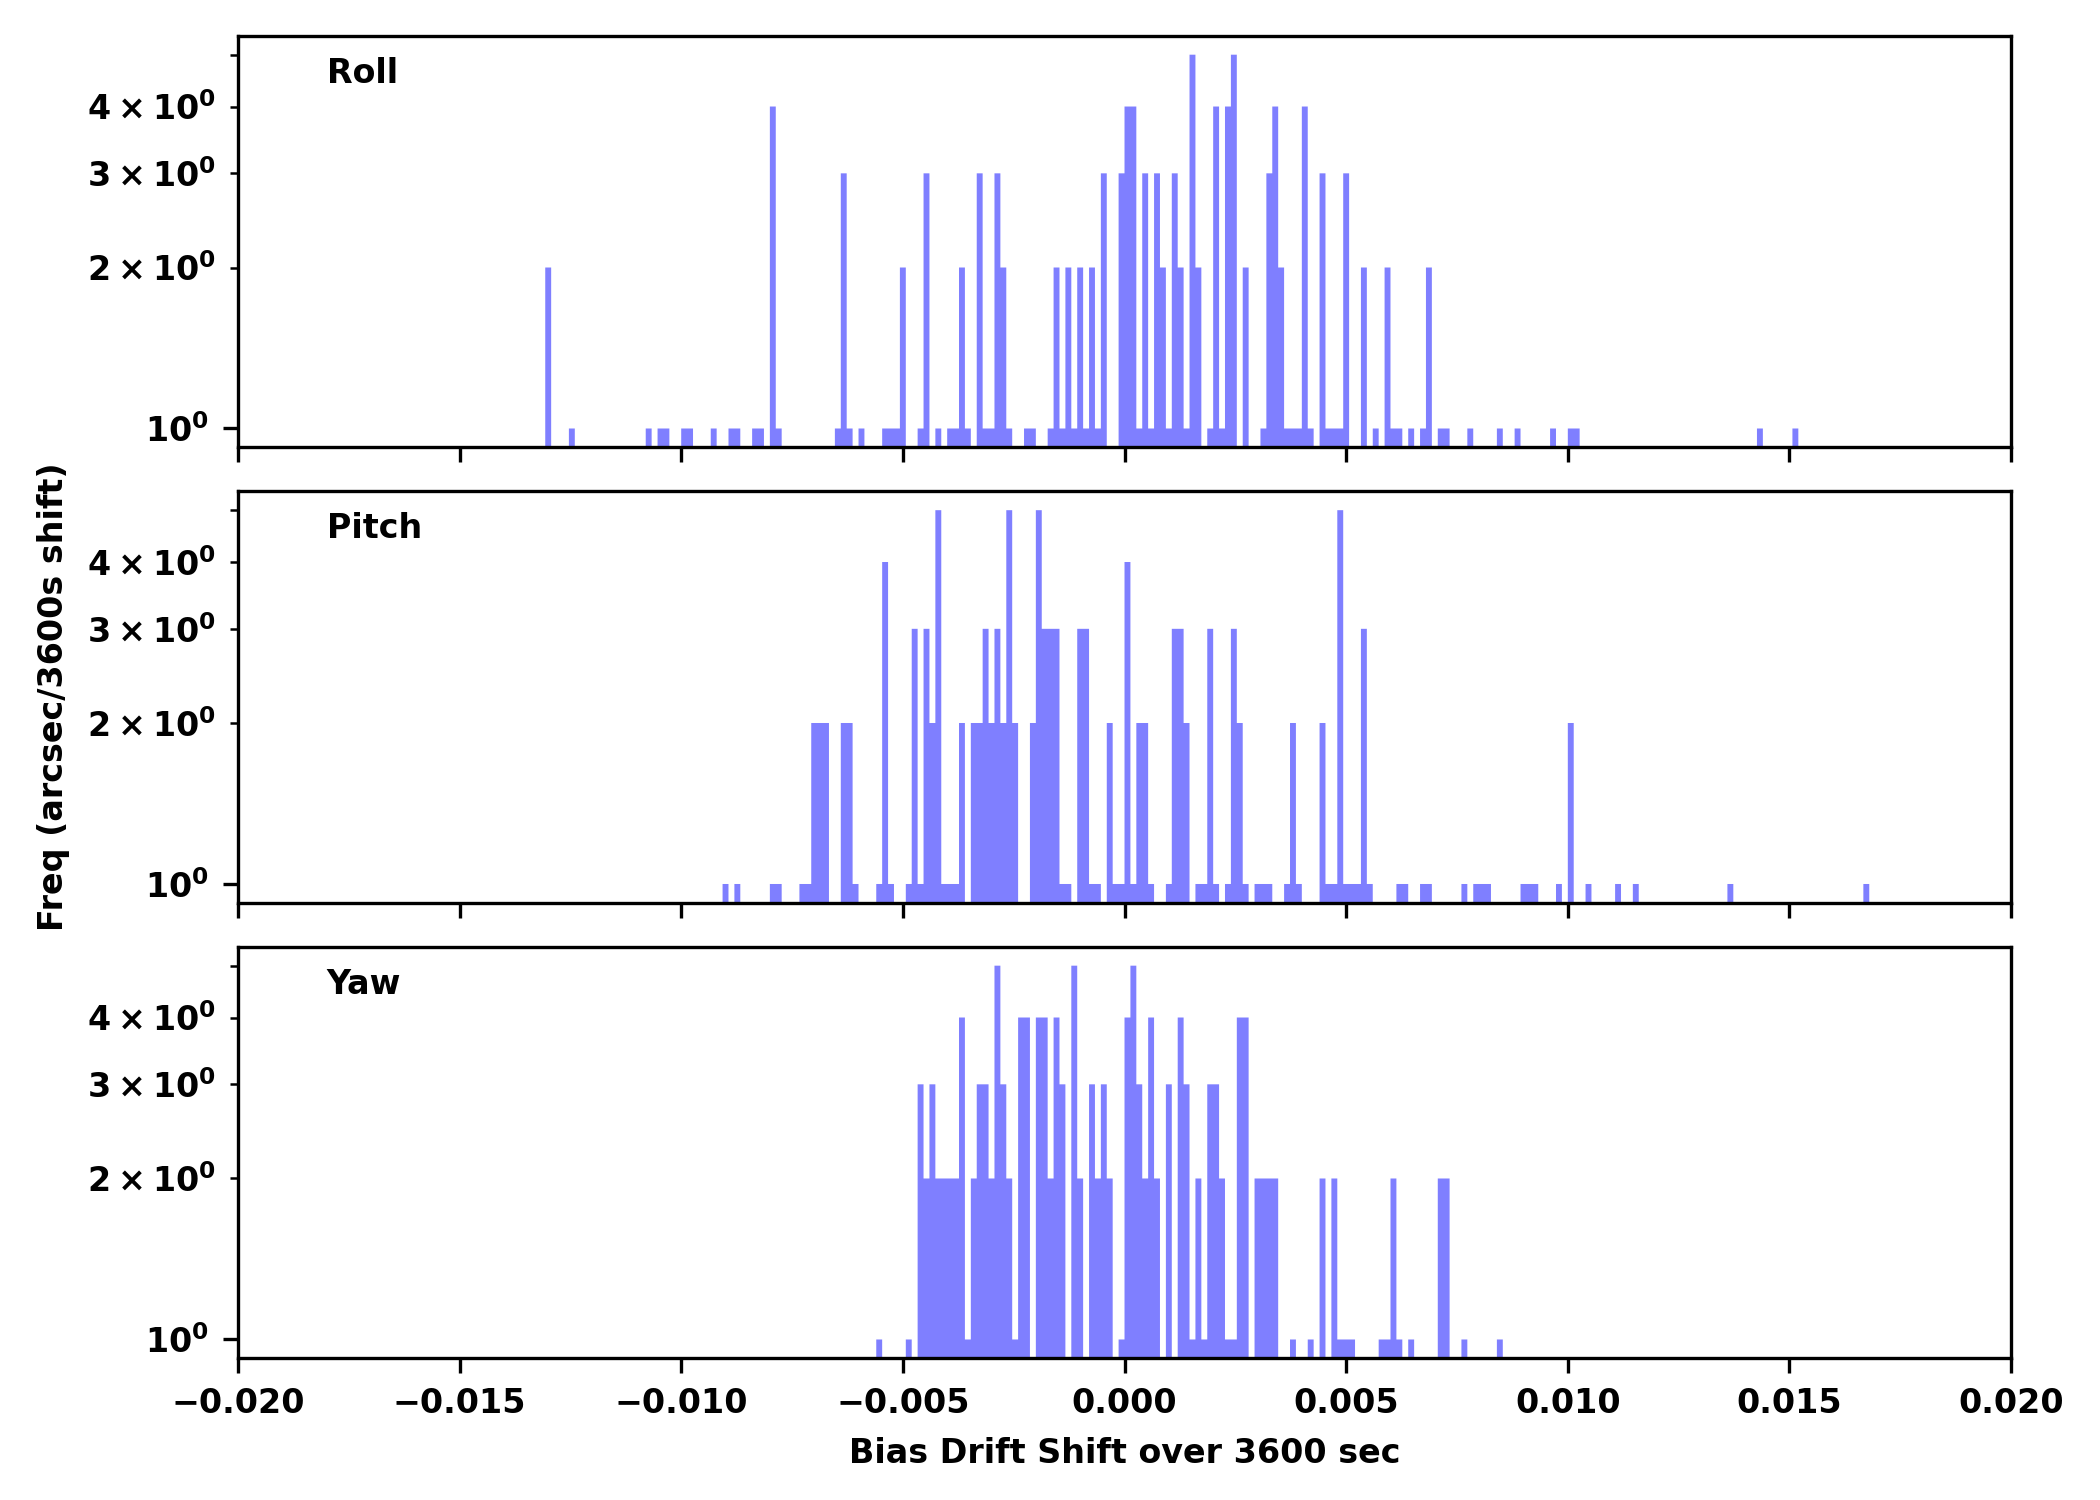
IRUs
| Gyro Bias Drift | Gyro Bias Drift Histogram |
|---|---|

|
|
Recent Observations
| OBSID | DETECTOR | GRATING | TARGET | ANALYSIS | ACA |
|---|---|---|---|---|---|
| 25960 | ACIS-0123 | NONE | Abell 2744 | OK | OK |
| 27941 | ACIS-0123 | NONE | ESO 338-4 | OK | OK |
| 27934 | ACIS-0123 | NONE | HEP G010.730-01.587 | OK | OK |
| 27943 | ACIS-67 | NONE | 3C 454.3 | OK | OK |
| 27935 | ACIS-0123 | NONE | HEP G011.675-01.822 | OK | OK |
| 26714 | ACIS-3678 | NONE | SDSS J1339+1310 | OK | OK |
| 26069 | ACIS-3678 | NONE | 2MASS J14184746+3028046 | OK | OK |
| 24686 | HRC-S | LETG | RX J1002.2-1925 | OK /Grat | OK |
| 25797 | ACIS-5678 | HETG | Trifid Nebula | OK /Grat | OK |
| 26646 | ACIS-67 | NONE | AT2022tsd | OK | OK |
| 27945 | ACIS-67 | NONE | 2RXS J200417.9-261952 | OK | OK |
| 25719 | ACIS-0123 | NONE | QSO J0041-4936 | OK | OK |
| 25730 | ACIS-0123 | NONE | QSO J0041-4936 | OK | OK |
| 27950 | ACIS-67 | NONE | AT2022tsd | OK | OK |
| 27944 | ACIS-67 | NONE | 2MASS J20100002-2801410 | OK | OK |
| 25926 | ACIS-0123 | NONE | Abell 2744 | OK | OK |
| 26006 | ACIS-0123 | NONE | CrA | OK | OK |
| 27799 | HRC-I | NONE | WOLF 437 | OK | OK |
| 22661 | HRC-I | NONE | XI BOO | OK | OK |
| 25560 | ACIS-67 | NONE | SDSS J140701.59+190417.9 | OK | OK |
| 27947 | ACIS-0123 | NONE | CrA | OK | OK |
| 24411 | ACIS-012367 | NONE | A2319 | OK | OK |
Trending
This week's focus is Gratings
Last reported on
Apr 27.
Only the most interesting or representative msids are shown below.
For a full listing choose the bulletted link.
| MSID | Mean | RMS | Delta/Yr | Delta/Yr/Yr | Unit | Description | |
|---|---|---|---|---|---|---|---|
| 4hposaro | -0.151 | 0.029 | 67.83 +/- 20.17 | 0.94 +/- 0.83 | na | NA | |
| 4hposbro | -0.147 | 0.030 | 68.42 +/- 20.38 | 0.94 +/- 0.84 | na | NA | |
| 4lposaro | 0.034 | 0.018 | 73.92 +/- 12.49 | 0.14 +/- 0.47 | na | NA | |
| 4lposbro | 0.036 | 0.019 | 72.98 +/- 12.84 | 0.27 +/- 0.49 | na | NA | |
| 4mp28av | 0.013 | 0.001 | 0.41 +/- 0.73 | -0.01 +/- 0.02 | V | MCE A: +28 VOLT MONITOR | |
| 4mp28bv | 0.079 | 0.005 | 2.01 +/- 3.21 | -0.02 +/- 0.12 | V | MCE B: +28 VOLT MONITOR | |
| 4mp5av | 0.019 | 0.001 | 0.49 +/- 0.77 | -0.01 +/- 0.03 | V | MCE A: +5 VOLT MONITOR | |
| 4mp5bv | 0.014 | 8.362e-04 | 0.37 +/- 0.59 | -0.01 +/- 0.02 | V | MCE B: +5 VOLT MONITOR |
If you have any questions, please contact: swolk@head.cfa.harvard.edu