Back to Top

ACIS Science Run Year: 2025


Data plotted here are taken from psi processing log (https://acisweb.mit.edu/acs).

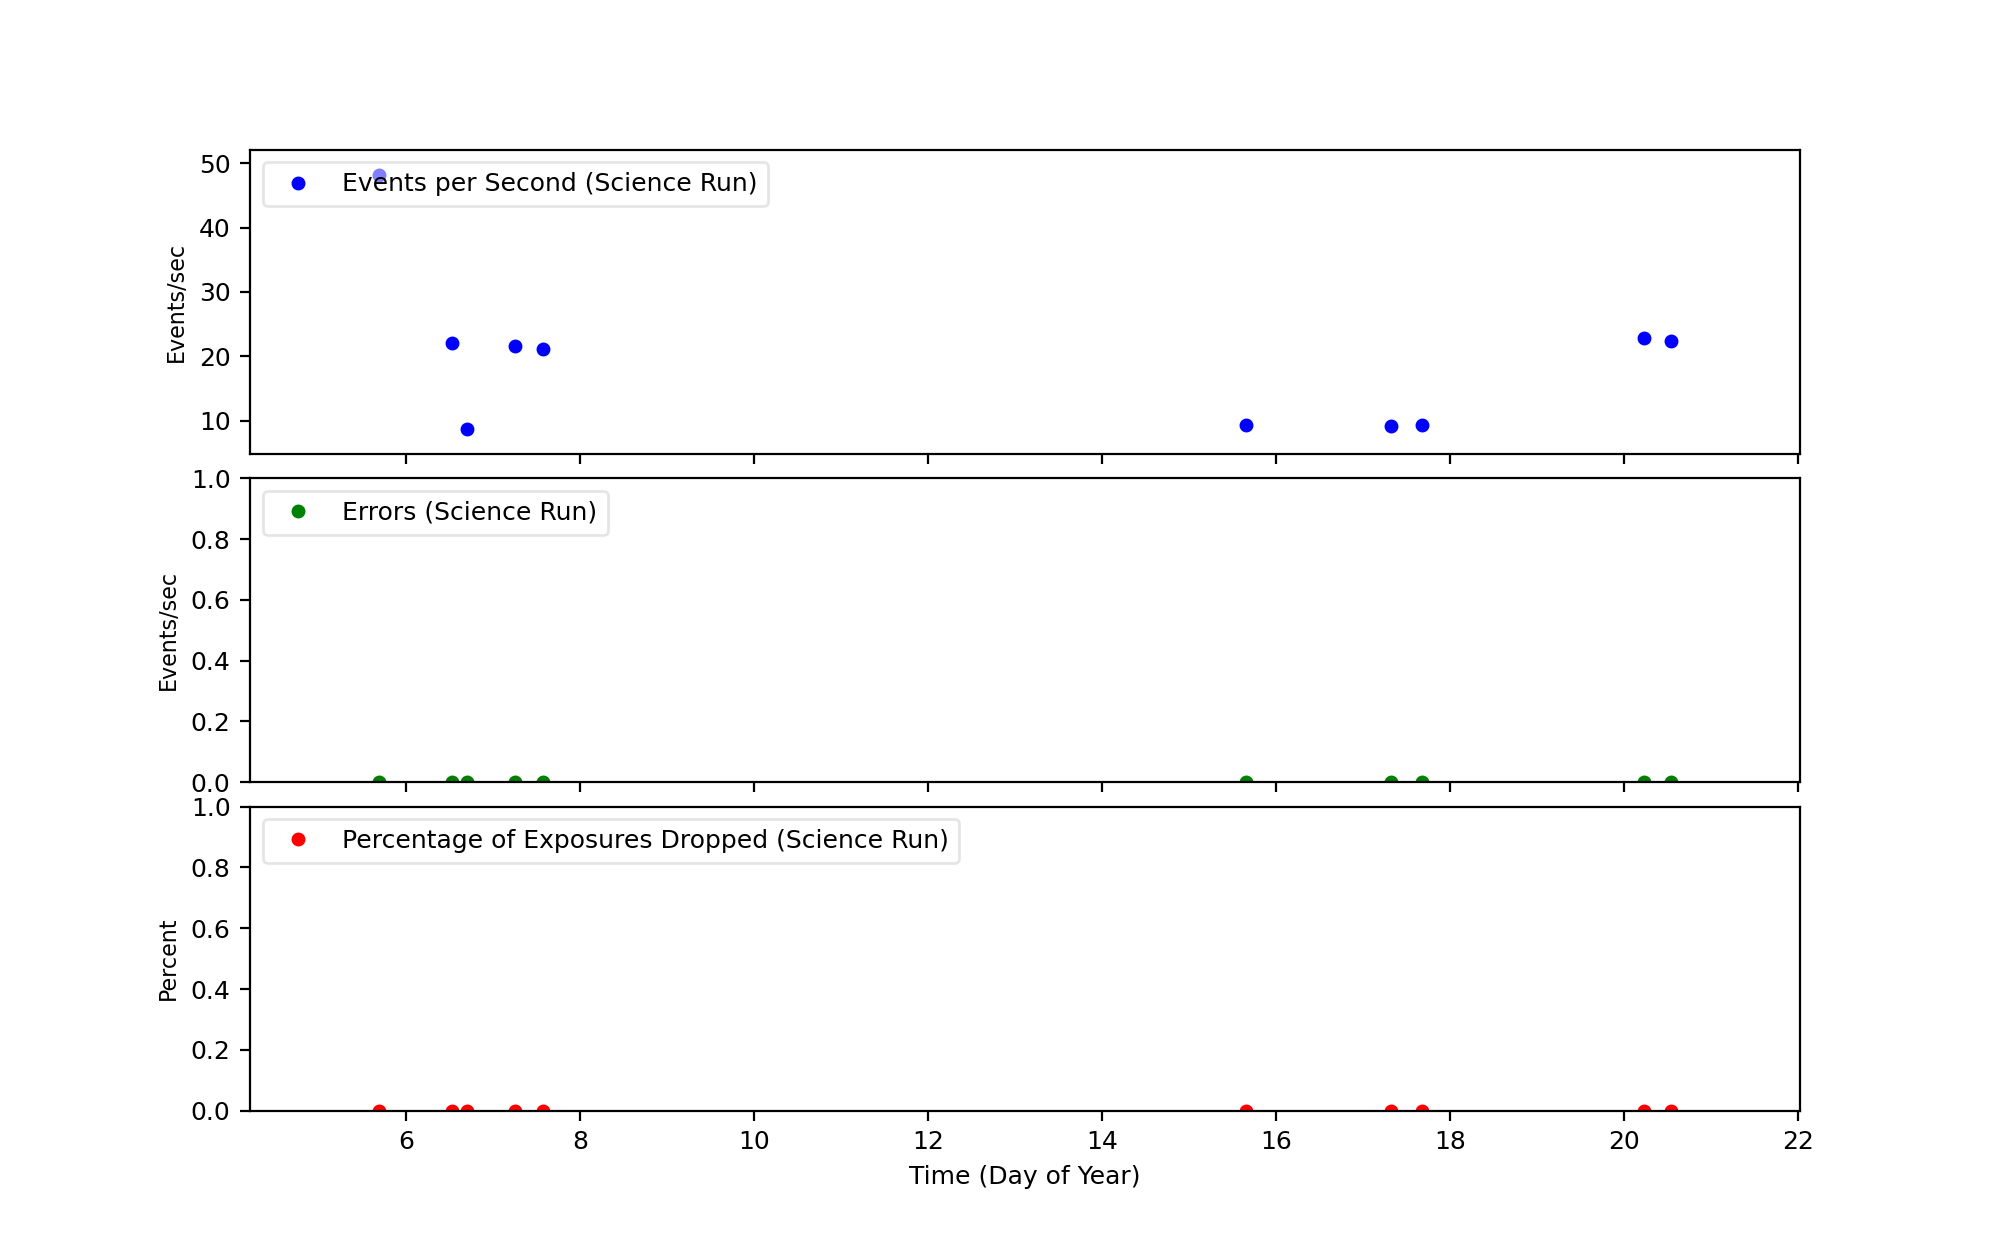
There are three plots in each FEP mode:

Top: evnets per second for each science run
Middle: numbers of errors reported by psi per ksec for each science run
Bottom: Percentage of exposures dropped for each science run

For more details, plese go to mit web site.

Trend Plots for Year 2025 (Click to Enlarge)

TE 3x3 TE 5x5 TE Raw CC 3x3

Data

DATA Plotted (ASCII format)
Te3x3 DATA with Dropped Rate > 3 % Te3x3 DATA with Event Rate > 180 cnt/sec Te3x3 DATA with Error # > 1 cnt/ksec
Te5x5 DATA with Dropped Rate > 3 % Te5x5 DATA with Event Rate > 56 cnt/sec Te5x5 DATA with Error # > 1 cnt/ksec


Plots/Data for Each Year

Year 1999
Year 2000
Year 2001
Year 2002
Year 2003
Year 2004
Year 2005
Year 2006
Year 2007
Year 2008
Year 2009
Year 2010
Year 2011
Year 2012
Year 2013
Year 2014
Year 2015
Year 2016
Year 2017
Year 2018
Year 2019
Year 2020
Year 2021
Year 2022
Year 2023
Year 2024
Year 2025

If you have any questions about this page, please contact swolk@cfa.harvard.edu

Last Data Update: 2025-01-27