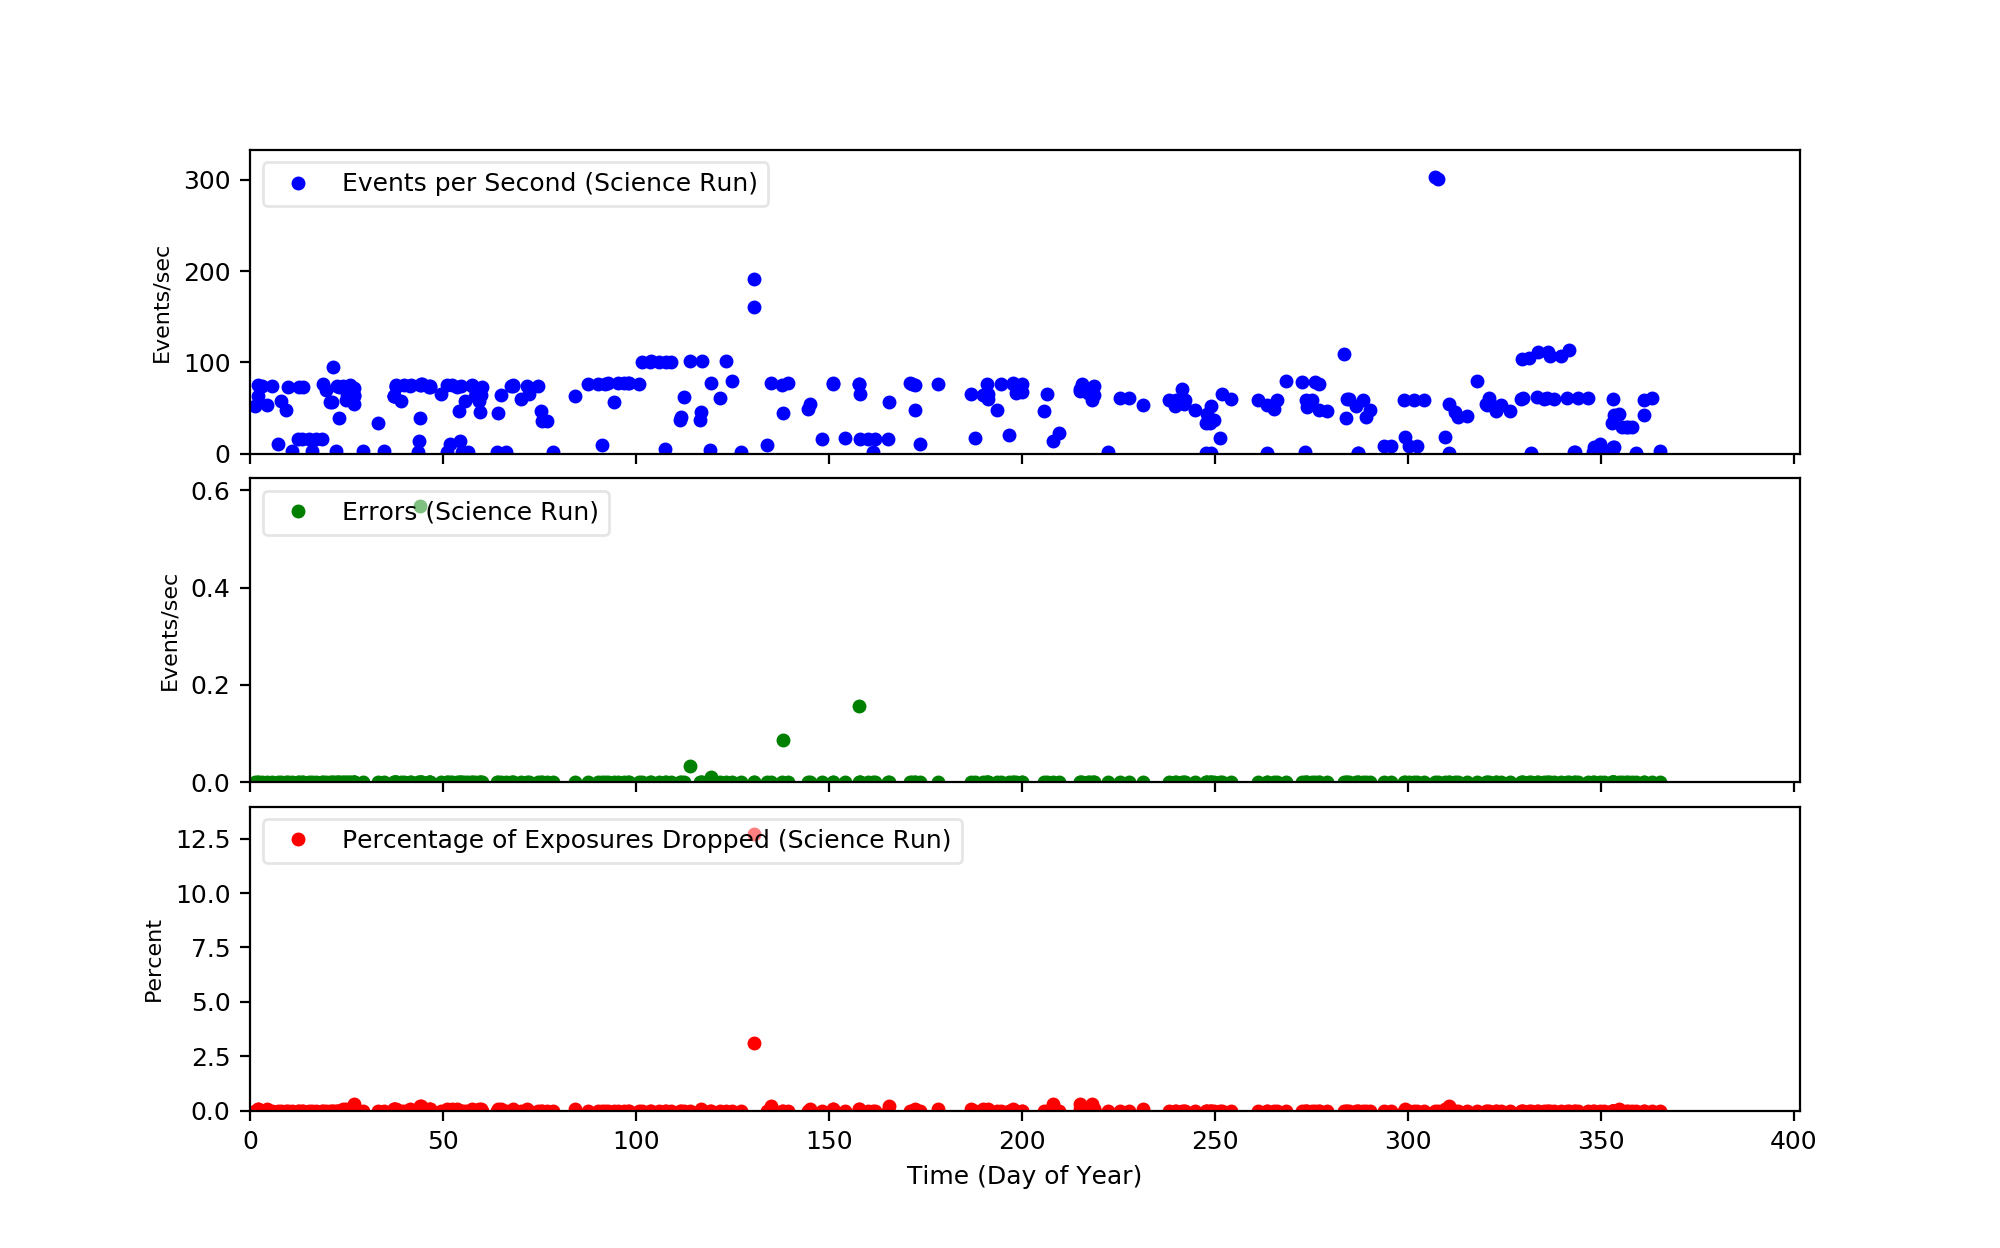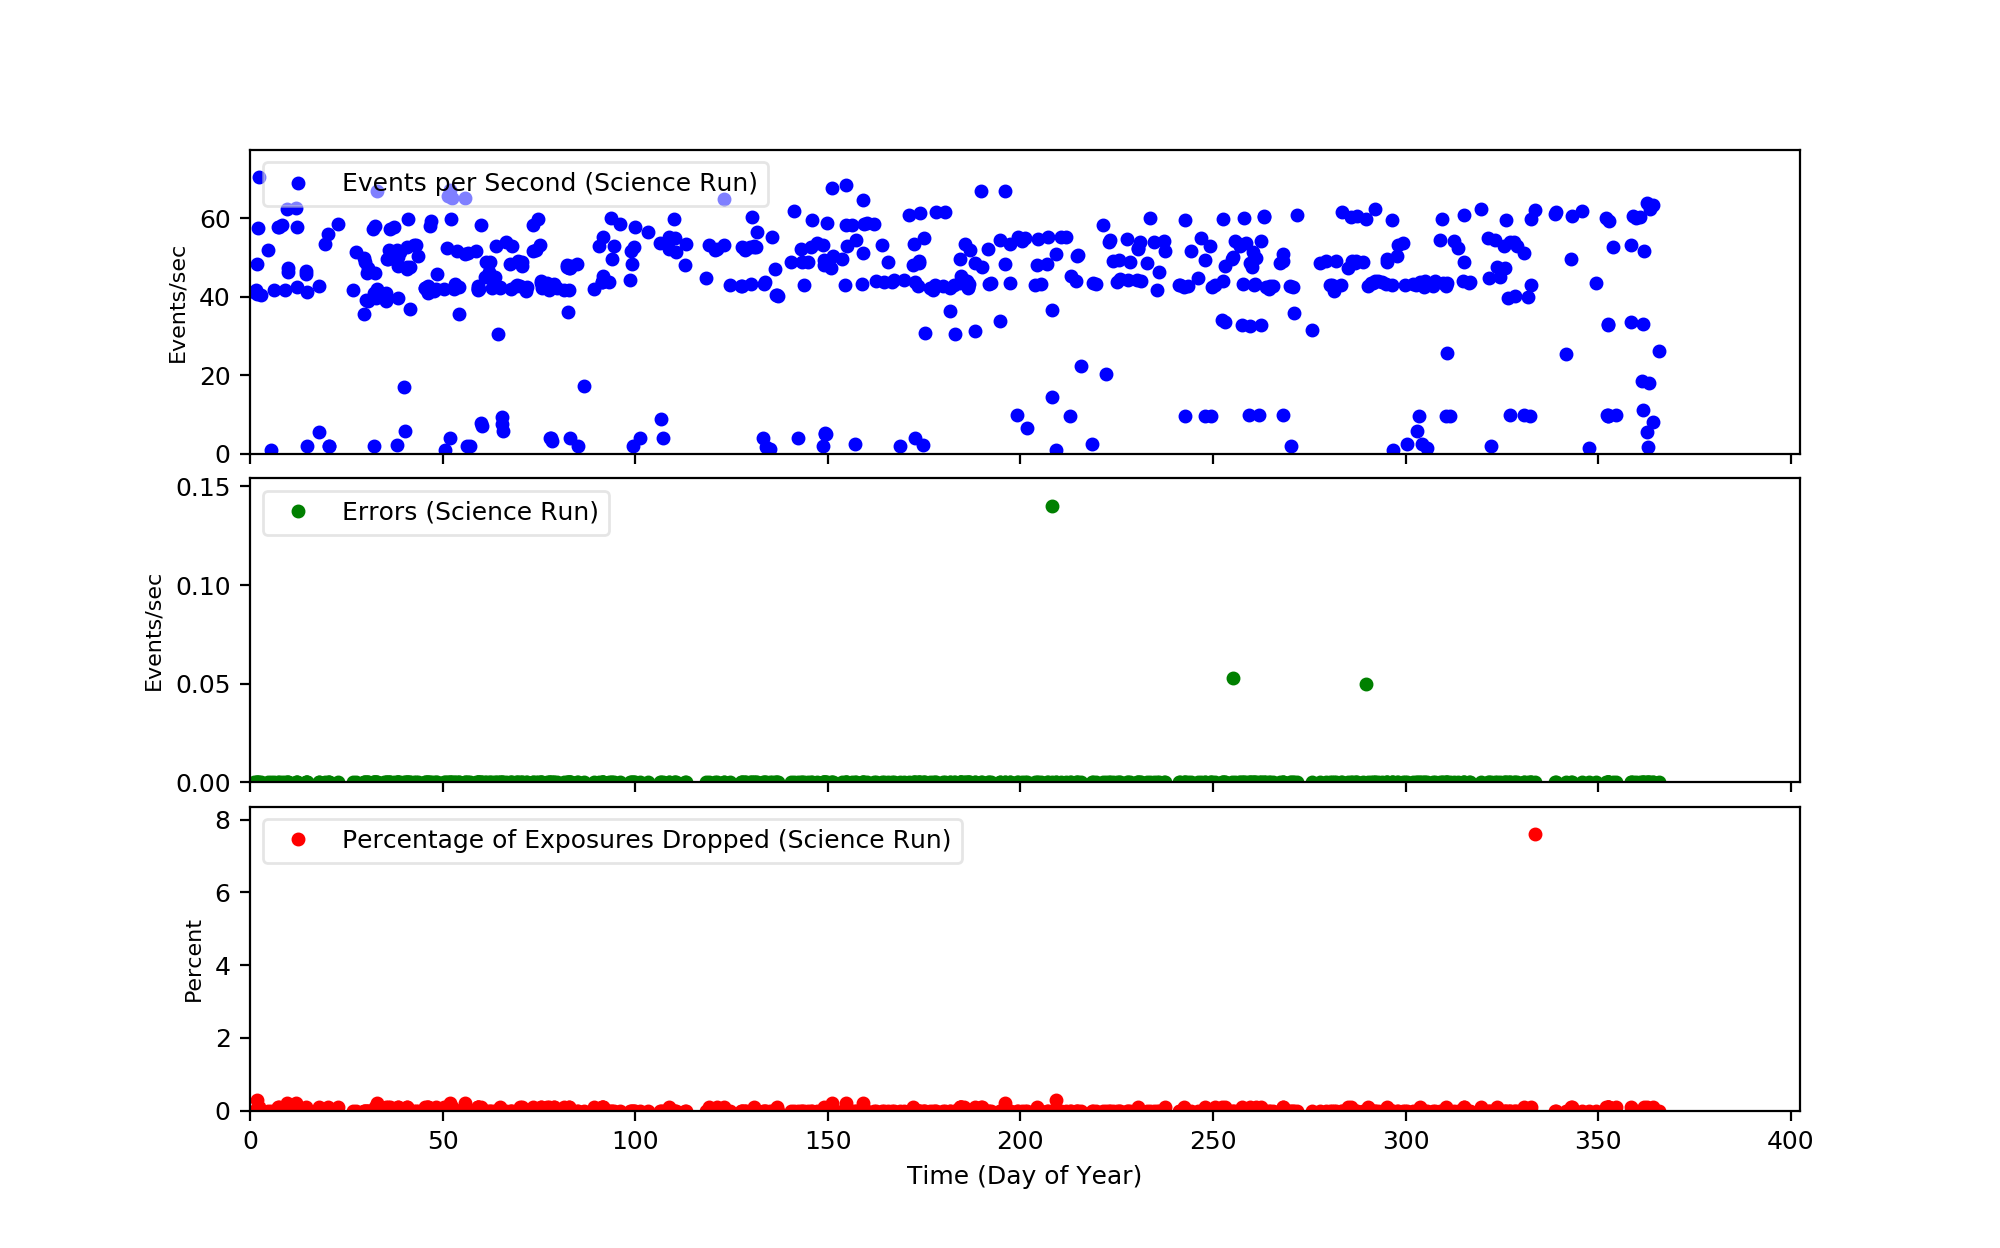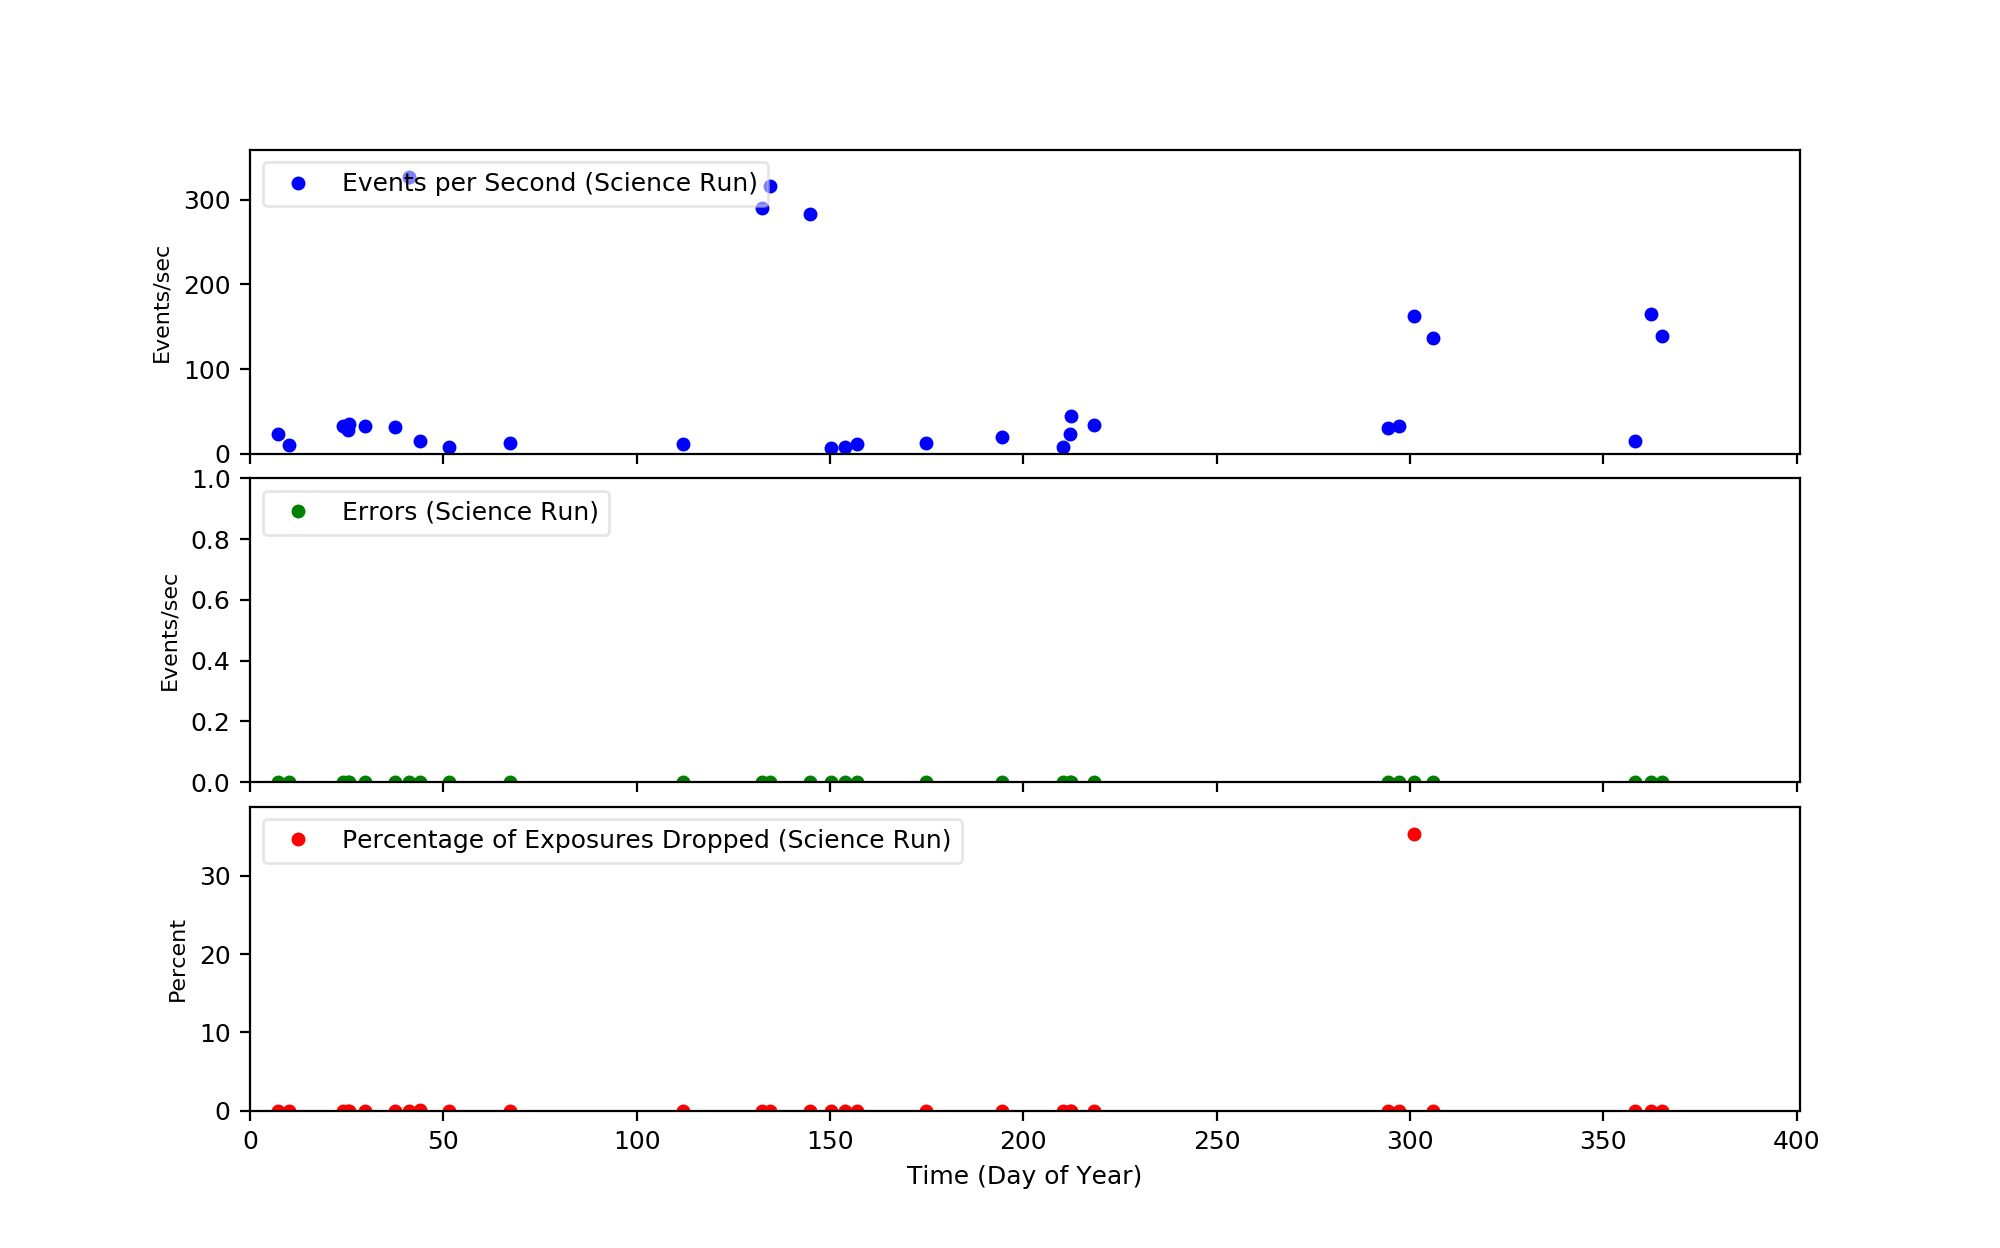


Data plotted here are taken from psi processing log (https://acisweb.mit.edu/acs).
There are three plots in each FEP mode:
| Top: | evnets per second for each science run |
| Middle: | numbers of errors reported by psi per ksec for each science run |
| Bottom: | Percentage of exposures dropped for each science run |
For more details, plese go to mit web site.
| TE 3x3 | TE 5x5 | TE Raw | CC 3x3 |  |
 |
 |
 |
|---|
If you have any questions about this page, please contact swolk@cfa.harvard.edu
Last Data Update: 2009-12-31