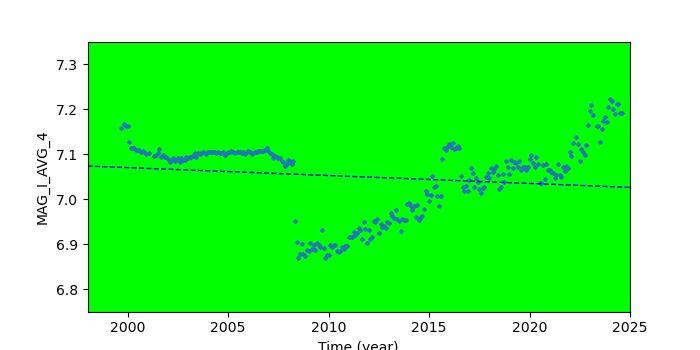
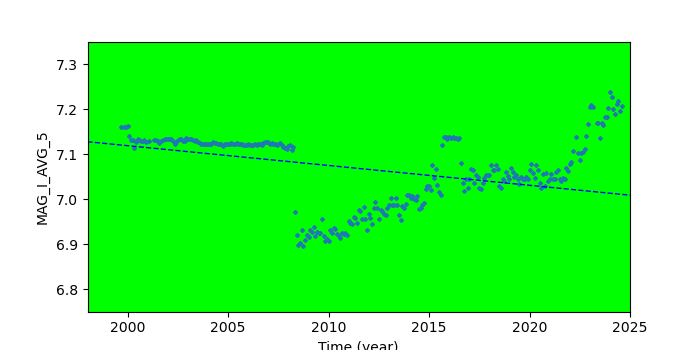
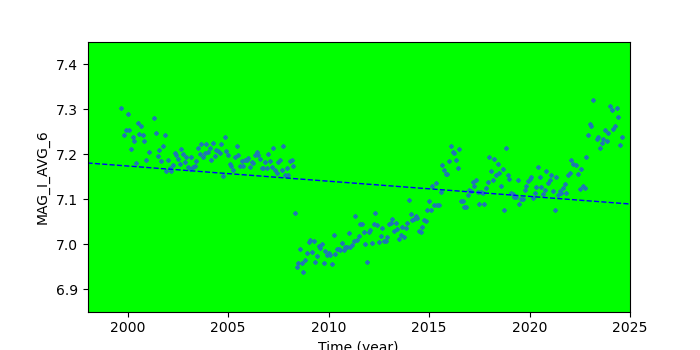
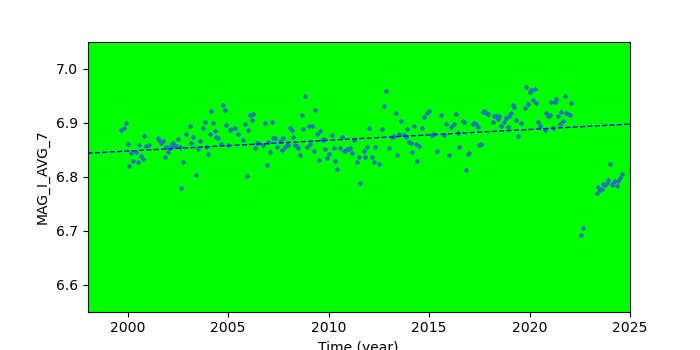
The following plots/links show magnitude and positional error trends for fiducial
lights and guide stars on various time scales.
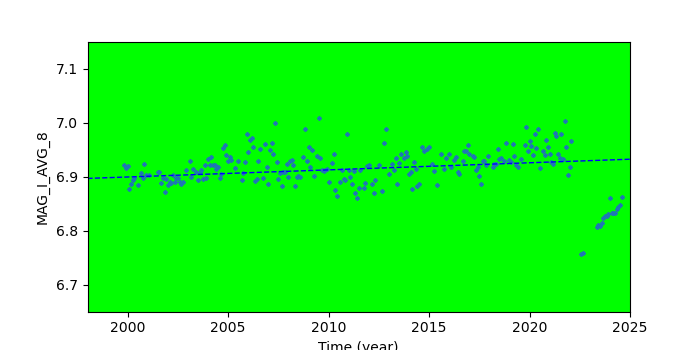
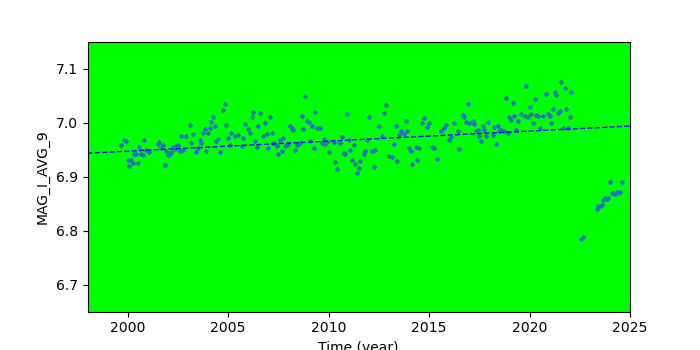
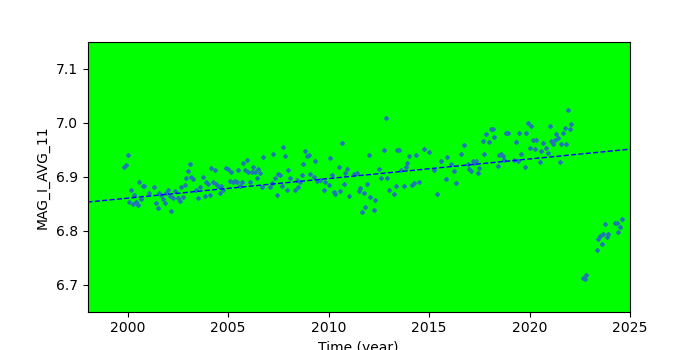
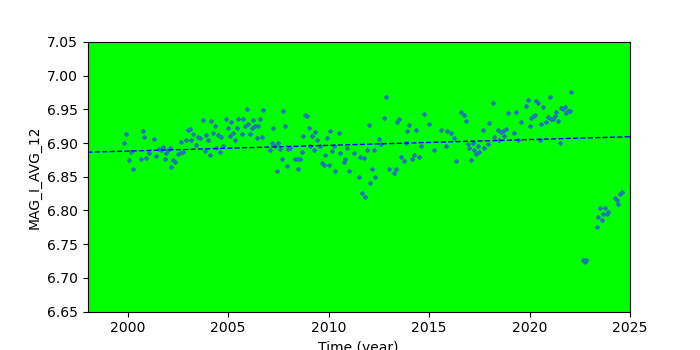
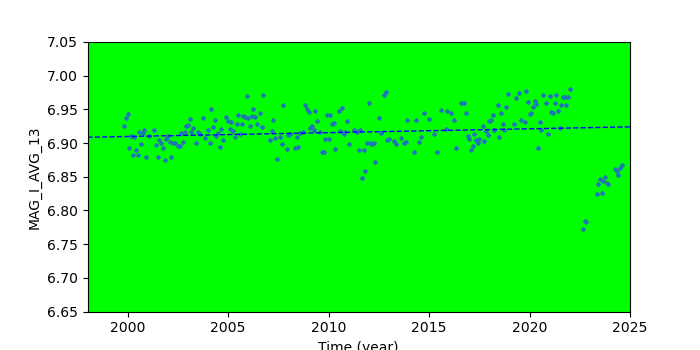
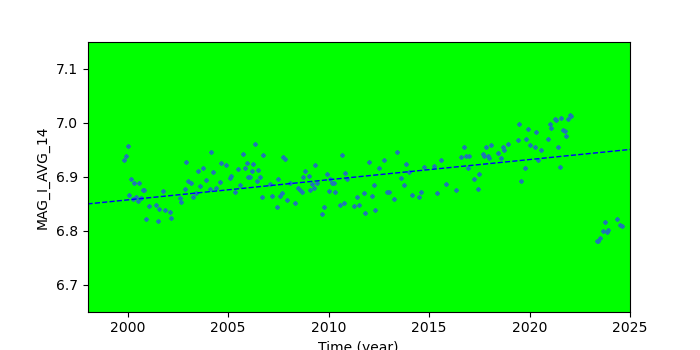
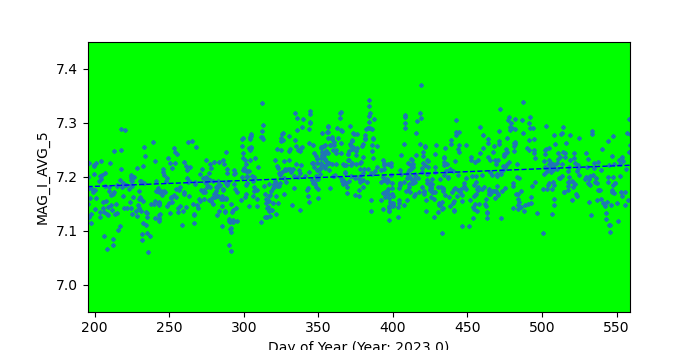
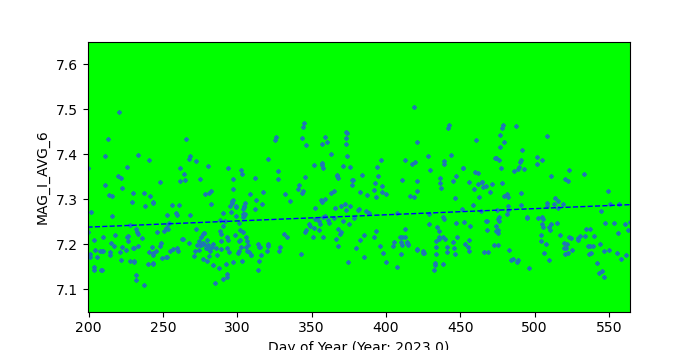
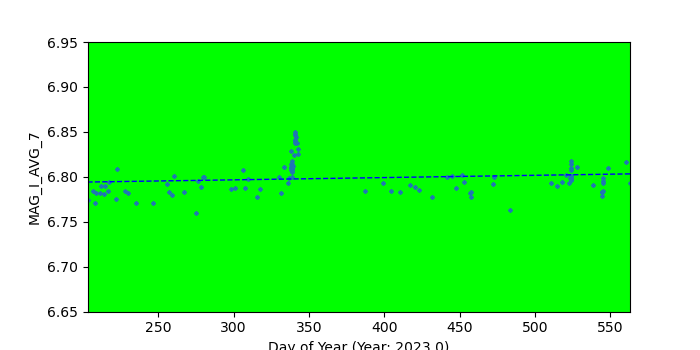
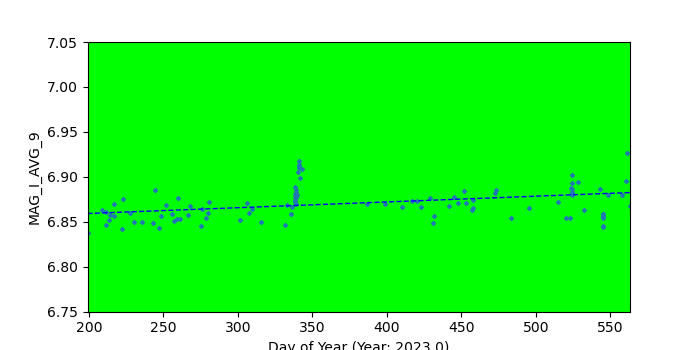
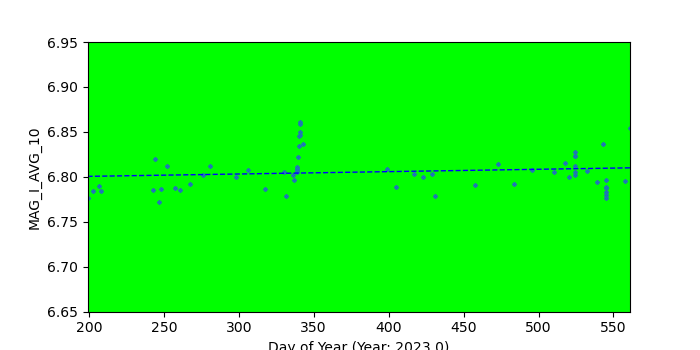
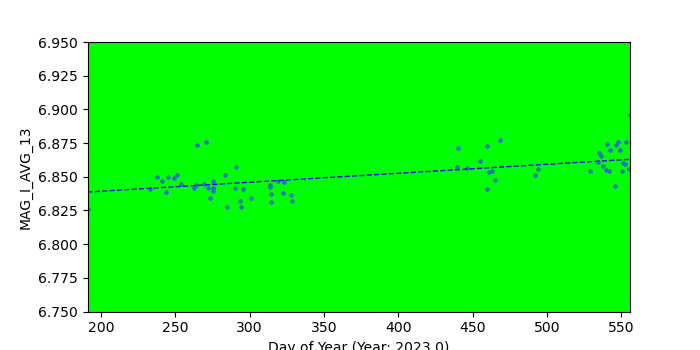
Click a plot to enlarge it. Each point is a monthly average.
The slopes are in Mag / year.
| ACIS |

Slope: -1.850e-03 STD: 4.079e-01
|

Slope: -3.284e-03 STD: 4.005e-01
|

Slope: 1.495e-01 STD: 3.574e+00
|
|
Slope: -2.202e-03 STD: 4.069e-01
|
Slope: -3.654e-03 STD: 4.066e-01
|
Slope: -4.053e-03 STD: 4.114e-01
|
|
| HRCI |
Slope: -2.237e-02 STD: 2.604e+00
|
Slope: -2.910e-02 STD: 2.601e+00
|
Slope: -4.087e-02 STD: 2.641e+00
|

Slope: -3.023e-02 STD: 3.367e+00
|
| HRCS |
Slope: -7.941e-02 STD: 2.908e+00
|
Slope: -5.140e-02 STD: 2.985e+00
|
Slope: -7.788e-02 STD: 2.942e+00
|
Slope: -8.943e-02 STD: 3.405e+00
|
Click a plot to enlarge it.
The slopes are in per day.
| ACIS |

Slope: 5.211e-05 STD: 6.035e-02
|
Slope: 4.815e-06 STD: 6.035e-02
|

Slope: -1.688e-05 STD: 6.906e-02
|
|
Slope: -9.120e-06 STD: 5.118e-02
|
Slope: 1.034e-05 STD: 5.584e-02
|
Slope: 1.443e-04 STD: 7.967e-02
|
|
| HRCI |
Slope: -5.486e-05 STD: 1.602e-02
|

Slope: -1.981e-05 STD: 1.775e-02
|
Slope: -7.615e-06 STD: 1.577e-02
|
Slope: -7.324e-06 STD: 2.160e-02
|
| HRCS |

Slope: -1.003e-04 STD: 2.239e-02
|

Slope: -8.346e-05 STD: 1.940e-02
|
Slope: -1.349e-04 STD: 1.855e-02
|

Slope: -4.598e-05 STD: 1.569e-02
|
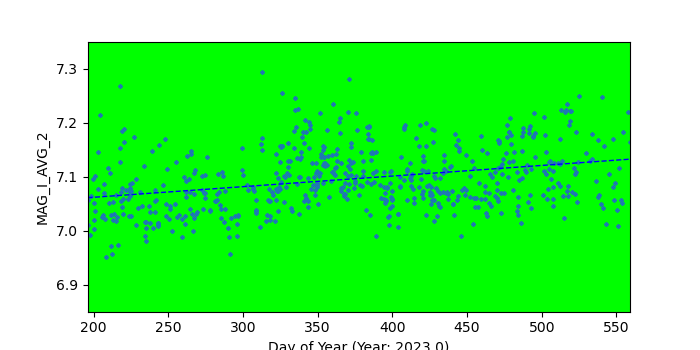
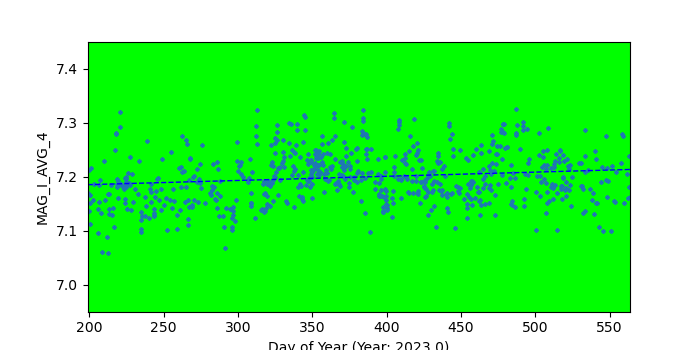
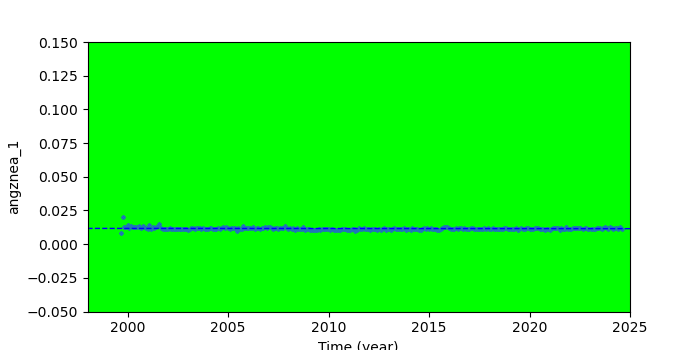
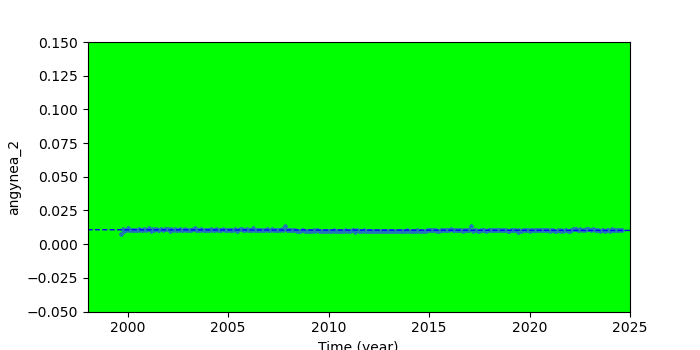
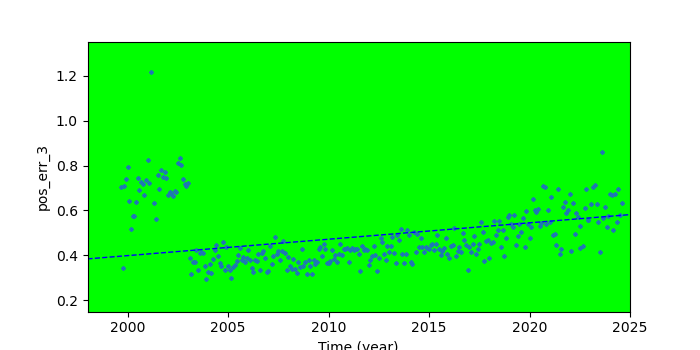
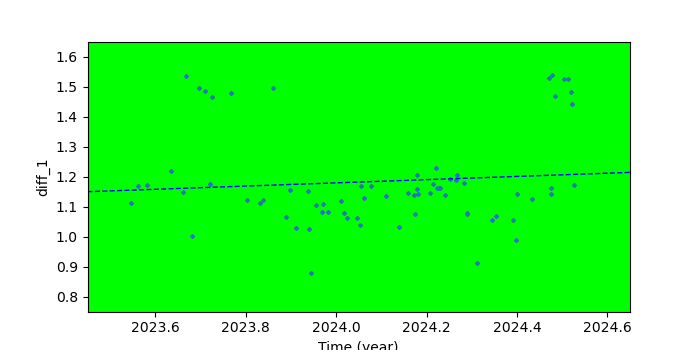
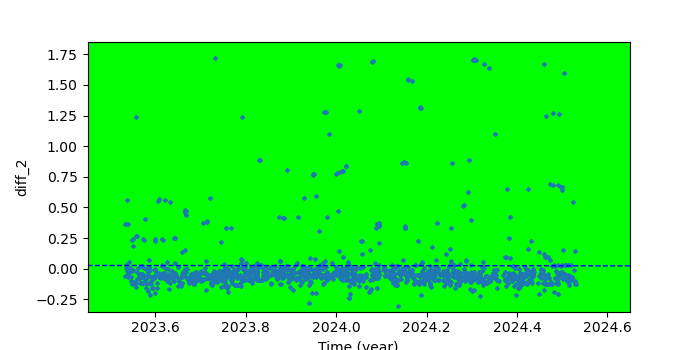
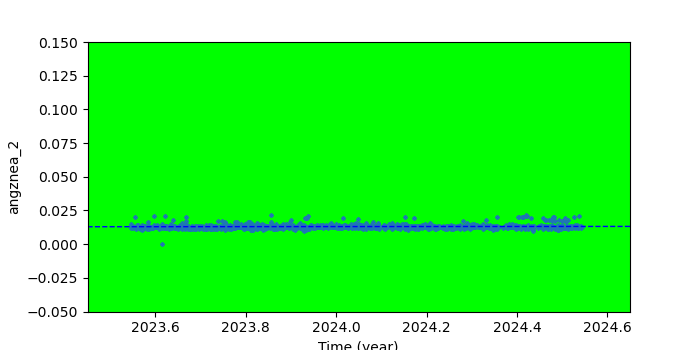
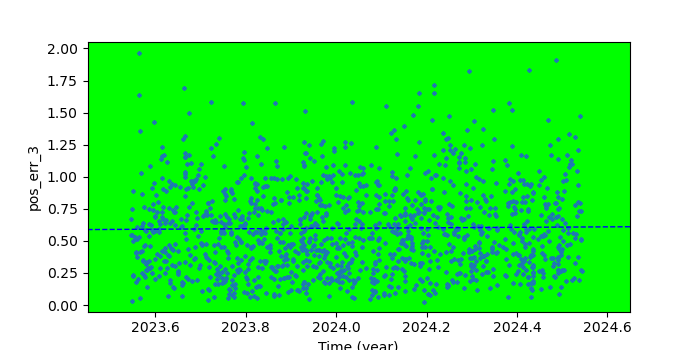
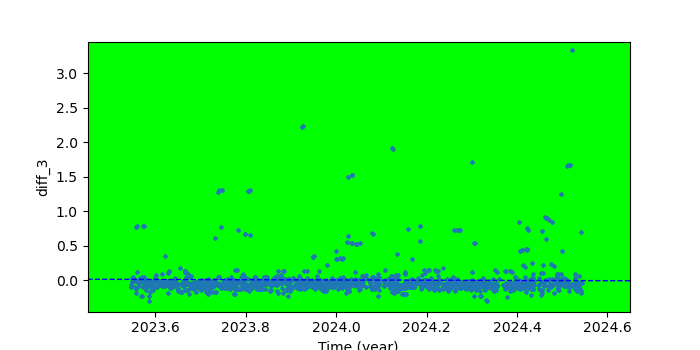
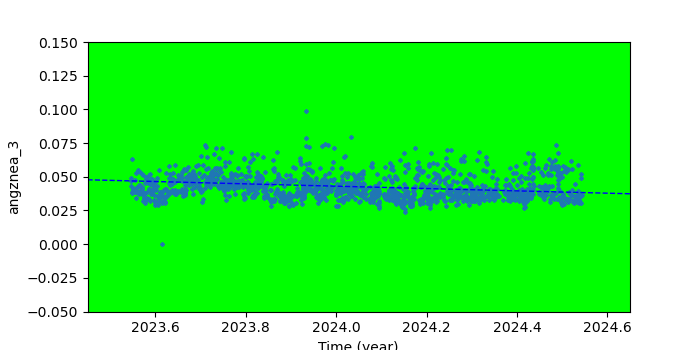
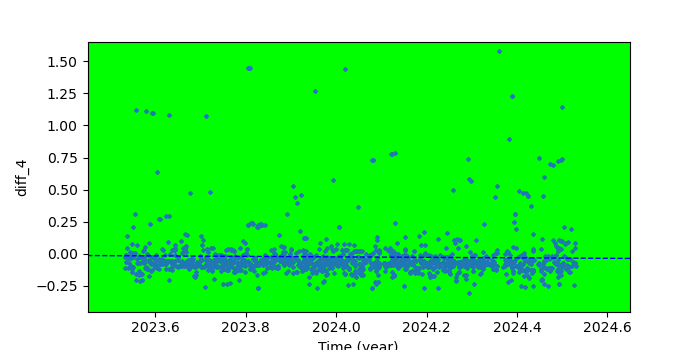
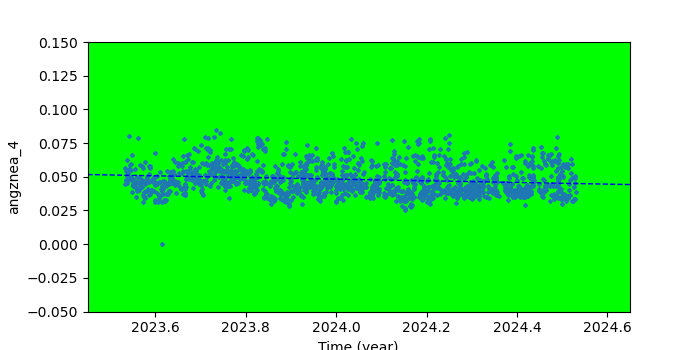
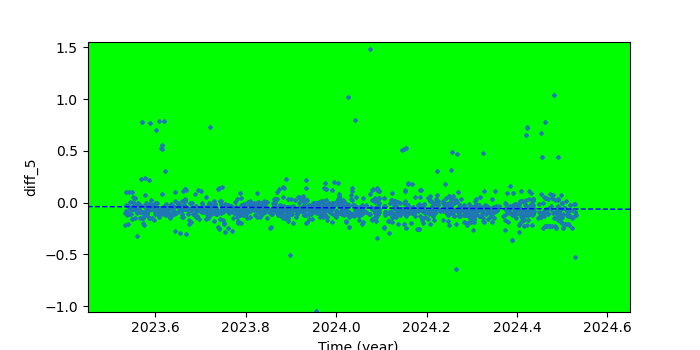
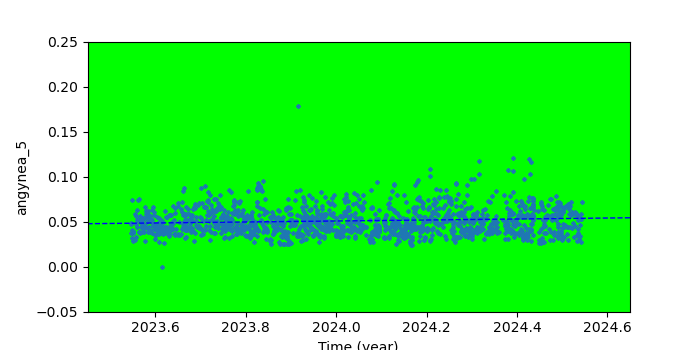
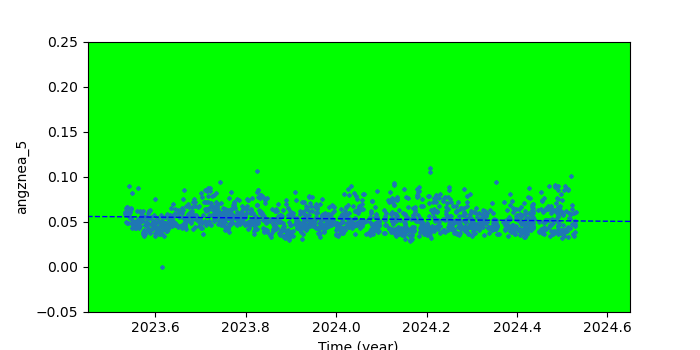
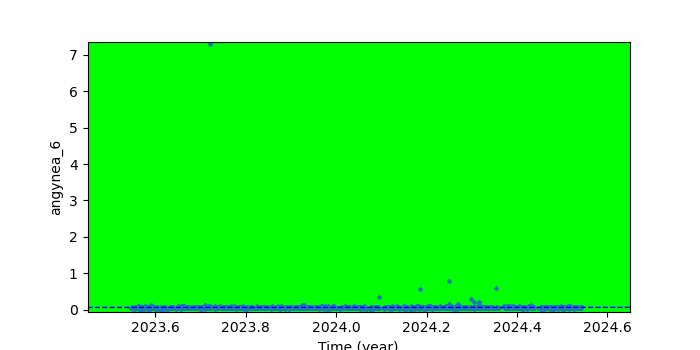
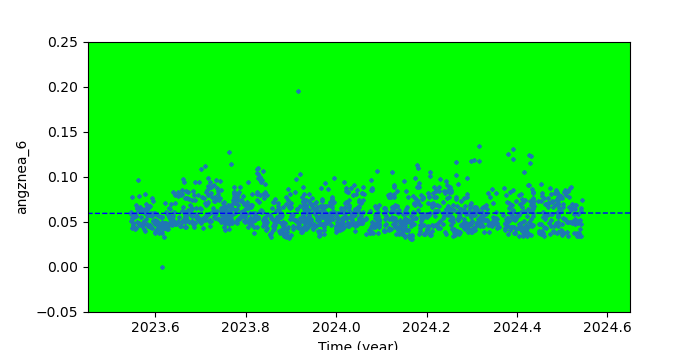
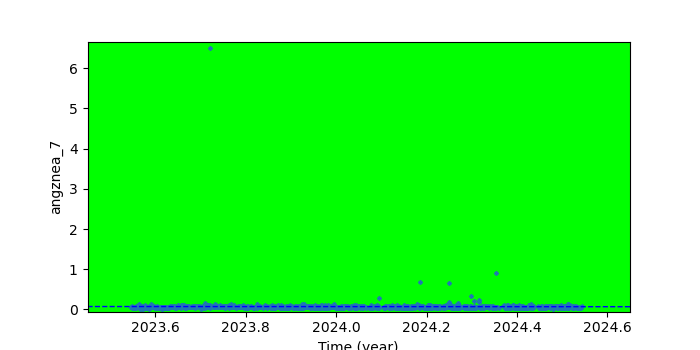
Click an image to enlarge it.
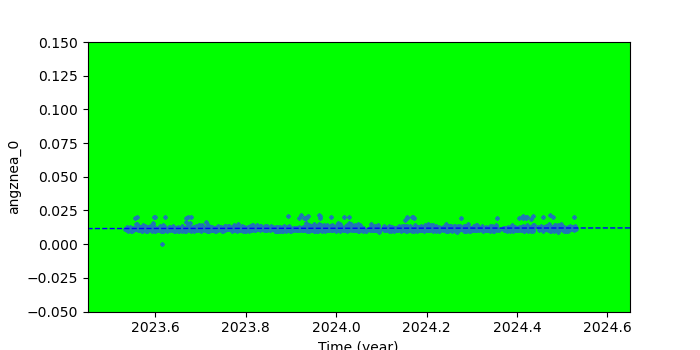
The slopes are in per year.
| Slot | Pos_Err | Delta Magnitude | Angynea | Angznea |
|---|
| 0 |

Slope: na STD: na
|

Slope: -2.386e-03 STD: 1.178e-01
|

Slope: -7.851e-06 STD: 5.196e-04
|
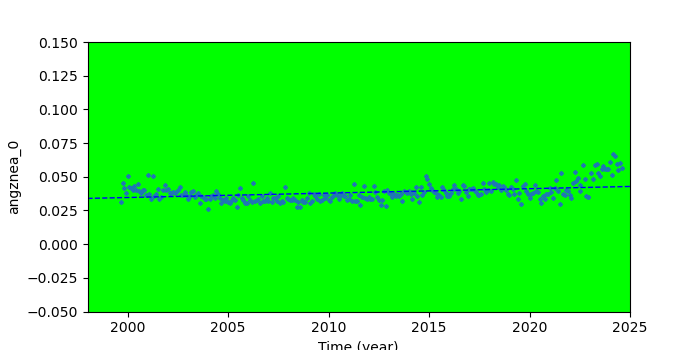
Slope: -7.851e-06 STD: 5.196e-04
|
| 1 |

Slope: na STD: na
|

Slope: -2.777e-03 STD: 1.184e-01
|
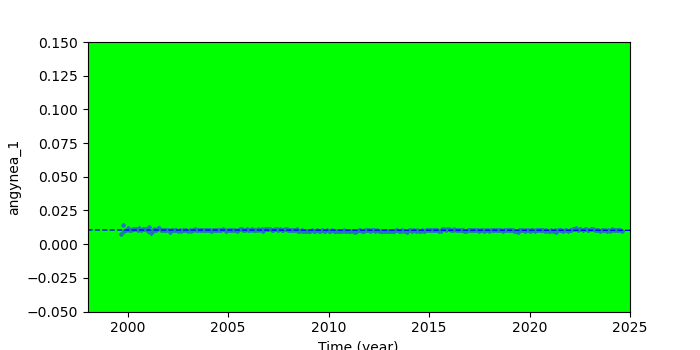
Slope: -5.119e-06 STD: 5.962e-04
|
Slope: -5.119e-06 STD: 5.962e-04
|
| 2 |

Slope: -4.029e-03 STD: 2.906e-01
|

Slope: 1.318e-03 STD: 2.707e-01
|
Slope: -6.485e-06 STD: 5.404e-04
|
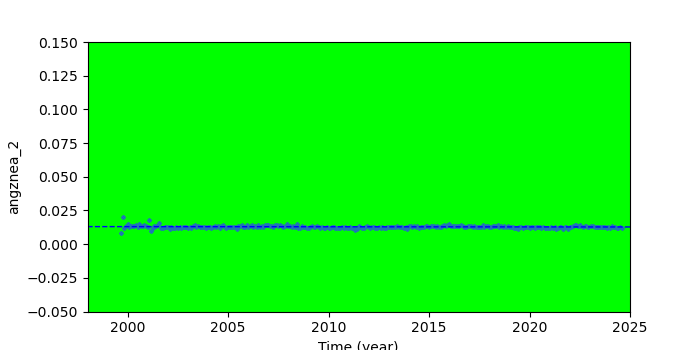
Slope: -6.485e-06 STD: 5.404e-04
|
| 3 |
Slope: 2.875e-03 STD: 1.366e-01
|
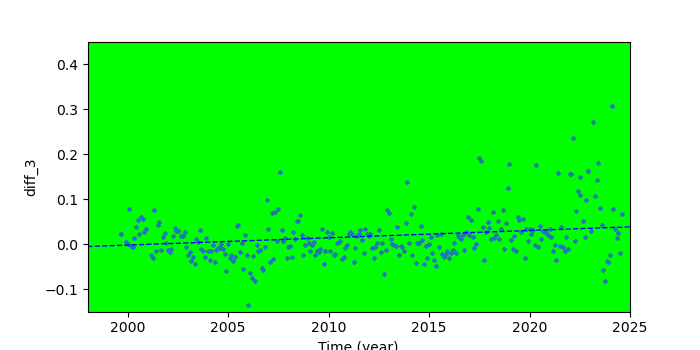
Slope: 9.009e-04 STD: 5.669e-02
|
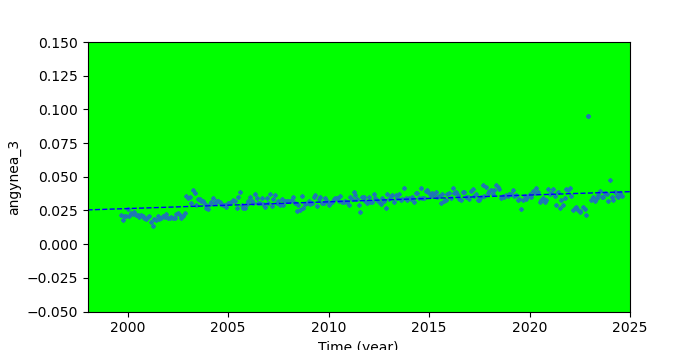
Slope: 4.896e-04 STD: 7.622e-03
|

Slope: 4.896e-04 STD: 7.622e-03
|
| 4 |

Slope: 3.434e-03 STD: 1.439e-01
|

Slope: -2.230e-04 STD: 4.664e-02
|

Slope: 4.353e-04 STD: 5.192e-03
|
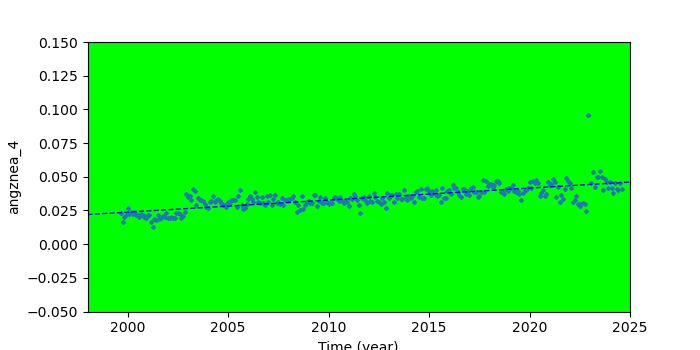
Slope: 4.353e-04 STD: 5.192e-03
|
| 5 |

Slope: 3.749e-03 STD: 1.429e-01
|
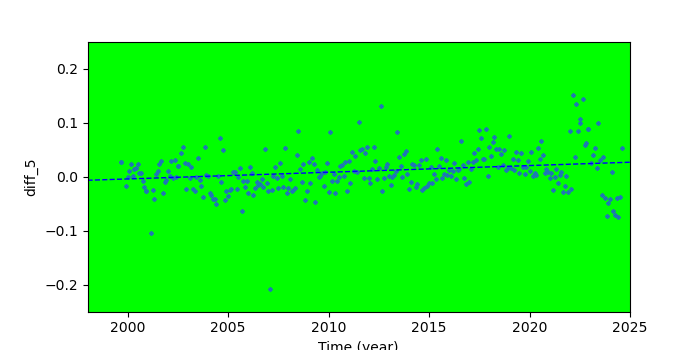
Slope: -9.827e-05 STD: 4.340e-02
|
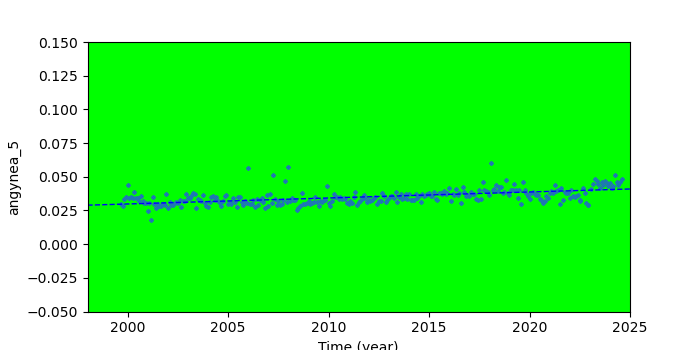
Slope: 4.565e-04 STD: 5.927e-03
|

Slope: 4.565e-04 STD: 5.927e-03
|
| 6 |

Slope: 3.956e-03 STD: 1.418e-01
|

Slope: -1.207e-03 STD: 4.120e-02
|
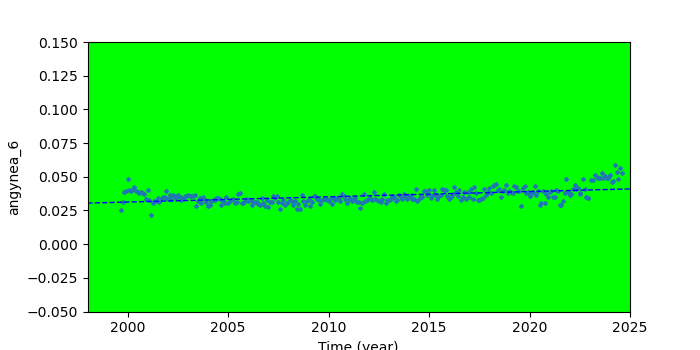
Slope: 5.343e-04 STD: 6.631e-03
|
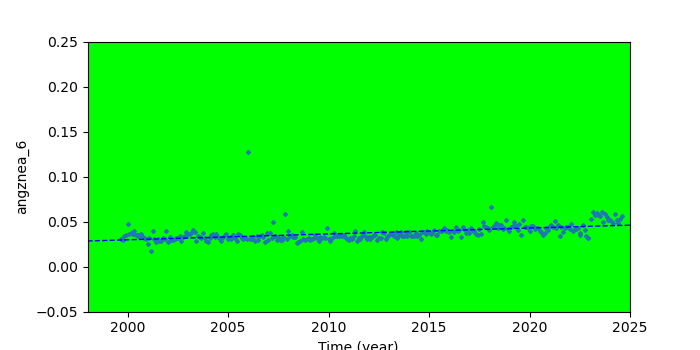
Slope: 5.343e-04 STD: 6.631e-03
|
| 7 |
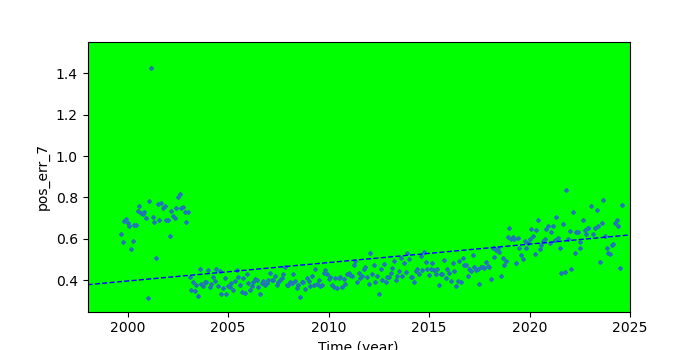
Slope: 3.695e-03 STD: 1.388e-01
|
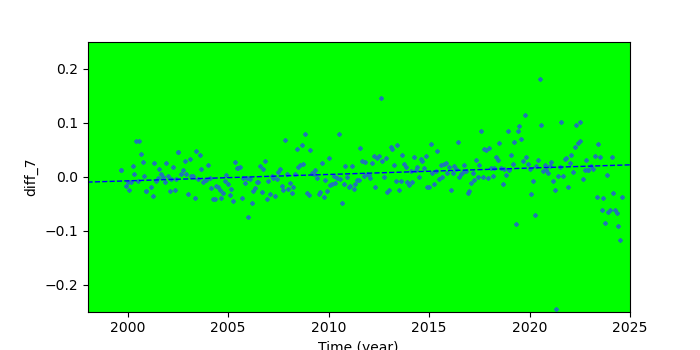
Slope: -7.885e-04 STD: 4.412e-02
|
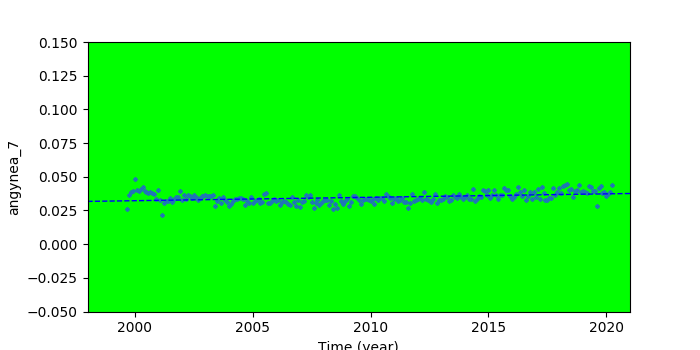
Slope: 6.111e-04 STD: 8.338e-03
|
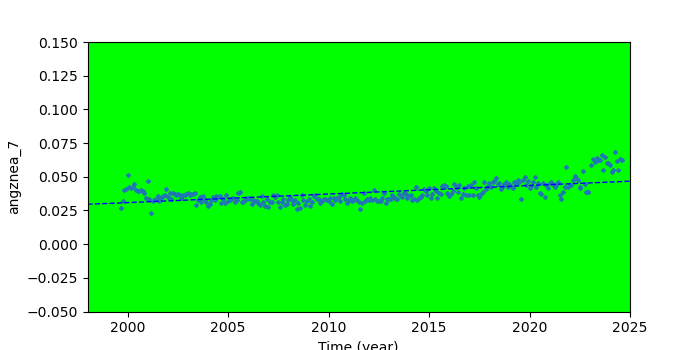
Slope: 6.111e-04 STD: 8.338e-03
|
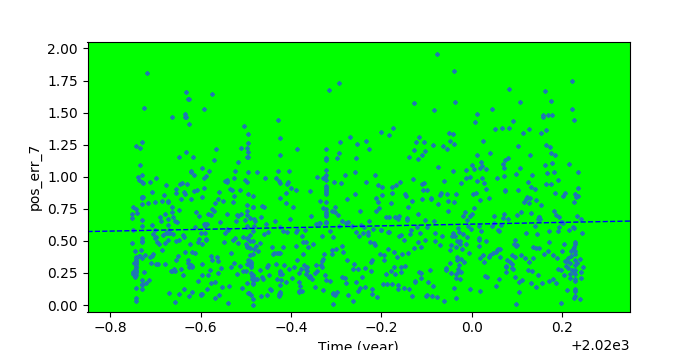
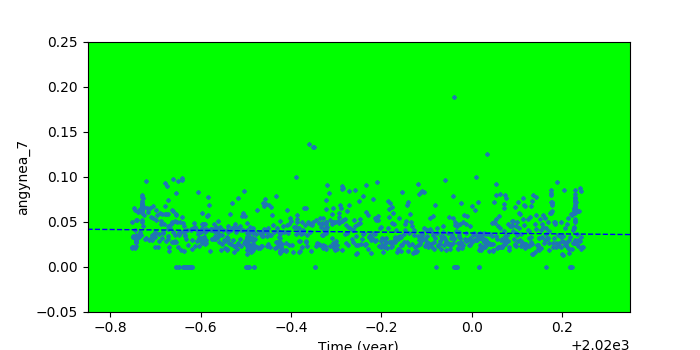
Click an image to enlarge it.
The slopes are per day.
| Slot | Pos_Err | Delta Magnitude | Angynea | Angznea |
|---|
| 0 |

Slope: na STD: na
|

Slope: -2.236e-04 STD: 1.189e-01
|
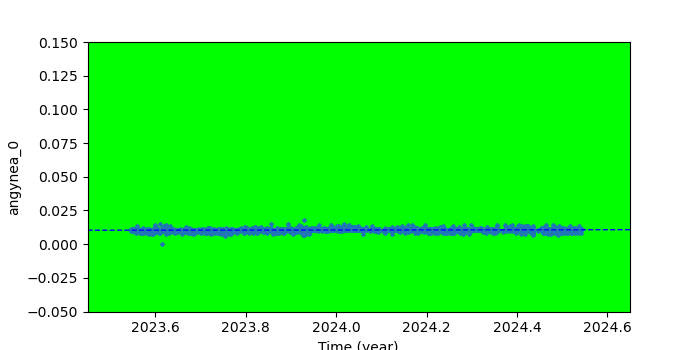
Slope: 1.676e-06 STD: 1.226e-03
|
Slope: -3.290e-06 STD: 2.715e-02
|
| 1 |

Slope: na STD: na
|
Slope: -3.720e-04 STD: 1.289e-01
|

Slope: 2.590e-06 STD: 1.296e-03
|

Slope: 1.838e-06 STD: 2.129e-03
|
| 2 |

Slope: nan STD: nan
|
Slope: -1.325e-04 STD: 9.896e-02
|

Slope: 1.230e-06 STD: 1.126e-03
|
Slope: 3.704e-06 STD: 2.048e-03
|
| 3 |
Slope: 1.628e-04 STD: 3.774e-01
|
Slope: -6.476e-06 STD: 4.626e-02
|

Slope: 4.549e-06 STD: 8.050e-03
|
Slope: 1.130e-06 STD: 1.652e-03
|
| 4 |

Slope: 1.942e-05 STD: 3.862e-01
|
Slope: 1.116e-05 STD: 2.782e-02
|

Slope: 1.090e-06 STD: 9.284e-03
|
Slope: -2.023e-05 STD: 8.661e-03
|
| 5 |

Slope: 5.518e-05 STD: 3.815e-01
|
Slope: 2.591e-05 STD: 2.620e-02
|
Slope: -6.387e-07 STD: 1.112e-02
|
Slope: -2.377e-05 STD: 1.034e-02
|
| 6 |

Slope: 1.812e-04 STD: 3.943e-01
|

Slope: 1.470e-05 STD: 2.851e-02
|
Slope: -7.840e-06 STD: 1.406e-02
|
Slope: -2.147e-05 STD: 1.248e-02
|
| 7 |
Slope: -1.723e-04 STD: 3.919e-01
|

Slope: 9.479e-06 STD: 2.662e-02
|
Slope: -3.290e-06 STD: 2.715e-02
|
Slope: -2.787e-05 STD: 1.602e-02
|
The following links open a page showing the trends of fid lights of the year or the month.
)
)
)
)
)
)
)
)
)
)
)
)
)
)
)
)
)
)
)
)
)
)
)
)
)
)
)
)
)
)
)
)
)
)
)
)
)
)
)
)
)
)
)
)
)
)
)
)
)
)
)
)
)
)
)
)
)
)
)
)
)
)
)
)
)
)
)
)
)
)
)
)
)
)
)
)
)
)
)
)
)
)
)
)
)
)
)
)
)
)
)
)