ACIS and HRC Celestial Location Monitoring
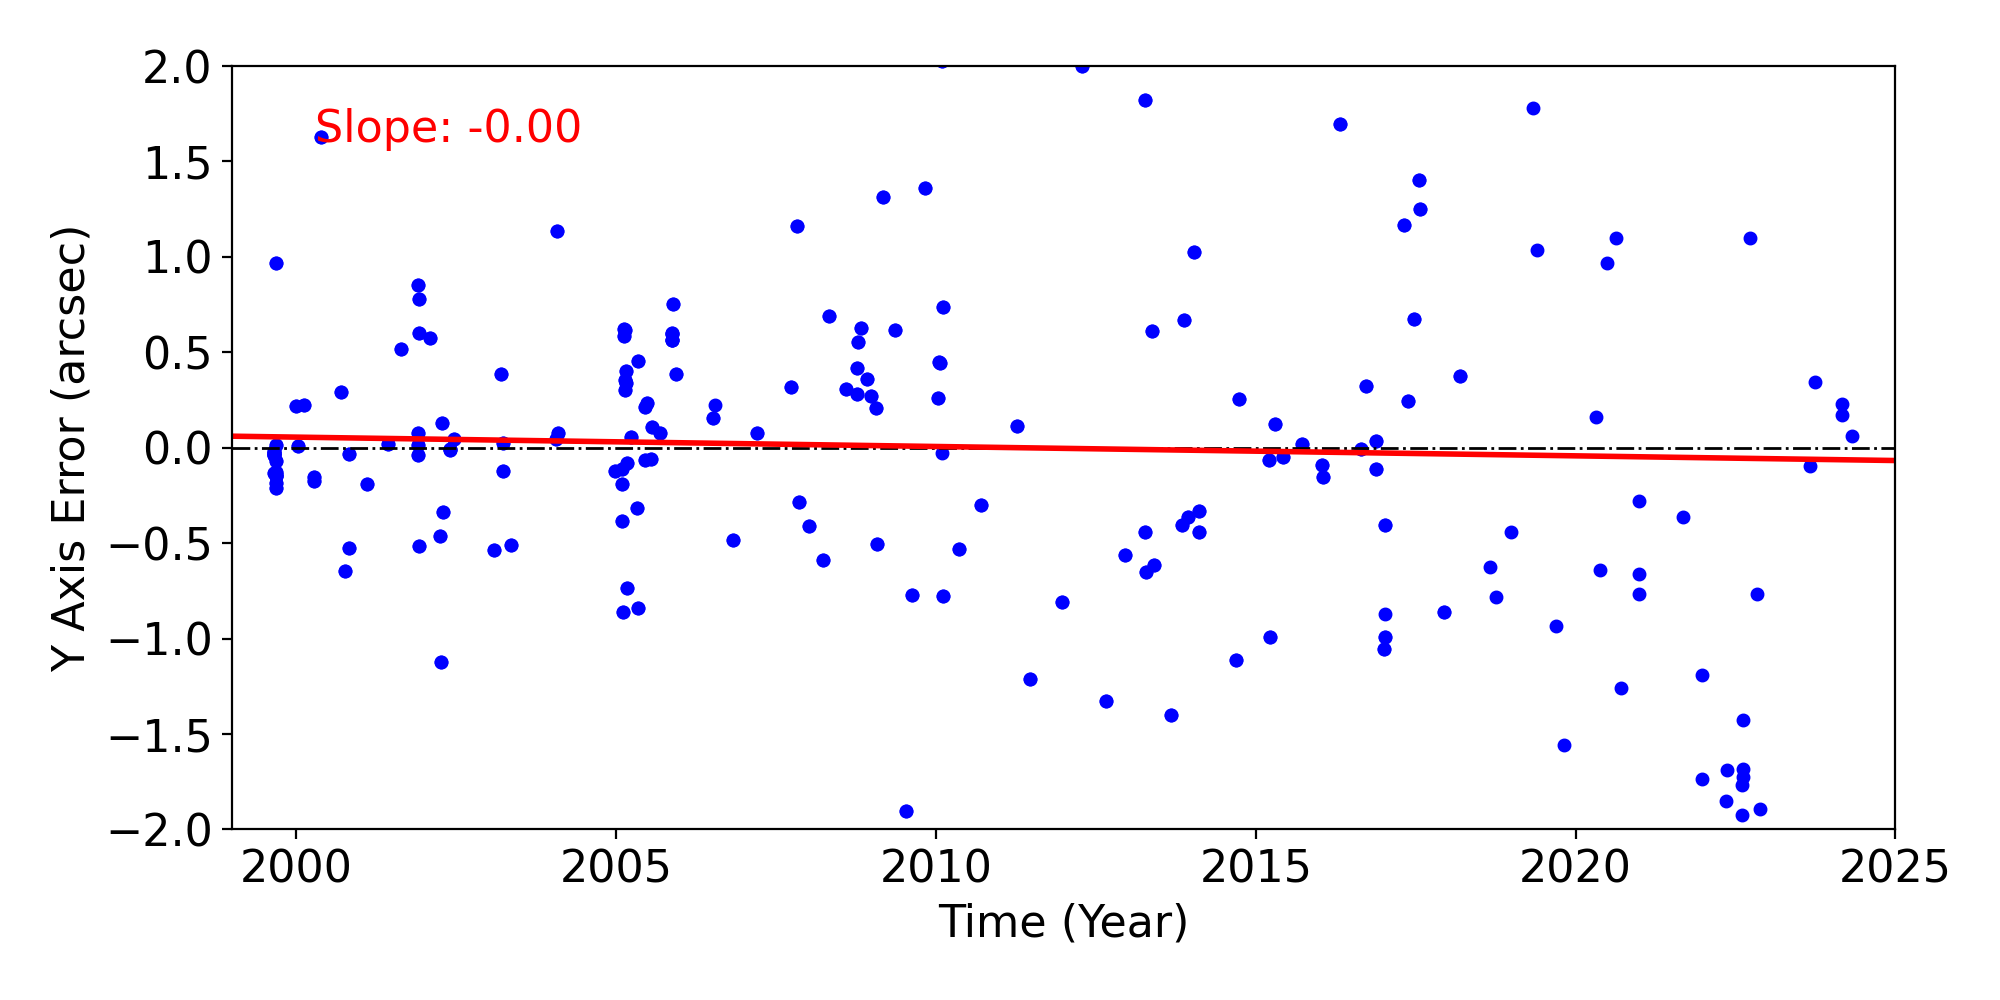
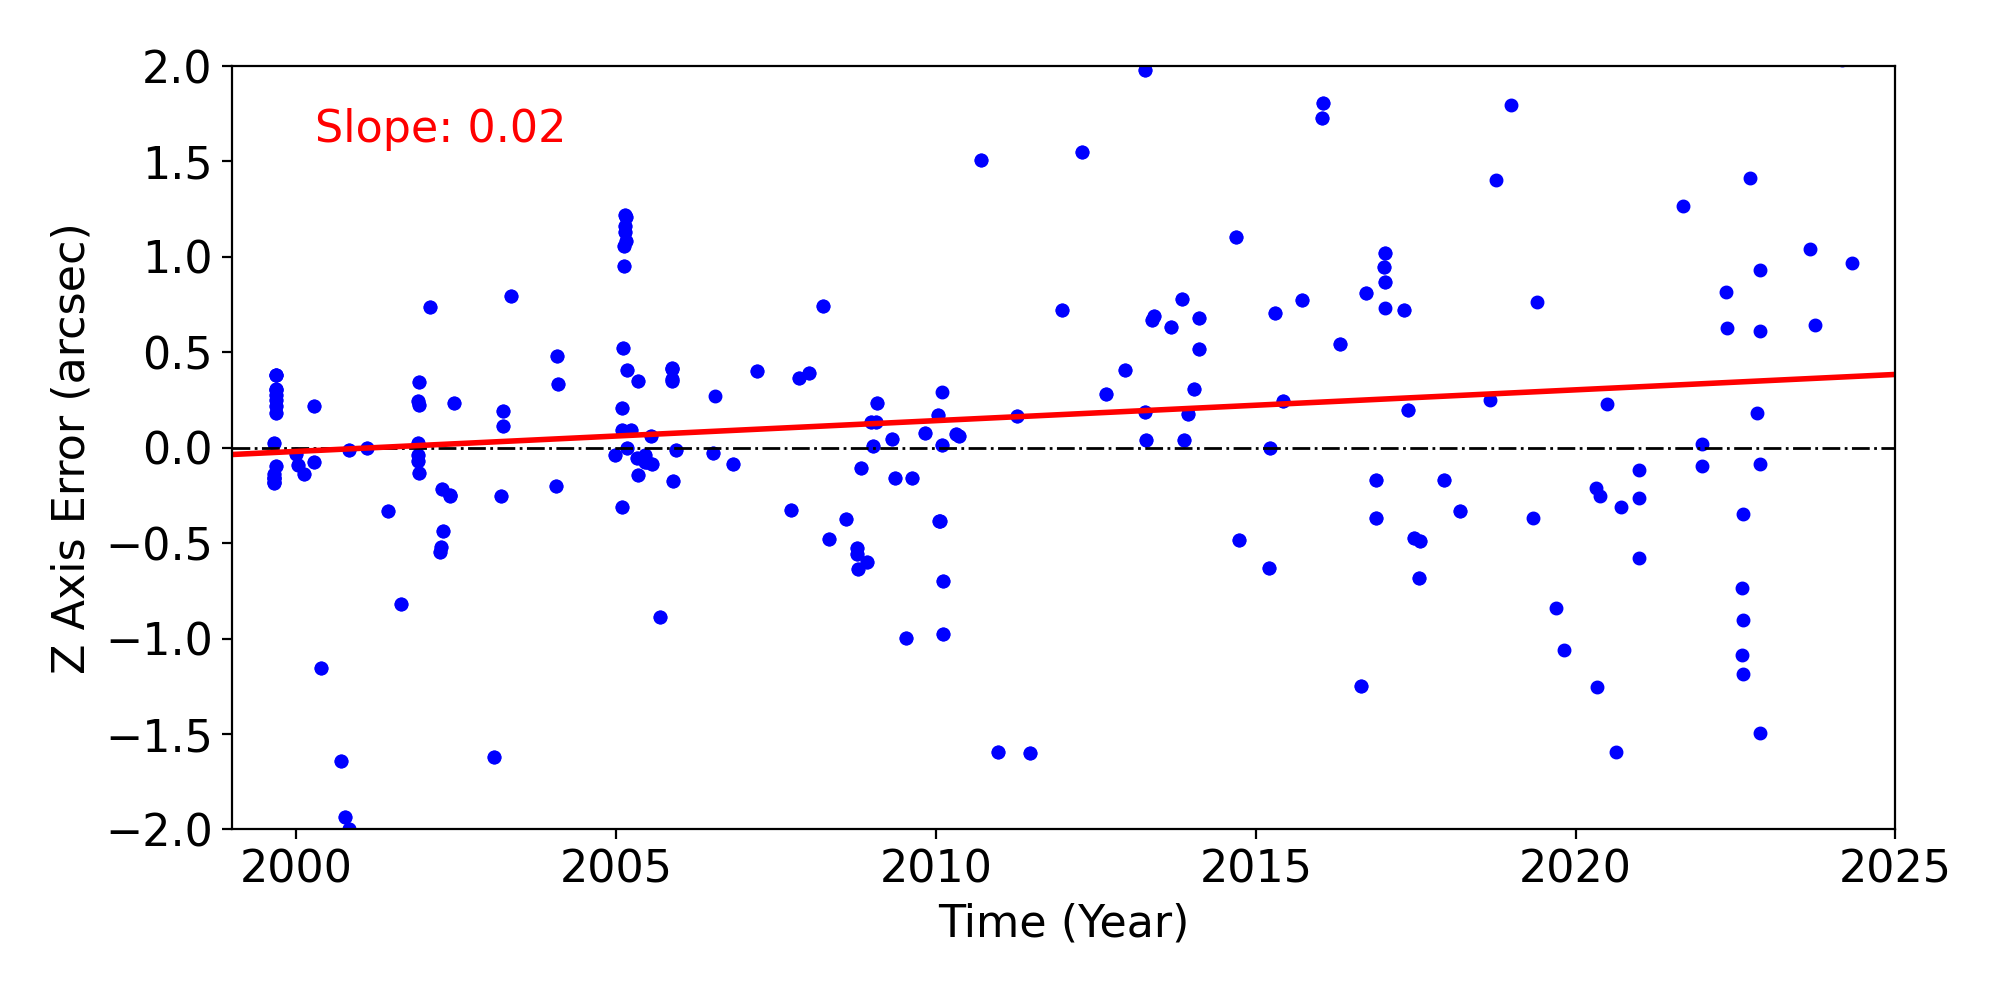
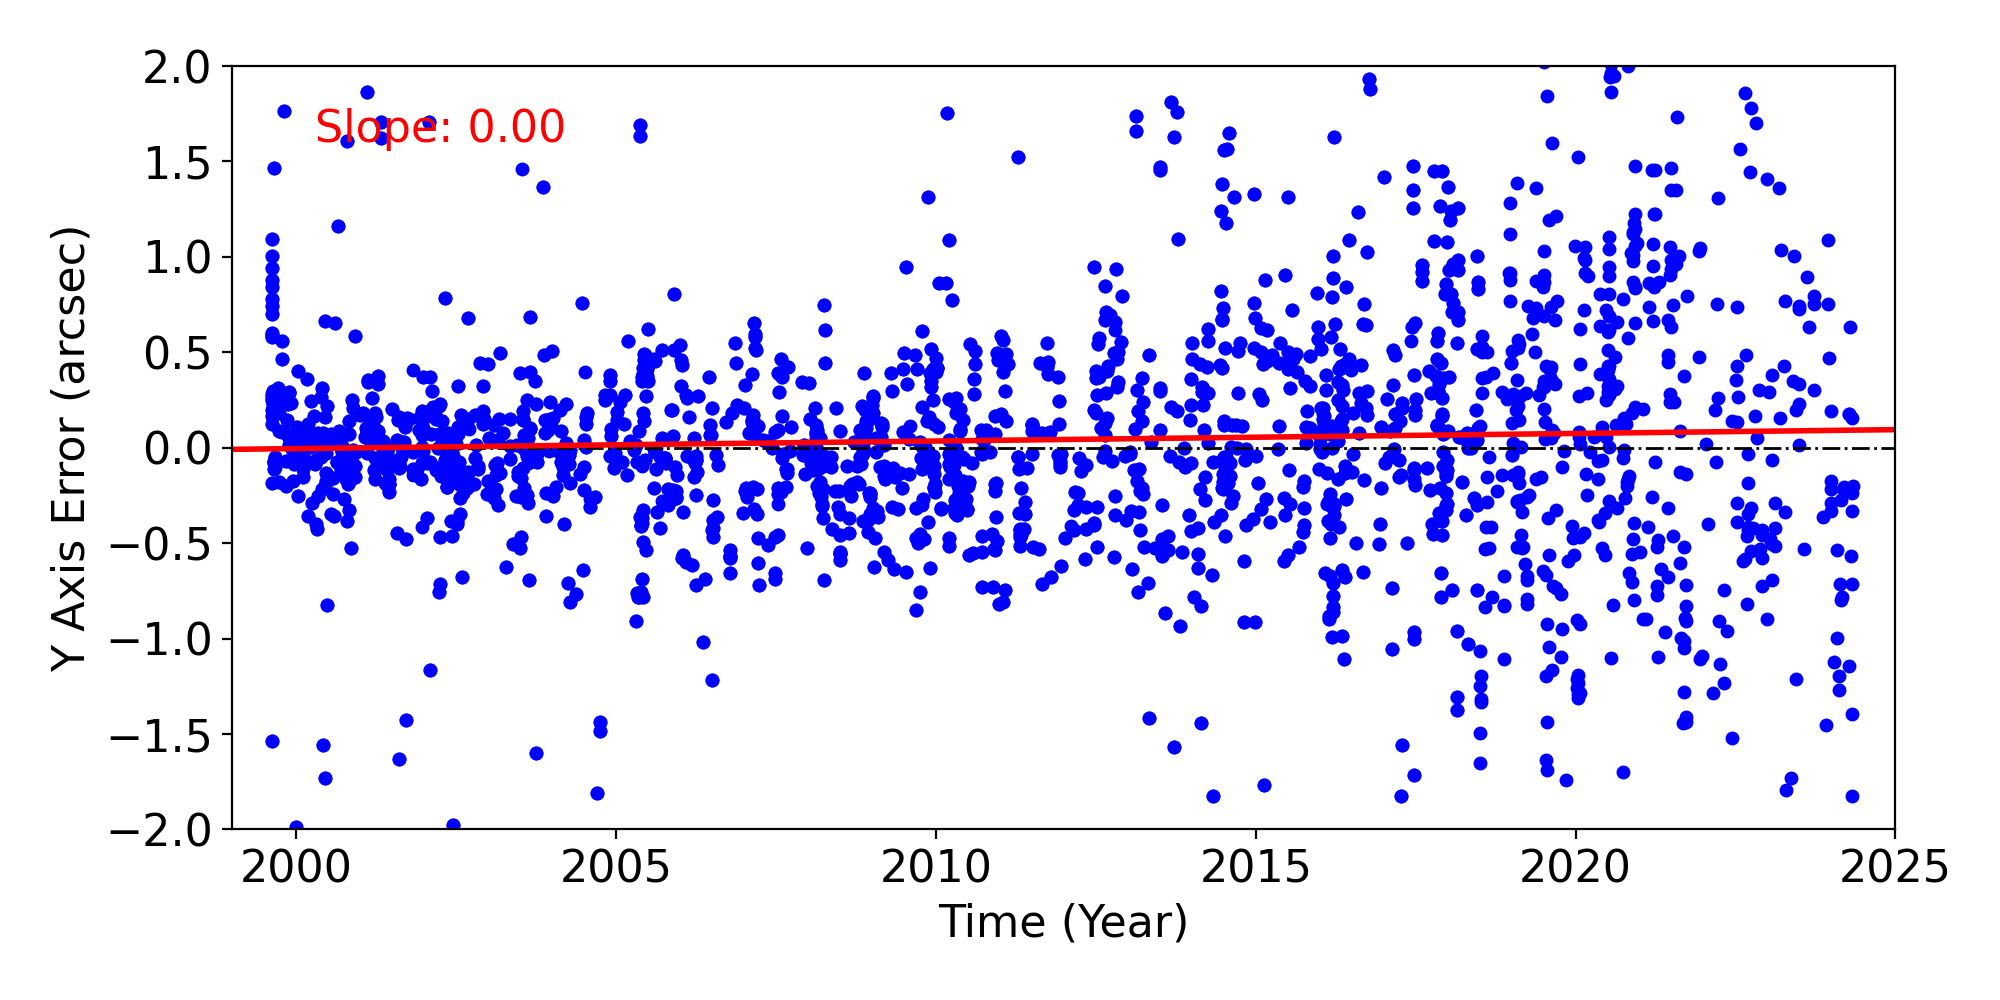
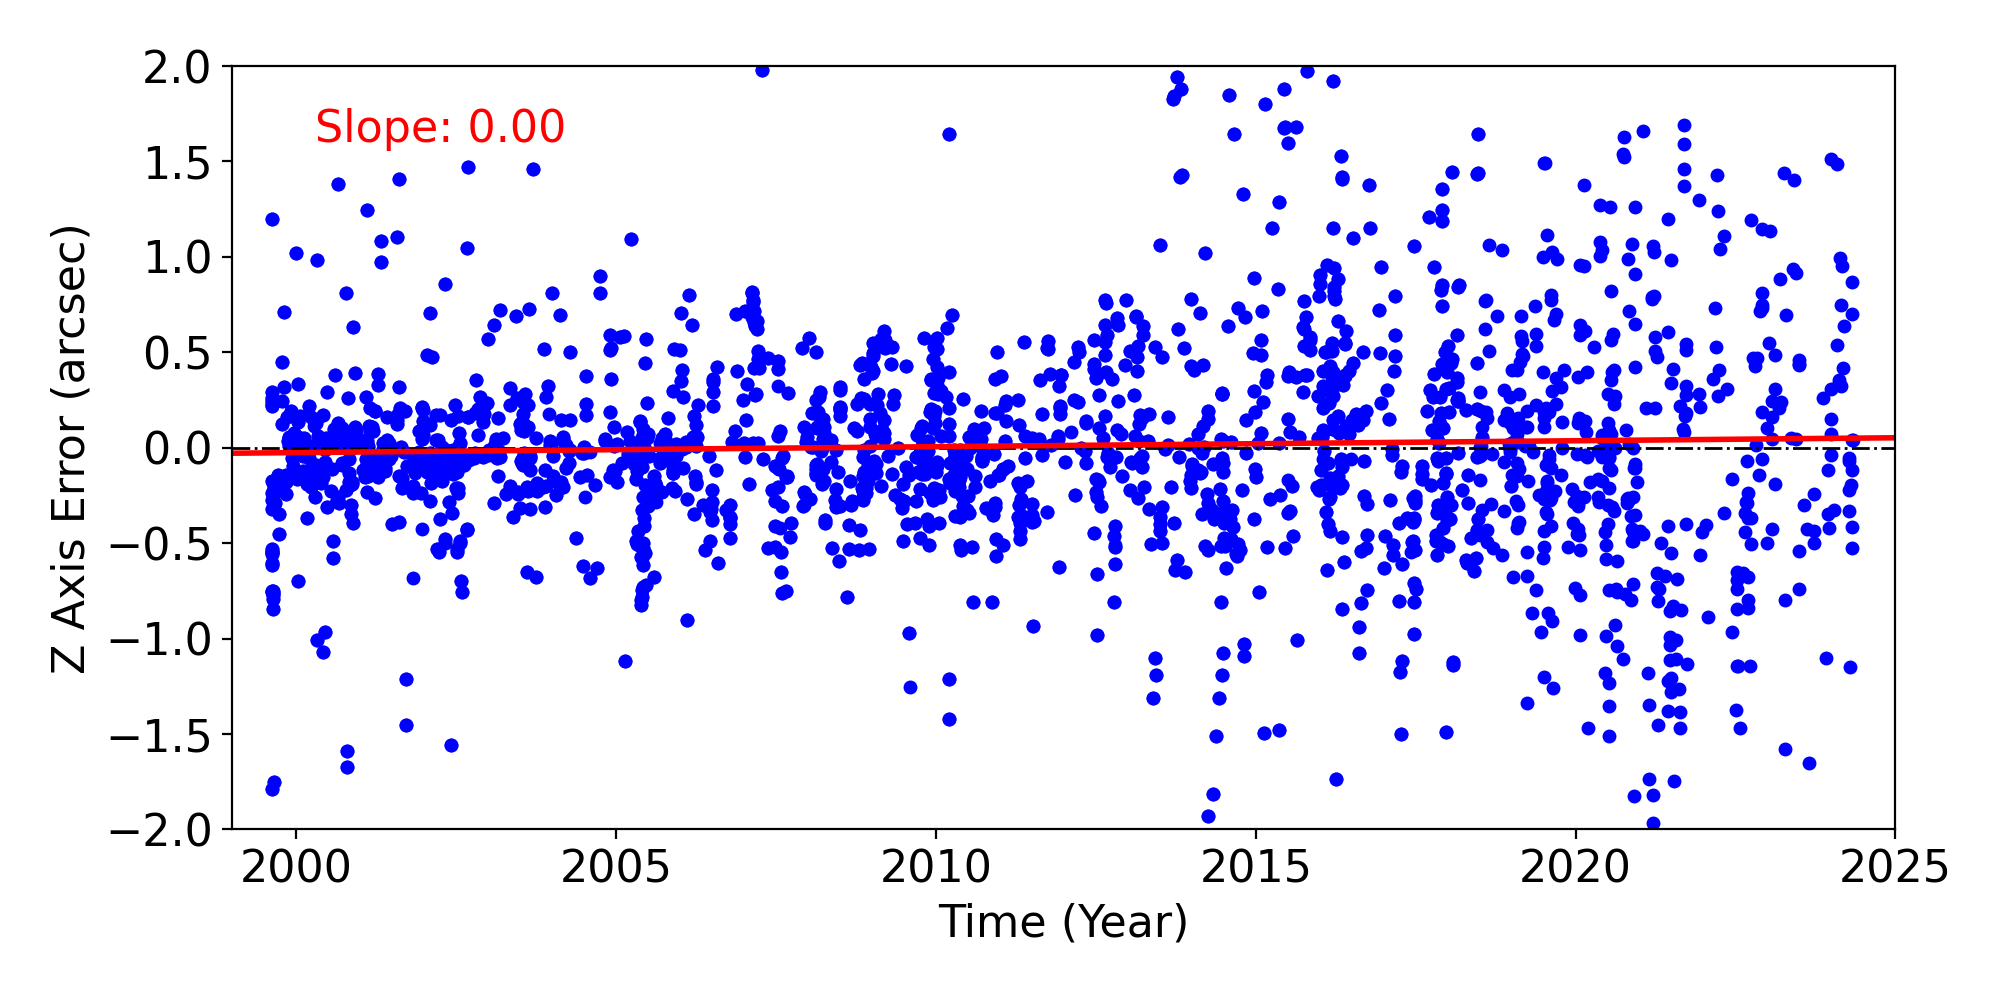
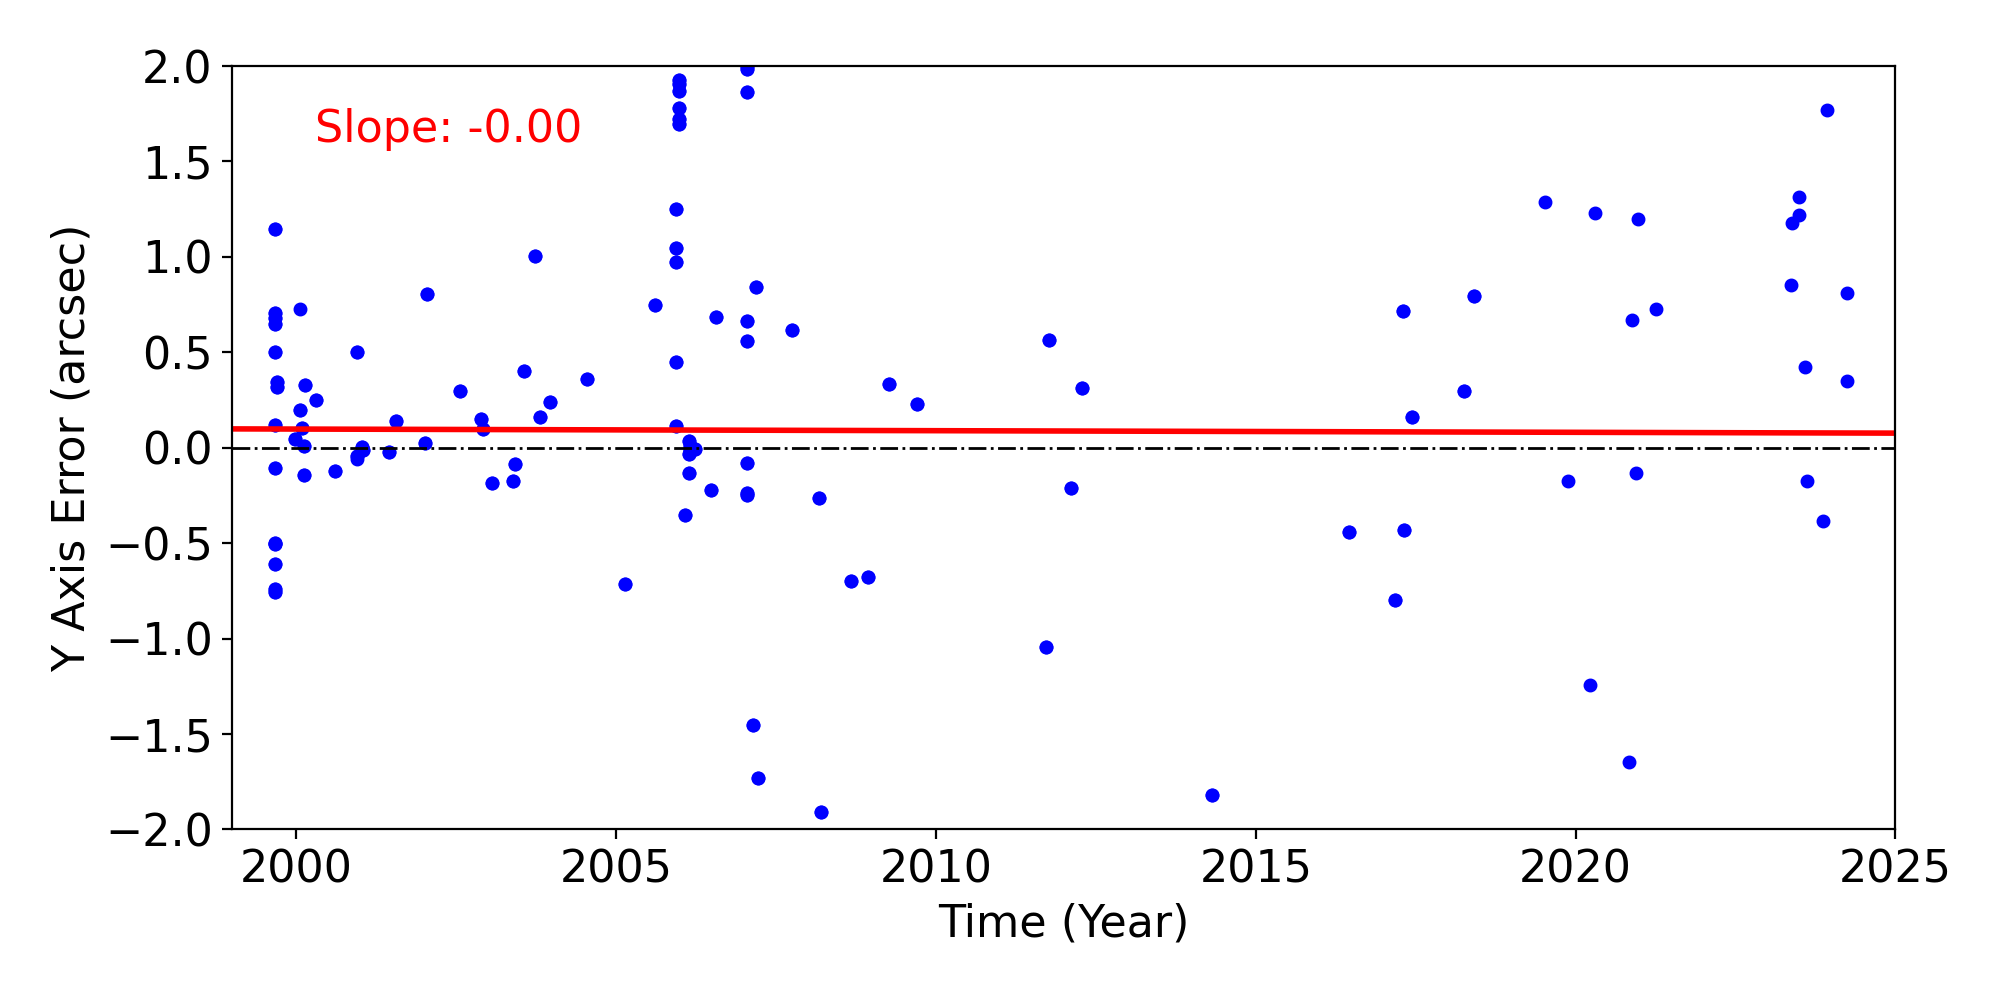
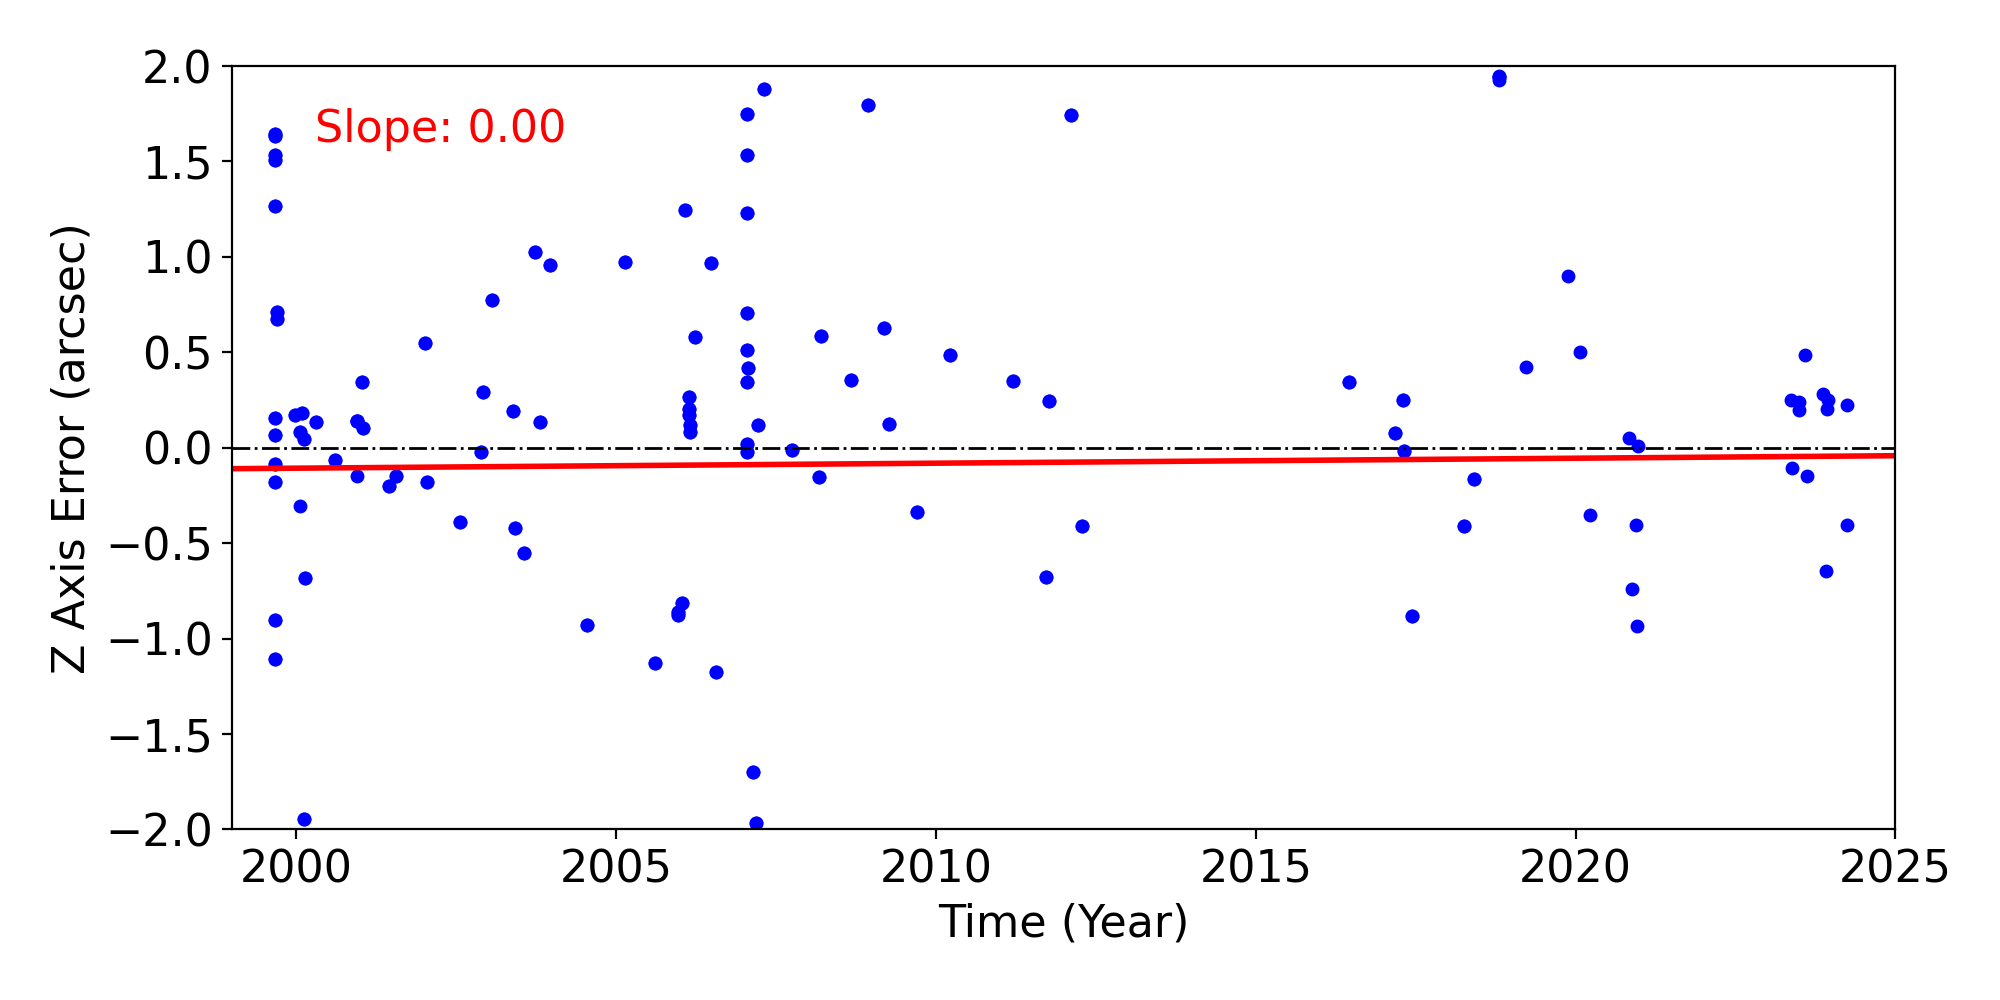
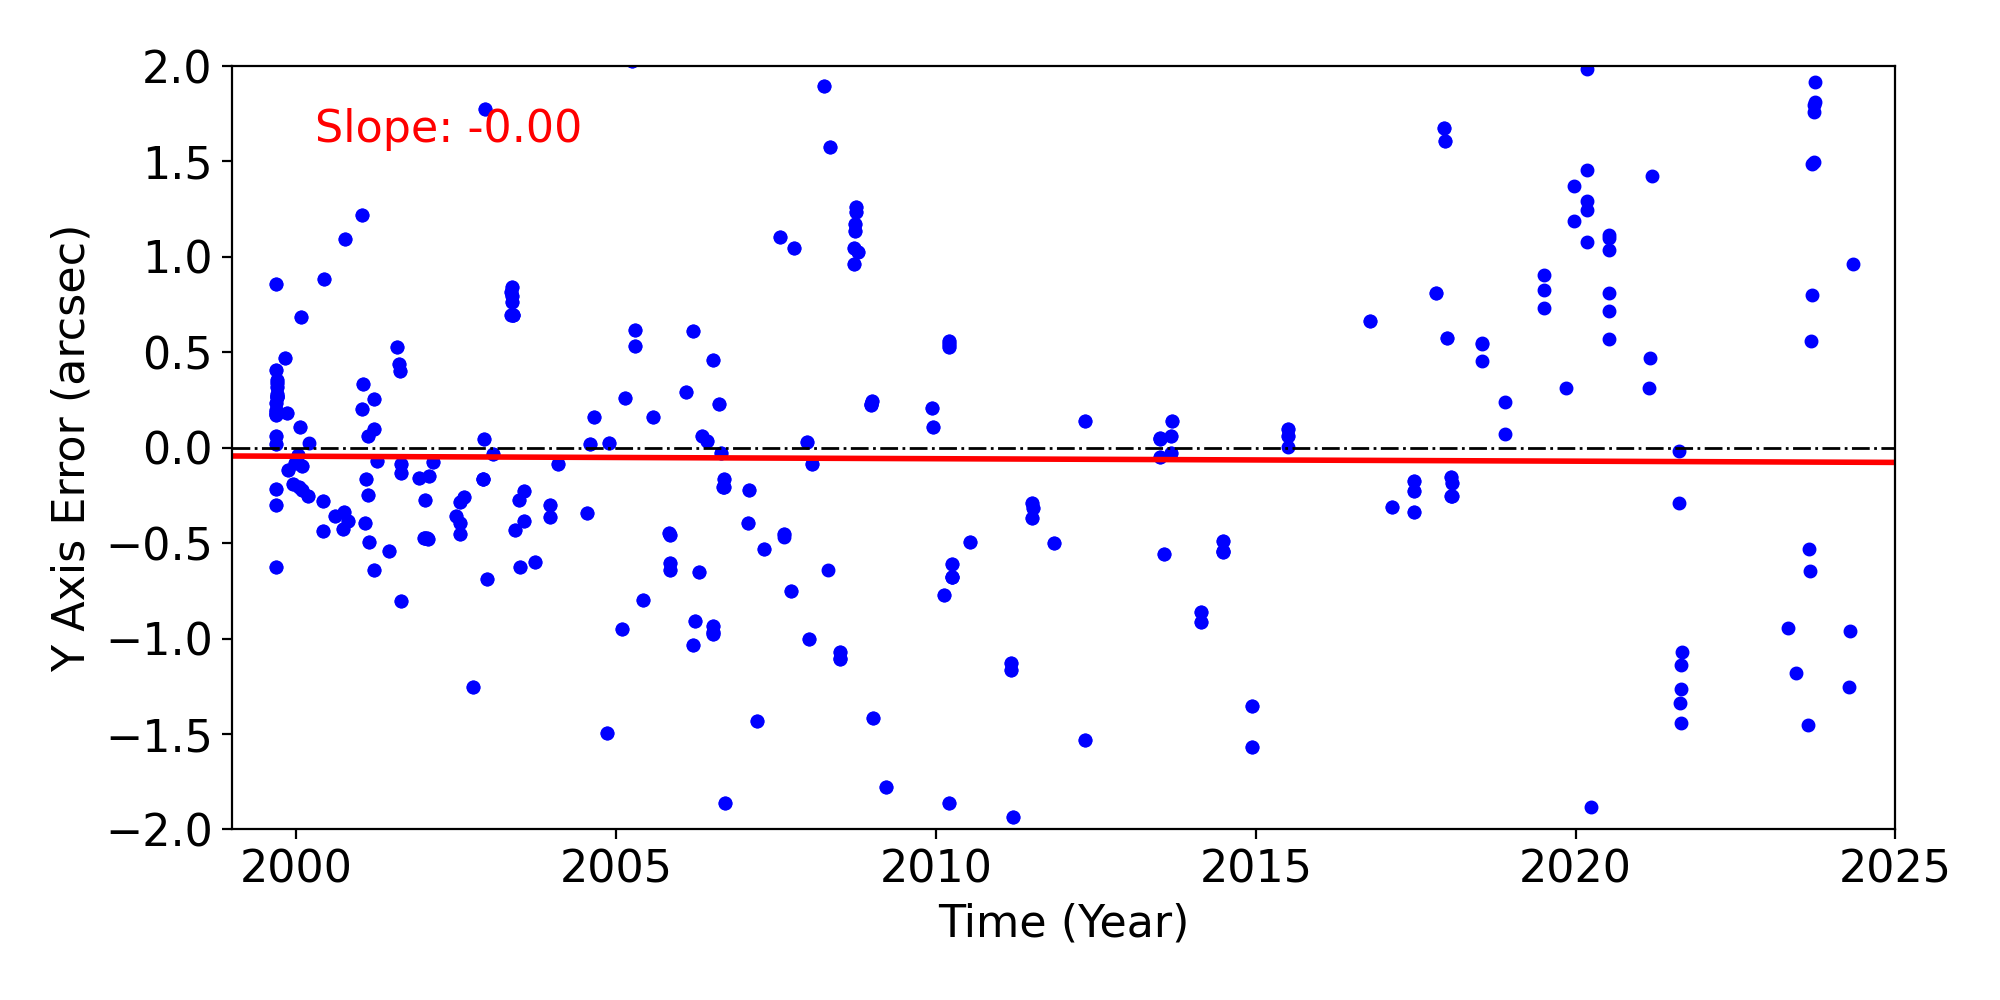
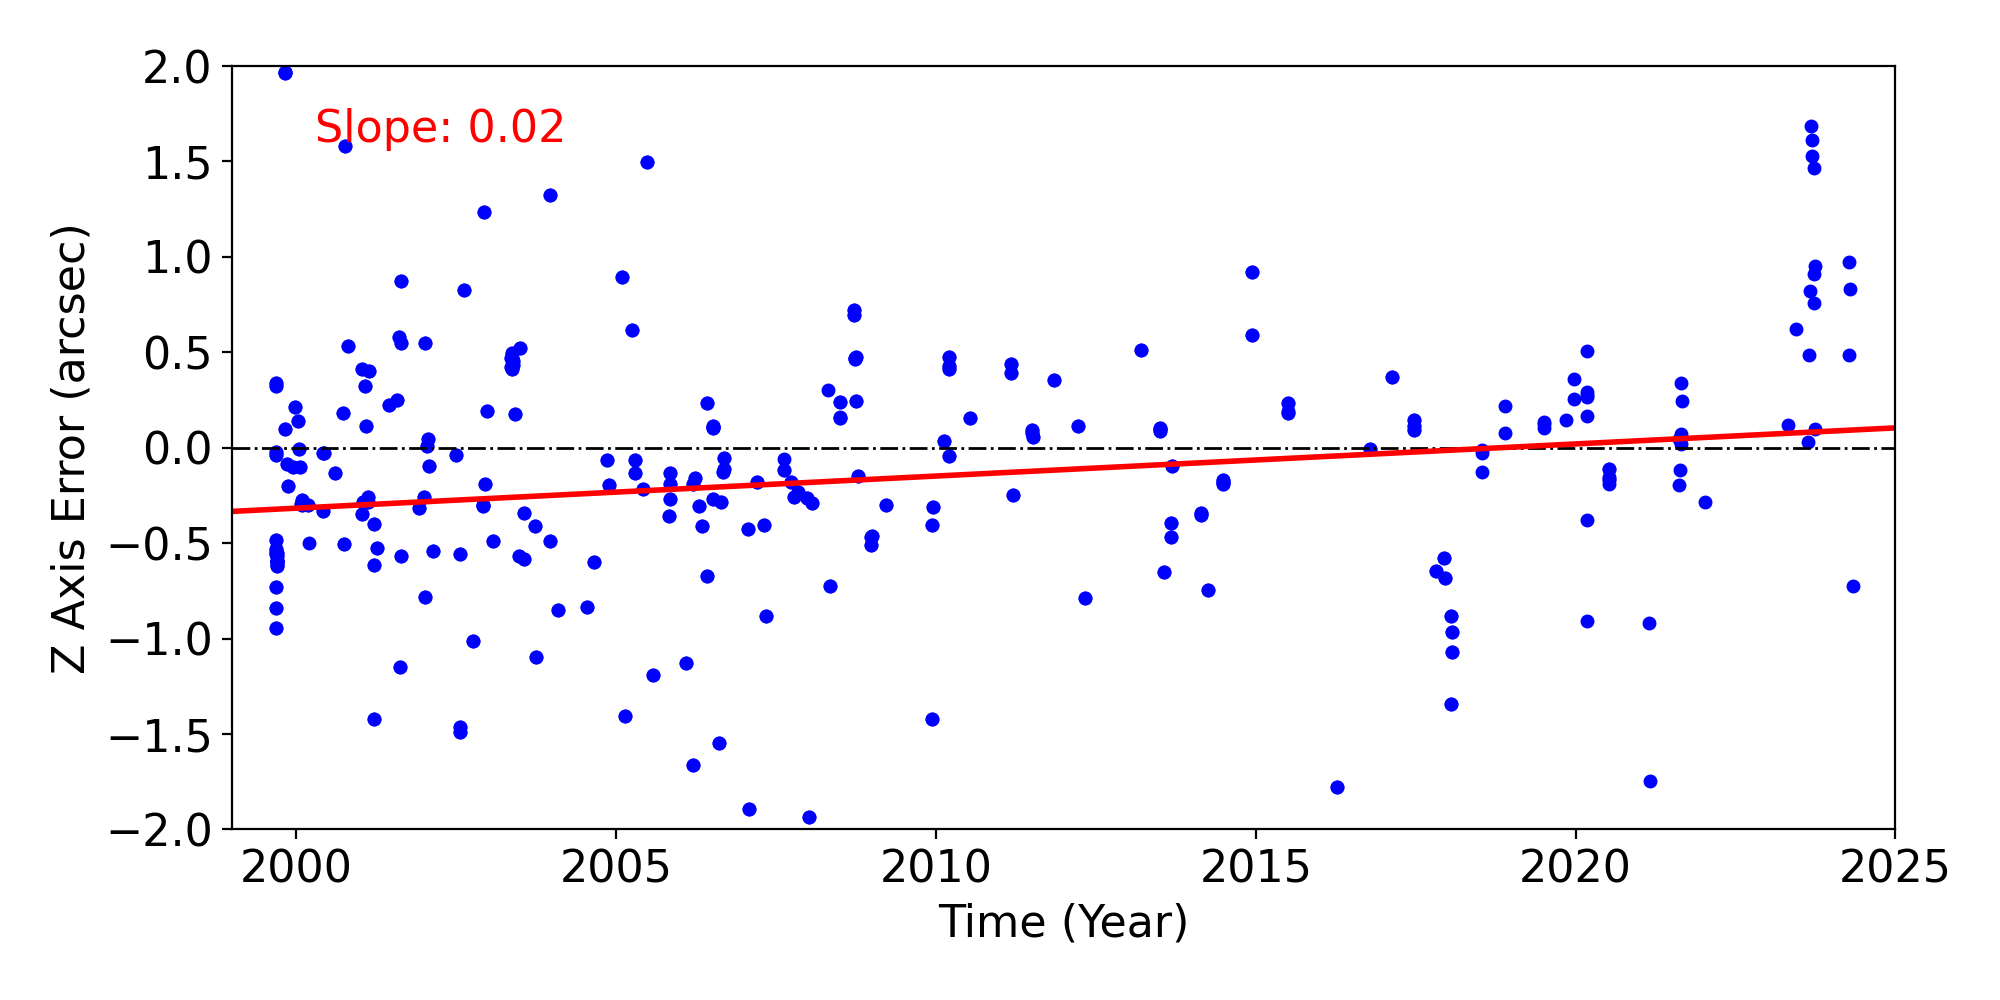
The following plots are the differences between coordinates obtained from Chandra observations and
those obtained from existing catalogs vs time in day of mission.
The following steps are taken to generate these plots
-
Check all Chndra observations and select those which are point sources (usually the next step tells
whether the source is a point source or not by the accuracy of the coordinates of the source).
-
nind coordinates for each observation from SIMBAD.
If the coordinates information is given at three decimal accuracy, we use the observation.
Otherwise it is dropped from the further process. The source of the coordinates in
SIMBAD varies but many are from Hipparcos
(an example output of
Capella).
-
Using a ciao wavdetect function,
find source positions. We assume that the brightest object detected is the target source.
-
Compare those to the coordinates from the SIMBAD.
Take the differences between the coordinates obtained from cell detect and those from the
SIMBAD, then convert del(dec) and del(ra) into detector
coordinates using the roll angle.
Following plots are the time trends of the variations of differences between the expected source
positions and the observed source positions in the detector coordinates.
Click a plot to enlarge the plot. If you like to see the ascii data table, click the detector
name on the left.
If you have any quesitons about this page, please contact swolk@cfa.harvard.edu.
Last Modified: May 13, 2019
