| Science Run Stop: | 2000:11:26:19:46 |
| Science Run Start: | 2000:11:28:10:00 |
| Interruption: | 137.0ks |
| Triggered by: | auto |
Go to:
ACE Plot (E38/E175, P47/P112/P310/P761/P1060, Anisotopy)
EPHIN Plot (P4/P41/E1300)
GOES-11 Plot (P1/P2/P5)
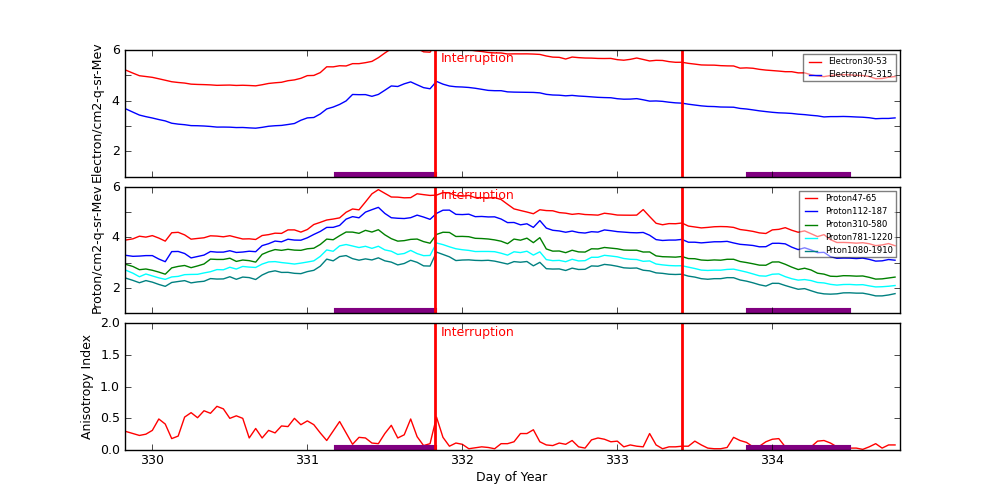
ACE radiation data are plotted around periods when science runs were interrupted. Plots start exactly 2 days before the interruption started. The top panel shows differential fluxes of electrons 38-53 and 175-315 (particles/cm2-s-ster-MeV), the middle panel shows differential fluxes of protons 47-65, 112-187, and 310-580 (particles/cm2-s-ster-MeV), and the bottom panel shows anisotropy ratio. The original data are prepared by the U.S. Dept. of Commerce, NOAA, Space Environment Center.
Data Period  (dom): 329.8236 - 334.8236
Interruption (dom): 331.8236 - 333.4167
			Avg		 Max		Time	Min		Time		Value at Interruption Started
--------------------------------------------------------------------------------------------------------------------------
e38 		3.659e+05+/-3.692e+05	1.910e+06	331.833 	3.840e+04	330.667		8.950e+04
e175		1.139e+04+/-1.267e+04	5.750e+04	331.833 	8.160e+02	330.667		2.080e+03
p47 		1.137e+05+/-1.679e+05	7.670e+05	331.458 	4.660e+03	334.792		4.660e+03
p112		2.353e+04+/-3.140e+04	1.530e+05	331.458 	1.090e+03	330.083		1.250e+03
p310		4.155e+03+/-4.657e+03	2.000e+04	331.458 	2.240e+02	334.667		2.690e+02
p761		1.392e+03+/-1.341e+03	5.990e+03	331.833 	1.100e+02	334.667		1.250e+02
p1060		5.681e+02+/-5.116e+02	2.610e+03	331.833 	4.870e+01	334.667		5.970e+01
anisotropy	1.966e-01+/-1.678e-01	6.900e-01	330.417 	1.000e-02	334.583		8.000e-02

Hardness:
e38/e175	3.810e+01+/-7.388e+00	5.368e+01	330.875 	1.651e+01	331.292		4.303e+01
p47/p1060	1.497e+02+/-1.261e+02	6.506e+02	331.750 	3.012e+01	330.750		7.806e+01
p112/p1060	3.174e+01+/-1.910e+01	9.871e+01	331.458 	8.042e+00	329.833		2.094e+01
p310/p1060	6.204e+00+/-2.028e+00	1.340e+01	331.375 	2.867e+00	329.958		4.506e+00
p761/p1060	2.328e+00+/-2.819e-01	3.160e+00	331.333 	1.594e+00	330.167		2.094e+00

Steepest Rise
------------
	Time		Slope(in log per hr)
----------------------------------------
e1  	331.6250		155498.7560
e175	331.4583		4535.9637
p47 	331.2500		73489.4121
p112	331.2500		13999.8880
p310	331.2500		1627.9870
p761	331.0417		419.9966
p1060	331.0417		148.7988
Two vertical red lines indicate the start and the end of the interruption. Purple hatched areas indicate that the satellite is in the radiation belt.
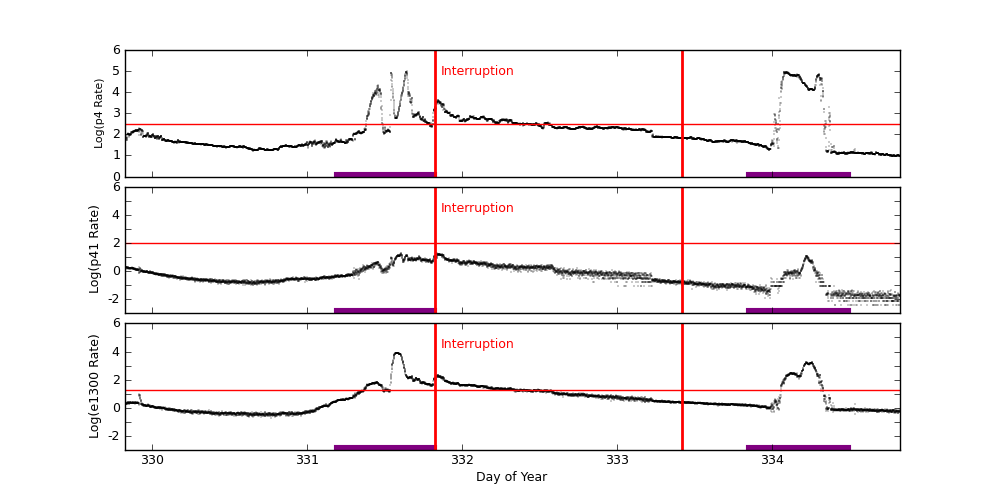
EPHIN Data are used to trigger science run interruptions. The trigger levels are:
| P4 | 300 | Counts/cm2 sec sr MeV |
| P41 | 10 | Counts/cm2 sec sr MeV |
| E1300 | 20 | Counts/cm2 sec sr MeV |
		Avg			Max		Time		Min		Time		Value at Interruption Started
--------------------------------------------------------------------------------------------------------------------------
p4	3.186e+03 +/- 1.257e+04		9.713e+04	331.640		8.482e+00	334.944		1.767e+03
p41	1.419e+00 +/- 2.535e+00		1.965e+01	331.604		1.000e-04	333.199		1.177e+01
e1300	1.174e+02 +/- 7.075e+02		7.675e+03	331.577		1.972e-01	330.764		1.176e+02
Two vertical red lines indicate the start and the end of the interruption. Red horizontal lines indicate SCS 107 limits. Purple hatched areas indicate that the satellite is in the radiation belt.
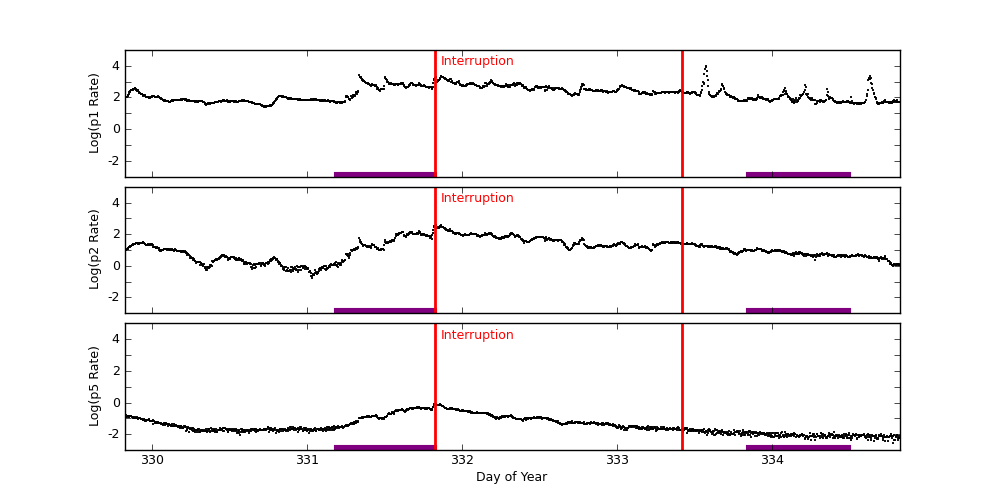
GOES-11 data are taken from NOAA site (http://goes.ngdc.noaa.gov).
| P1 | .8 - 4.0 | MeV protons (Counts/cm2 sec sr MeV) Uncorrected |
| P2 | 4.0 - 9.0 | MeV protons (Counts/cm2 sec sr MeV) Uncorrected |
| P5 | 40.0 - 80.0 | MeV protons (Counts/cm2 sec sr MeV) Uncorrected |
		Avg			Max		Time		Min		Time		Value at Interruption Started
--------------------------------------------------------------------------------------------------------------------------
p1	3.148e+02 +/- 5.215e+02		9.820e+03	333.573		2.620e+01	330.722		1.600e+03
p2	3.006e+01 +/- 4.819e+01		4.050e+02	331.833		1.810e-01	331.028		3.230e+02
p5	8.173e-02 +/- 1.300e-01		8.470e-01	331.819		2.940e-03	334.781		7.850e-01
Two vertical red lines indicate the start and the end of the interruption. Red horizontal lines indicate SCS 107 limits. Purple hatched areas indicate that the satellite is in the radiation belt.