| Science Run Stop: | 2001:04:08:04:40 |
| Science Run Start: | 2001:04:09:14:28 |
| Interruption: | 121.0ks |
| Triggered by: | manual |
Go to:
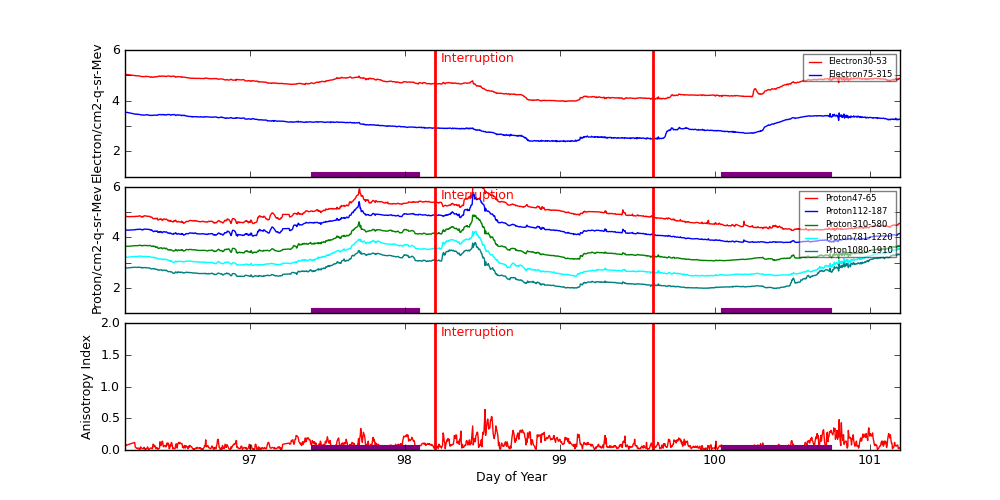
ACE Plot (E38/E175, P47/P112/P310/P761/P1060, Anisotopy)
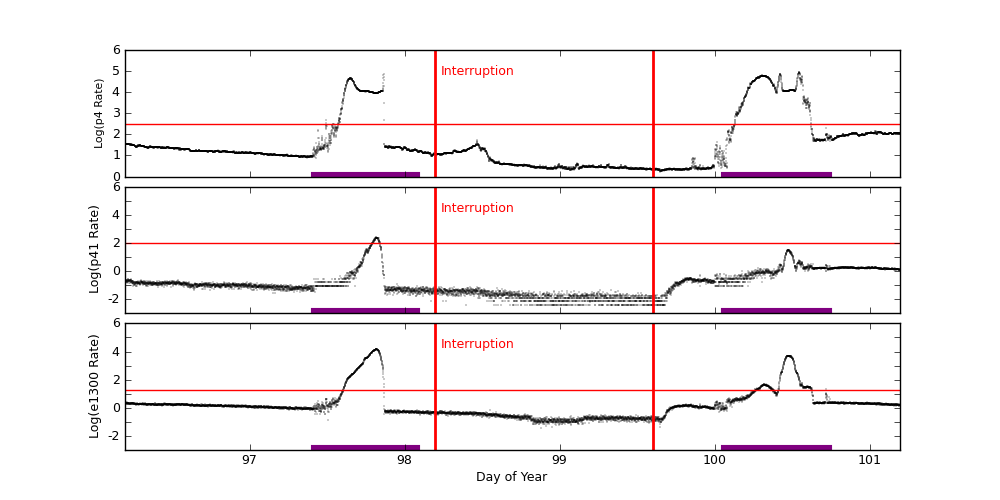
EPHIN Plot (P4/P41/E1300)
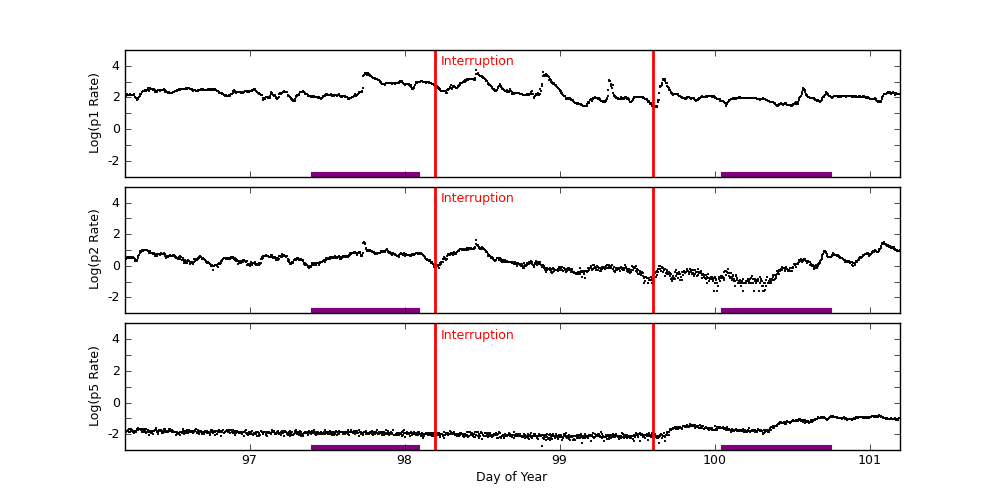
GOES-11 Plot (P1/P2/P5)
ACE radiation data are plotted around periods when science runs were interrupted. Plots start exactly 2 days before the interruption started. The top panel shows differential fluxes of electrons 38-53 and 175-315 (particles/cm2-s-ster-MeV), the middle panel shows differential fluxes of protons 47-65, 112-187, and 310-580 (particles/cm2-s-ster-MeV), and the bottom panel shows anisotropy ratio. The original data are prepared by the U.S. Dept. of Commerce, NOAA, Space Environment Center.
Data Period  (dom): 96.1944 - 101.1944
Interruption (dom): 98.1944 - 99.6028
			Avg		 Max		Time	Min		Time		Value at Interruption Started
--------------------------------------------------------------------------------------------------------------------------
e38 		4.615e+04+/-2.702e+04	1.140e+05	96.194 	9.200e+03	99.035		7.470e+04
e175		1.278e+03+/-8.221e+02	3.490e+03	96.194 	2.370e+02	99.035		1.860e+03
p47 		1.225e+05+/-1.670e+05	1.650e+06	98.444 	1.850e+04	100.604		3.500e+04
p112		3.414e+04+/-4.913e+04	5.230e+05	98.444 	6.180e+03	100.340		1.420e+04
p310		6.453e+03+/-9.011e+03	7.600e+04	98.448 	1.170e+03	99.996		4.650e+03
p761		1.870e+03+/-2.336e+03	1.740e+04	98.458 	2.850e+02	99.104		3.460e+03
p1060		7.132e+02+/-8.430e+02	6.290e+03	98.455 	9.520e+01	100.382		2.140e+03
anisotropy	9.986e-02+/-8.201e-02	6.400e-01	98.517 	1.000e-02	96.288		4.000e-02

Hardness:
e38/e175	3.839e+01+/-1.204e+01	7.364e+01	98.434 	1.881e+01	99.705		4.016e+01
p47/p1060	2.959e+02+/-2.730e+02	1.232e+03	98.785 	1.358e+01	101.167		1.636e+01
p112/p1060	6.528e+01+/-4.046e+01	1.826e+02	98.785 	5.642e+00	101.167		6.636e+00
p310/p1060	1.037e+01+/-3.711e+00	1.808e+01	98.549 	2.041e+00	101.170		2.173e+00
p761/p1060	2.759e+00+/-5.479e-01	4.551e+00	98.517 	1.304e+00	100.694		1.617e+00

Steepest Rise
------------
	Time		Slope(in log per hr)
----------------------------------------
e1  	96.2465		116280.6546
e175	96.2500		3552.0200
p47 	98.4271		1533608.6340
p112	98.4271		482402.7158
p310	98.4306		59760.3364
p761	98.4201		10452.0588
p1060	98.4340		3696.0208
Two vertical red lines indicate the start and the end of the interruption. Purple hatched areas indicate that the satellite is in the radiation belt.
EPHIN Data are used to trigger science run interruptions. The trigger levels are:
| P4 | 300 | Counts/cm2 sec sr MeV |
| P41 | 10 | Counts/cm2 sec sr MeV |
| E1300 | 20 | Counts/cm2 sec sr MeV |
		Avg			Max		Time		Min		Time		Value at Interruption Started
--------------------------------------------------------------------------------------------------------------------------
p4	3.187e+03 +/- 1.055e+04		8.689e+04	100.543		1.717e+00	99.649		1.187e+01
p41	2.746e+00 +/- 1.814e+01		2.636e+02	97.817		1.000e-04	97.415		4.012e-02
e1300	2.406e+02 +/- 1.369e+03		1.470e+04	97.815		3.792e-02	98.878		4.399e-01
Two vertical red lines indicate the start and the end of the interruption. Red horizontal lines indicate SCS 107 limits. Purple hatched areas indicate that the satellite is in the radiation belt.
GOES-11 data are taken from NOAA site (http://goes.ngdc.noaa.gov).
| P1 | .8 - 4.0 | MeV protons (Counts/cm2 sec sr MeV) Uncorrected |
| P2 | 4.0 - 9.0 | MeV protons (Counts/cm2 sec sr MeV) Uncorrected |
| P5 | 40.0 - 80.0 | MeV protons (Counts/cm2 sec sr MeV) Uncorrected |
		Avg			Max		Time		Min		Time		Value at Interruption Started
--------------------------------------------------------------------------------------------------------------------------
p1	3.452e+02 +/- 5.368e+02		5.250e+03	98.458		2.520e+01	99.608		5.410e+02
p2	3.300e+00 +/- 4.202e+00		4.390e+01	98.458		2.580e-02	99.997		8.770e-01
p5	2.610e-02 +/- 3.237e-02		1.530e-01	101.062		1.800e-03	98.882		1.170e-02
Two vertical red lines indicate the start and the end of the interruption. Red horizontal lines indicate SCS 107 limits. Purple hatched areas indicate that the satellite is in the radiation belt.