| Science Run Stop: | 2001:11:23:01:45 |
| Science Run Start: | 2001:11:25:16:30 |
| Interruption: | 166.6ks |
| Triggered by: | auto |
Go to:
ACE Plot (E38/E175, P47/P112/P310/P761/P1060, Anisotopy)
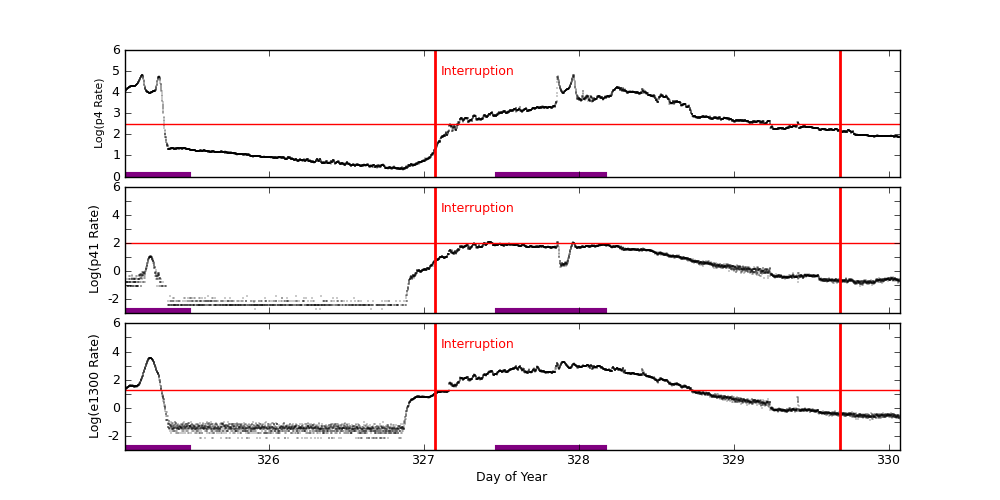
EPHIN Plot (P4/P41/E1300)
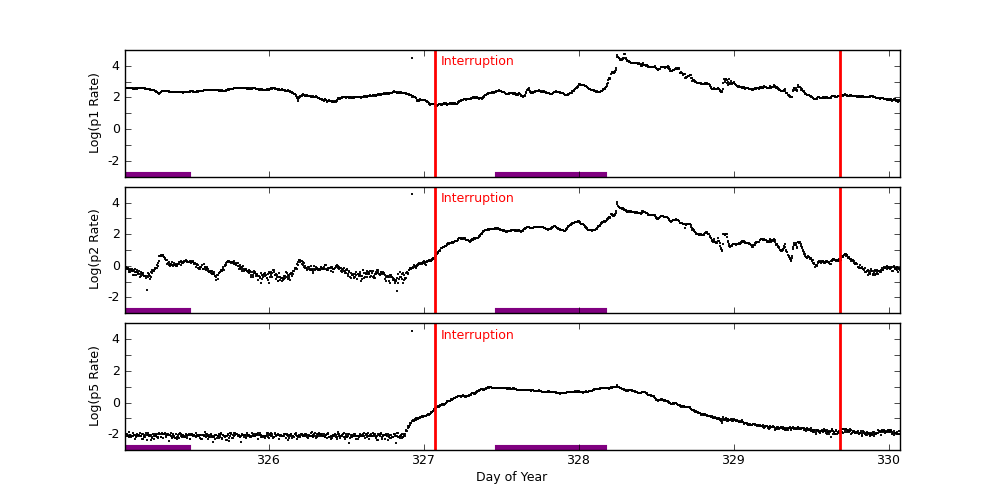
GOES-11 Plot (P1/P2/P5)
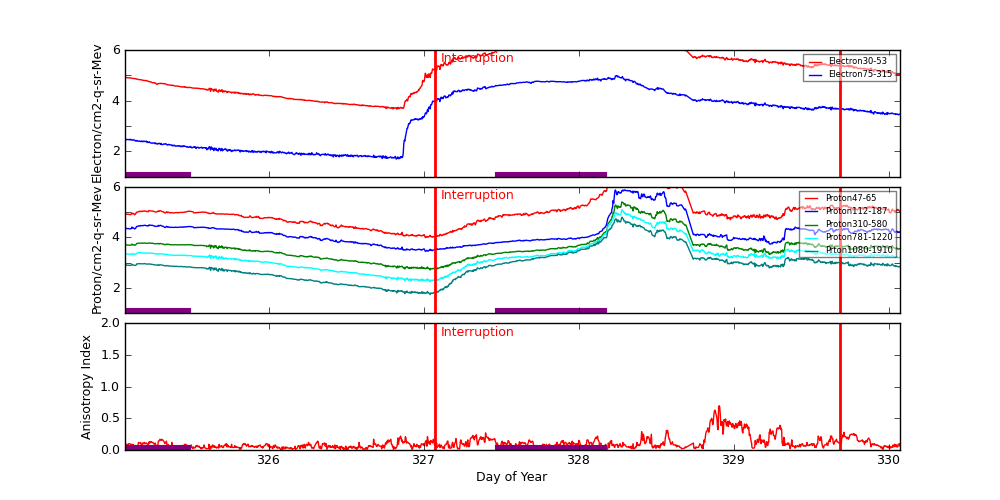
ACE radiation data are plotted around periods when science runs were interrupted. Plots start exactly 2 days before the interruption started. The top panel shows differential fluxes of electrons 38-53 and 175-315 (particles/cm2-s-ster-MeV), the middle panel shows differential fluxes of protons 47-65, 112-187, and 310-580 (particles/cm2-s-ster-MeV), and the bottom panel shows anisotropy ratio. The original data are prepared by the U.S. Dept. of Commerce, NOAA, Space Environment Center.
Data Period  (dom): 325.0729 - 330.0729
Interruption (dom): 327.0729 - 329.6875
			Avg		 Max		Time	Min		Time		Value at Interruption Started
--------------------------------------------------------------------------------------------------------------------------
e38 		7.813e+05+/-1.273e+06	7.040e+06	328.281 	4.570e+03	326.826		1.150e+05
e175		1.632e+04+/-2.270e+04	9.750e+04	328.247 	4.890e+01	326.823		2.900e+03
p47 		2.813e+05+/-6.267e+05	3.220e+06	328.420 	9.790e+03	327.010		1.070e+05
p112		5.300e+04+/-1.363e+05	7.450e+05	328.285 	2.810e+03	327.010		1.590e+04
p310		1.318e+04+/-3.409e+04	2.490e+05	328.278 	5.150e+02	327.042		3.540e+03
p761		6.260e+03+/-1.589e+04	1.220e+05	328.278 	1.760e+02	327.042		1.610e+03
p1060		3.232e+03+/-8.194e+03	6.180e+04	328.278 	5.490e+01	327.042		6.940e+02
anisotropy	1.092e-01+/-9.858e-02	7.000e-01	328.906 	1.000e-02	325.385		6.000e-02

Hardness:
e38/e175	9.056e+01+/-7.124e+01	2.907e+02	325.080 	1.065e+01	326.927		3.966e+01
p47/p1060	1.245e+02+/-5.006e+01	2.204e+02	329.868 	2.217e+01	328.278		1.542e+02
p112/p1060	2.576e+01+/-1.680e+01	6.175e+01	327.042 	2.145e+00	328.122		2.291e+01
p310/p1060	5.507e+00+/-2.514e+00	9.852e+00	326.969 	1.457e+00	328.135		5.101e+00
p761/p1060	2.337e+00+/-6.485e-01	3.378e+00	326.764 	1.120e+00	327.868		2.320e+00

Steepest Rise
------------
	Time		Slope(in log per hr)
----------------------------------------
e1  	328.2292		2567962.4112
e175	327.6910		62879.0796
p47 	328.2014		2578762.2532
p112	328.2188		793908.3791
p310	328.2188		173877.4549
p761	328.2188		71758.9496
p1060	328.2188		37319.4537
Two vertical red lines indicate the start and the end of the interruption. Purple hatched areas indicate that the satellite is in the radiation belt.
EPHIN Data are used to trigger science run interruptions. The trigger levels are:
| P4 | 300 | Counts/cm2 sec sr MeV |
| P41 | 10 | Counts/cm2 sec sr MeV |
| E1300 | 20 | Counts/cm2 sec sr MeV |
		Avg			Max		Time		Min		Time		Value at Interruption Started
--------------------------------------------------------------------------------------------------------------------------
p4	2.933e+03 +/- 7.506e+03		6.539e+04	325.183		2.085e+00	326.869		2.042e+01
p41	1.514e+01 +/- 2.592e+01		1.203e+02	327.422		1.000e-04	325.063		5.047e+00
e1300	1.634e+02 +/- 3.825e+02		3.642e+03	325.238		1.000e-04	325.339		1.037e+01
Two vertical red lines indicate the start and the end of the interruption. Red horizontal lines indicate SCS 107 limits. Purple hatched areas indicate that the satellite is in the radiation belt.
GOES-11 data are taken from NOAA site (http://goes.ngdc.noaa.gov).
| P1 | .8 - 4.0 | MeV protons (Counts/cm2 sec sr MeV) Uncorrected |
| P2 | 4.0 - 9.0 | MeV protons (Counts/cm2 sec sr MeV) Uncorrected |
| P5 | 40.0 - 80.0 | MeV protons (Counts/cm2 sec sr MeV) Uncorrected |
		Avg			Max		Time		Min		Time		Value at Interruption Started
--------------------------------------------------------------------------------------------------------------------------
p1	1.428e+03 +/- 4.685e+03		5.520e+04	328.295		2.970e+01	327.080		3.030e+01
p2	2.743e+02 +/- 1.119e+03		3.270e+04	326.924		2.580e-02	326.830		4.000e+00
p5	2.427e+01 +/- 8.611e+02		3.270e+04	326.924		2.940e-03	326.517		3.930e-01
Two vertical red lines indicate the start and the end of the interruption. Red horizontal lines indicate SCS 107 limits. Purple hatched areas indicate that the satellite is in the radiation belt.