| Science Run Stop: | 2002:04:19:14:15 |
| Science Run Start: | 2002:04:20:17:43 |
| Interruption: | 82.6ks |
| Triggered by: | manual |
Go to:
ACE Plot (E38/E175, P47/P112/P310/P761/P1060, Anisotopy)
EPHIN Plot (P4/P41/E1300)
GOES-11 Plot (P1/P2/P5)
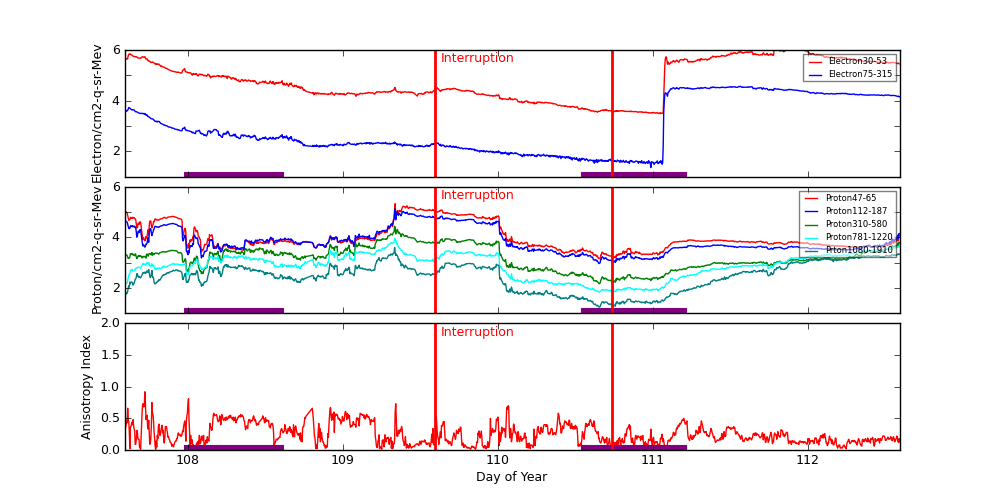
ACE radiation data are plotted around periods when science runs were interrupted. Plots start exactly 2 days before the interruption started. The top panel shows differential fluxes of electrons 38-53 and 175-315 (particles/cm2-s-ster-MeV), the middle panel shows differential fluxes of protons 47-65, 112-187, and 310-580 (particles/cm2-s-ster-MeV), and the bottom panel shows anisotropy ratio. The original data are prepared by the U.S. Dept. of Commerce, NOAA, Space Environment Center.
Data Period  (dom): 107.5938 - 112.5938
Interruption (dom): 109.5938 - 110.7382
			Avg		 Max		Time	Min		Time		Value at Interruption Started
--------------------------------------------------------------------------------------------------------------------------
e38 		2.224e+05+/-2.905e+05	1.250e+06	111.882 	3.050e+03	111.038		2.790e+05
e175		8.077e+03+/-1.208e+04	3.670e+04	111.566 	2.270e+01	110.986		1.400e+04
p47 		2.162e+04+/-3.451e+04	2.130e+05	109.337 	1.450e+03	110.653		1.170e+04
p112		1.372e+04+/-1.999e+04	1.330e+05	109.337 	9.200e+02	110.653		1.390e+04
p310		2.613e+03+/-2.965e+03	2.730e+04	109.333 	1.480e+02	110.653		6.140e+03
p761		1.267e+03+/-1.143e+03	9.140e+03	109.333 	6.950e+01	110.656		4.370e+03
p1060		5.361e+02+/-5.360e+02	3.950e+03	109.333 	1.740e+01	110.653		2.130e+03
anisotropy	2.522e-01+/-1.563e-01	9.200e-01	107.722 	1.000e-02	107.694		1.600e-01

Hardness:
e38/e175	1.017e+02+/-6.087e+01	2.582e+02	108.222 	3.864e+00	111.069		1.993e+01
p47/p1060	7.204e+01+/-1.295e+02	2.015e+03	107.597 	2.247e+00	112.420		5.493e+00
p112/p1060	4.327e+01+/-5.962e+01	8.558e+02	107.597 	2.119e+00	112.337		6.526e+00
p310/p1060	6.723e+00+/-4.265e+00	4.067e+01	107.597 	1.029e+00	112.135		2.883e+00
p761/p1060	2.797e+00+/-7.928e-01	4.729e+00	109.156 	1.378e+00	112.104		2.052e+00

Steepest Rise
------------
	Time		Slope(in log per hr)
----------------------------------------
e1  	111.0660		638307.5936
e175	111.0833		25377.7429
p47 	109.3194		226321.2742
p112	109.3194		128520.7236
p310	109.3160		18840.1061
p761	109.3160		4476.0252
p1060	109.3160		2352.0132
Two vertical red lines indicate the start and the end of the interruption. Purple hatched areas indicate that the satellite is in the radiation belt.
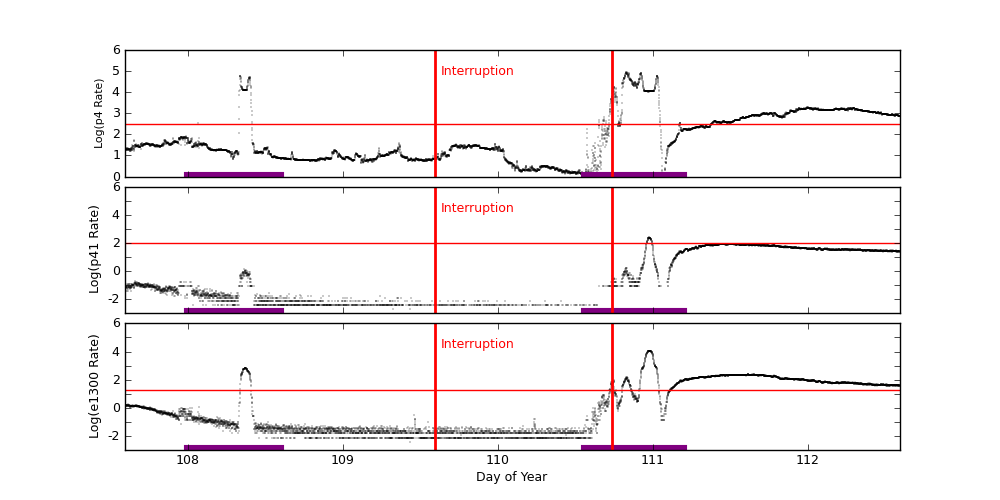
EPHIN Data are used to trigger science run interruptions. The trigger levels are:
| P4 | 300 | Counts/cm2 sec sr MeV |
| P41 | 10 | Counts/cm2 sec sr MeV |
| E1300 | 20 | Counts/cm2 sec sr MeV |
		Avg			Max		Time		Min		Time		Value at Interruption Started
--------------------------------------------------------------------------------------------------------------------------
p4	2.188e+03 +/- 8.815e+03		9.539e+04	110.829		2.313e-01	107.437		7.032e+00
p41	1.519e+01 +/- 2.818e+01		2.622e+02	110.974		1.000e-04	107.435		1.000e-04
e1300	1.392e+02 +/- 9.165e+02		1.174e+04	110.976		1.000e-04	107.951		2.275e-02
Two vertical red lines indicate the start and the end of the interruption. Red horizontal lines indicate SCS 107 limits. Purple hatched areas indicate that the satellite is in the radiation belt.
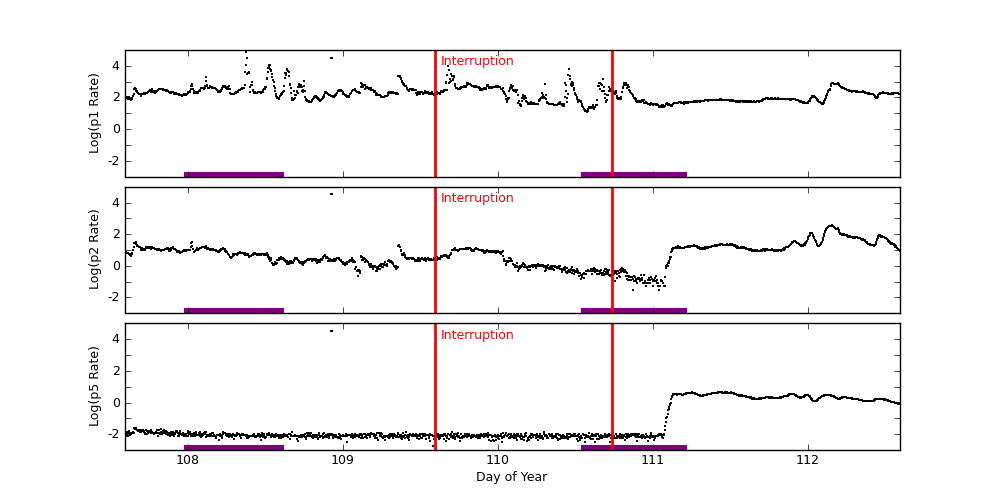
GOES-11 data are taken from NOAA site (http://goes.ngdc.noaa.gov).
| P1 | .8 - 4.0 | MeV protons (Counts/cm2 sec sr MeV) Uncorrected |
| P2 | 4.0 - 9.0 | MeV protons (Counts/cm2 sec sr MeV) Uncorrected |
| P5 | 40.0 - 80.0 | MeV protons (Counts/cm2 sec sr MeV) Uncorrected |
		Avg			Max		Time		Min		Time		Value at Interruption Started
--------------------------------------------------------------------------------------------------------------------------
p1	4.597e+02 +/- 2.587e+03		7.400e+04	108.375		1.270e+01	110.573		1.500e+02
p2	6.165e+01 +/- 1.218e+03		3.270e+04	108.924		2.770e-02	110.872		2.760e+00
p5	4.613e+01 +/- 1.217e+03		3.270e+04	108.924		1.800e-03	109.583		6.750e-03
Two vertical red lines indicate the start and the end of the interruption. Red horizontal lines indicate SCS 107 limits. Purple hatched areas indicate that the satellite is in the radiation belt.