| Science Run Stop: | 2003:10:28:13:02 |
| Science Run Start: | 2003:10:31:05:30 |
| Interruption: | 172.3ks |
| Triggered by: | auto |
Go to:
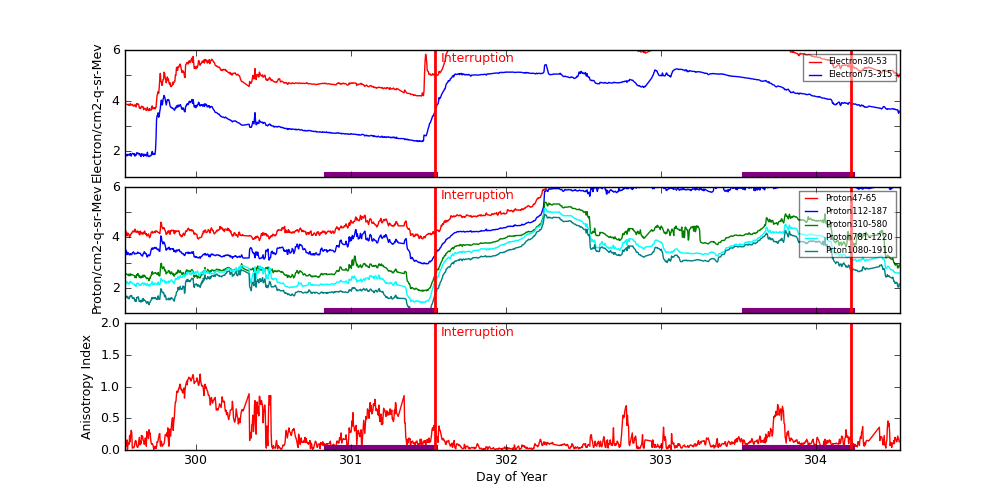
ACE Plot (E38/E175, P47/P112/P310/P761/P1060, Anisotopy)
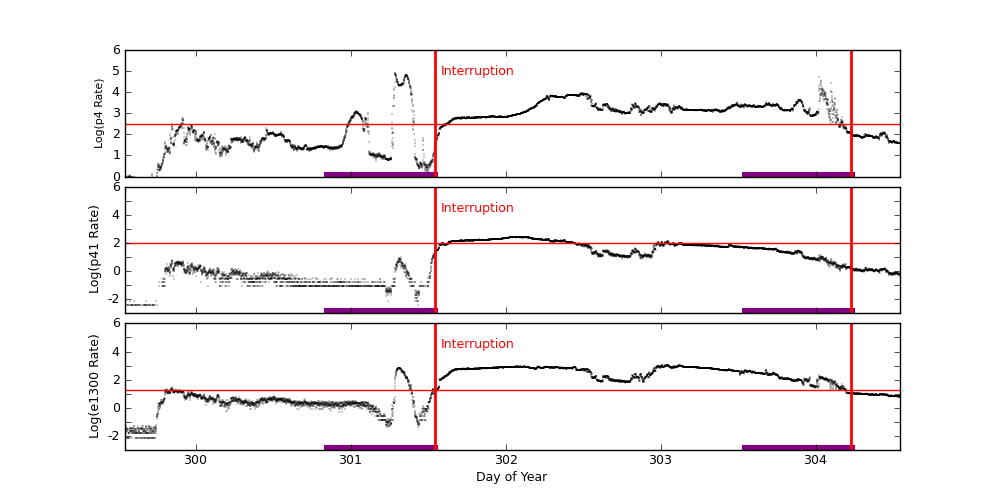
EPHIN Plot (P4/P41/E1300)
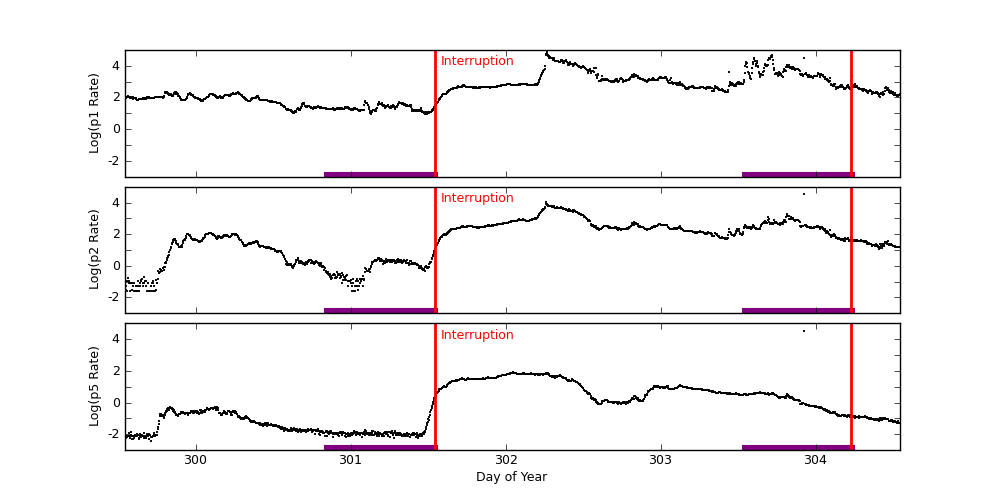
GOES-11 Plot (P1/P2/P5)
ACE radiation data are plotted around periods when science runs were interrupted. Plots start exactly 2 days before the interruption started. The top panel shows differential fluxes of electrons 38-53 and 175-315 (particles/cm2-s-ster-MeV), the middle panel shows differential fluxes of protons 47-65, 112-187, and 310-580 (particles/cm2-s-ster-MeV), and the bottom panel shows anisotropy ratio. The original data are prepared by the U.S. Dept. of Commerce, NOAA, Space Environment Center.
Data Period  (dom): 299.5431 - 304.5431
Interruption (dom): 301.5431 - 304.2292
			Avg		 Max		Time	Min		Time		Value at Interruption Started
--------------------------------------------------------------------------------------------------------------------------
e38 		1.078e+06+/-1.166e+06	5.070e+06	302.253 	4.030e+03	299.698		1.090e+05
e175		4.576e+04+/-5.296e+04	2.620e+05	302.253 	6.140e+01	299.698		3.840e+03
p47 		1.662e+06+/-1.863e+06	4.340e+06	304.413 	7.420e+03	300.410		4.330e+06
p112		4.342e+05+/-5.003e+05	1.780e+06	303.917 	9.050e+02	301.483		9.290e+05
p310		1.800e+04+/-3.622e+04	2.420e+05	302.257 	7.390e+01	301.462		8.120e+02
p761		7.429e+03+/-1.721e+04	1.380e+05	302.250 	2.610e+01	301.462		4.000e+02
p1060		4.315e+03+/-1.023e+04	7.930e+04	302.253 	1.110e+01	301.486		1.440e+02
anisotropy	2.315e-01+/-2.606e-01	1.200e+00	300.028 	1.000e-02	299.559		1.300e-01

Hardness:
e38/e175	4.630e+01+/-6.867e+01	1.663e+03	301.483 	5.029e+00	299.826		2.839e+01
p47/p1060	1.413e+03+/-3.464e+03	3.926e+04	304.531 	9.660e+00	302.253		3.007e+04
p112/p1060	3.239e+02+/-7.914e+02	8.954e+03	304.531 	3.089e+00	300.306		6.451e+03
p310/p1060	6.285e+00+/-4.474e+00	3.296e+01	304.281 	1.215e+00	300.306		5.639e+00
p761/p1060	2.207e+00+/-7.679e-01	5.592e+00	299.684 	9.191e-01	304.059		2.778e+00

Steepest Rise
------------
	Time		Slope(in log per hr)
----------------------------------------
e1  	302.3299		3708041.7807
e175	302.9444		195602.2040
p47 	304.3958		5208058.6823
p112	304.4062		1812020.4171
p310	302.2326		252722.8476
p761	302.2326		134761.5184
p1060	302.2326		72720.8194
Two vertical red lines indicate the start and the end of the interruption. Purple hatched areas indicate that the satellite is in the radiation belt.
EPHIN Data are used to trigger science run interruptions. The trigger levels are:
| P4 | 300 | Counts/cm2 sec sr MeV |
| P41 | 10 | Counts/cm2 sec sr MeV |
| E1300 | 20 | Counts/cm2 sec sr MeV |
		Avg			Max		Time		Min		Time		Value at Interruption Started
--------------------------------------------------------------------------------------------------------------------------
p4	2.021e+03 +/- 6.149e+03		8.013e+04	301.285		3.944e-01	299.725		2.899e+01
p41	4.323e+01 +/- 6.613e+01		2.778e+02	302.037		1.000e-04	299.452		2.116e+01
e1300	2.389e+02 +/- 3.063e+02		1.175e+03	303.049		1.000e-04	299.455		1.277e+01
Two vertical red lines indicate the start and the end of the interruption. Red horizontal lines indicate SCS 107 limits. Purple hatched areas indicate that the satellite is in the radiation belt.
GOES-11 data are taken from NOAA site (http://goes.ngdc.noaa.gov).
| P1 | .8 - 4.0 | MeV protons (Counts/cm2 sec sr MeV) Uncorrected |
| P2 | 4.0 - 9.0 | MeV protons (Counts/cm2 sec sr MeV) Uncorrected |
| P5 | 40.0 - 80.0 | MeV protons (Counts/cm2 sec sr MeV) Uncorrected |
		Avg			Max		Time		Min		Time		Value at Interruption Started
--------------------------------------------------------------------------------------------------------------------------
p1	2.265e+03 +/- 6.245e+03		7.290e+04	302.264		8.770e+00	301.486		3.300e+01
p2	4.250e+02 +/- 1.316e+03		3.270e+04	303.924		2.580e-02	299.556		1.190e+01
p5	3.164e+01 +/- 8.614e+02		3.270e+04	303.924		3.780e-03	299.712		2.400e+00
Two vertical red lines indicate the start and the end of the interruption. Red horizontal lines indicate SCS 107 limits. Purple hatched areas indicate that the satellite is in the radiation belt.