| Science Run Stop: | 2011:10:26:11:40 |
| Science Run Start: | 2011:10:28:12:33 |
| Interruption: | 133.5ks |
| Triggered by: | auto |
Go to:
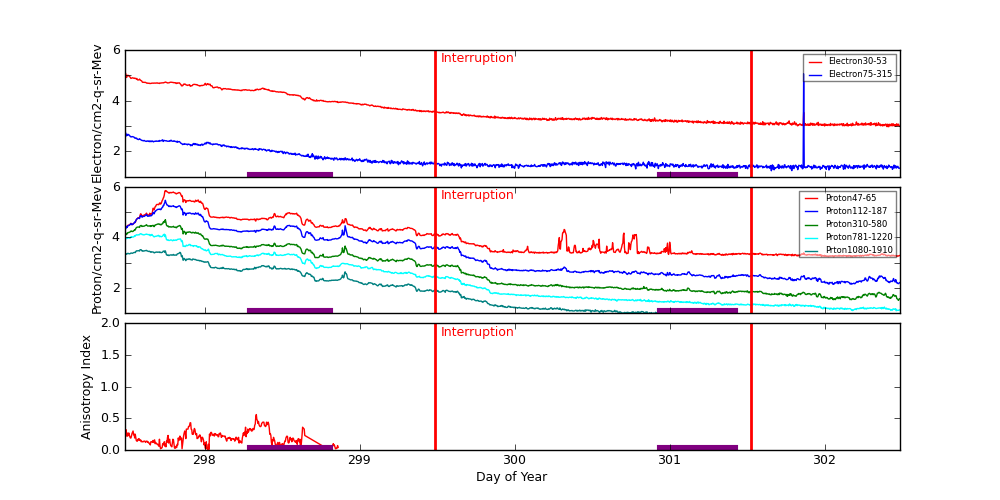
ACE Plot (E38/E175, P47/P112/P310/P761/P1060, Anisotopy)
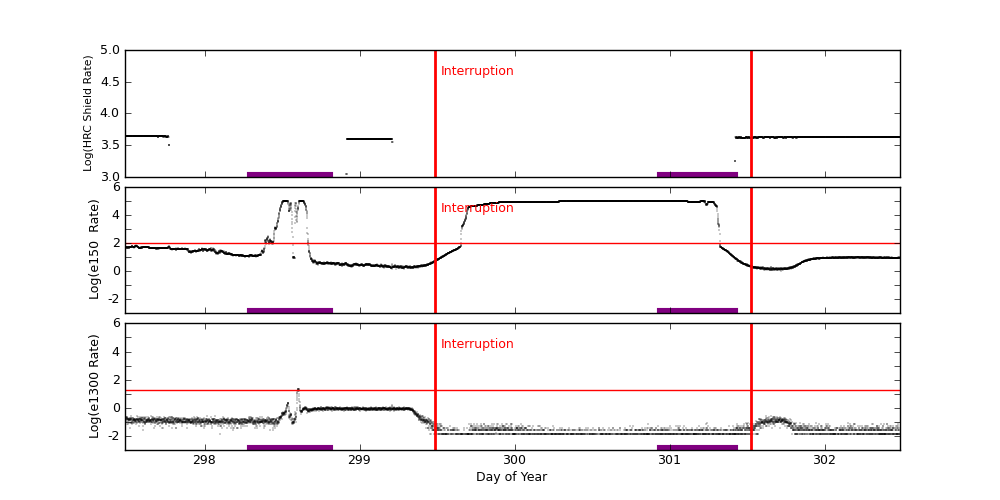
EPHIN Plot (HRC Shield Rate/E150/E1300)
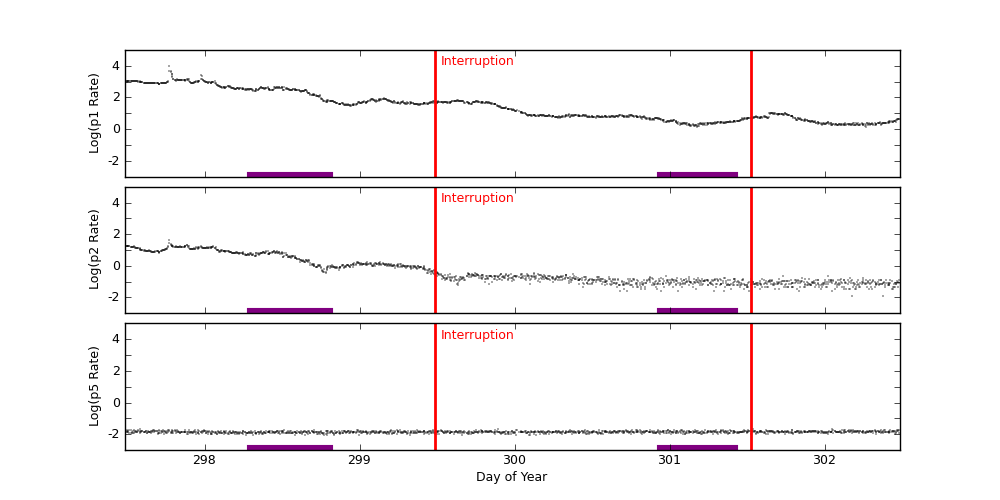
GOES-15 Plot (P1/P2/P5)
ACE radiation data are plotted around periods when science runs were interrupted. Plots start exactly 2 days before the interruption started. The top panel shows differential fluxes of electrons 38-53 and 175-315 (particles/cm2-s-ster-MeV), the middle panel shows differential fluxes of protons 47-65, 112-187, and 310-580 (particles/cm2-s-ster-MeV), and the bottom panel shows anisotropy ratio. The original data are prepared by the U.S. Dept. of Commerce, NOAA, Space Environment Center.
Data Period  (dom): 297.4861 - 302.4861
Interruption (dom): 299.4861 - 301.5229
			Avg		 Max		Time	Min		Time		Value at Interruption Started
--------------------------------------------------------------------------------------------------------------------------
e38 		1.111e+04+/-1.761e+04	1.210e+05	297.490 	9.310e+02	302.413		9.760e+02
e175		1.468e+02+/-3.034e+03	1.150e+05	301.865 	1.700e+01	301.656		2.150e+01
p47 		4.076e+04+/-9.902e+04	7.050e+05	297.747 	1.710e+03	302.059		1.910e+03
p112		1.472e+04+/-3.420e+04	2.910e+05	297.747 	1.390e+02	302.059		1.620e+02
p310		3.349e+03+/-7.378e+03	4.990e+04	297.747 	3.230e+01	302.476		3.740e+01
p761		1.296e+03+/-2.839e+03	1.390e+04	297.587 	1.260e+01	302.462		1.360e+01
p1060		3.374e+02+/-6.799e+02	3.250e+03	297.583 	3.570e+00	302.177		4.350e+00
anisotropy	1.889e-01+/-1.098e-01	5.600e-01	298.333 	1.000e-02	298.021		-1.000e+00

Hardness:
e38/e175	1.113e+02+/-6.687e+01	2.748e+02	298.372 	3.000e-02	301.865		4.540e+01
p47/p1060	2.281e+02+/-1.503e+02	1.438e+03	300.323 	1.068e+01	297.490		4.391e+02
p112/p1060	4.015e+01+/-1.108e+01	1.029e+02	297.753 	9.775e+00	297.490		3.724e+01
p310/p1060	9.007e+00+/-1.257e+00	1.709e+01	297.747 	5.586e+00	297.490		8.598e+00
p761/p1060	3.305e+00+/-4.288e-01	5.059e+00	299.045 	2.051e+00	298.906		3.126e+00

Steepest Rise
------------
	Time		Slope(in log per hr)
----------------------------------------
e1  	297.9861		12914.2498
e175	301.8472		137484.9837
p47 	297.7292		569183.6017
p112	297.7292		190126.4552
p310	297.7292		19730.1038
p761	297.5694		3348.1388
p1060	297.5694		896.8229
Two vertical red lines indicate the start and the end of the interruption. Purple hatched areas indicate that the satellite is in the radiation belt.
EPHIN Data are used to trigger science run interruptions. The trigger levels are:
| HRC Shield Rate | NA | |
| E150 | 100 | Counts/cm2 sec sr eV |
| E1300 | 20 | Counts/cm2 sec sr eV |
		Avg			Max		Time		Min		Time		Value at Interruption Started
--------------------------------------------------------------------------------------------------------------------------
hrc	hrc	4.156e+03 +/- 2.168e+02		4.385e+03	297.640		1.097e+03	298.914		NA
e150	2.879e+04 +/- 4.012e+04		1.020e+05	298.617		1.094e+00	301.719		5.029e+00
e1300	2.240e-01 +/- 9.440e-01		2.293e+01	298.606		1.000e-04	298.076		3.909e-02
Two vertical red lines indicate the start and the end of the interruption. Red horizontal lines indicate SCS 107 limits. Purple hatched areas indicate that the satellite is in the radiation belt.
GOES-15 data are taken from NOAA site (http://goes.ngdc.noaa.gov).
| P1 | .8 - 4.0 | MeV protons (Counts/cm2 sec sr MeV) Uncorrected |
| P2 | 4.0 - 9.0 | MeV protons (Counts/cm2 sec sr MeV) Uncorrected |
| P5 | 40.0 - 80.0 | MeV protons (Counts/cm2 sec sr MeV) Uncorrected |
		Avg			Max		Time		Min		Time		Value at Interruption Started
--------------------------------------------------------------------------------------------------------------------------
p1	1.990e+02 +/- 4.793e+02		9.710e+03	297.773		1.350e+00	301.174		4.560e+01
p2	2.540e+00 +/- 4.707e+00		4.150e+01	297.773		1.210e-02	302.174		2.780e-01
p5	1.377e-02 +/- 1.889e-03		2.140e-02	301.538		8.650e-03	298.315		1.200e-02
Two vertical red lines indicate the start and the end of the interruption. Red horizontal lines indicate SCS 107 limits. Purple hatched areas indicate that the satellite is in the radiation belt.