| Science Run Stop: | 2012:01:23:06:00 |
| Science Run Start: | 2012:01:26:08:27 |
| Interruption: | 187.1ks |
| Triggered by: | auto |
Go to:
ACE Plot (E38/E175, P47/P112/P310/P761/P1060, Anisotopy)
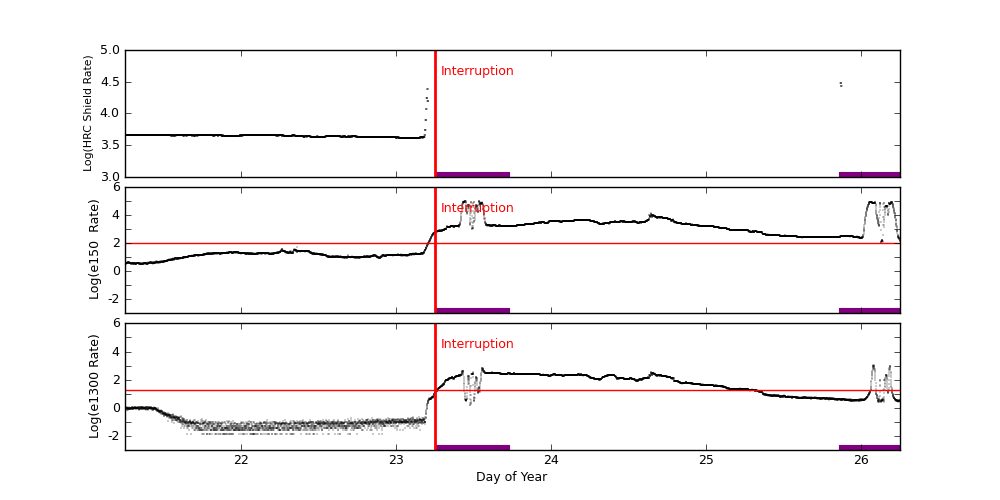
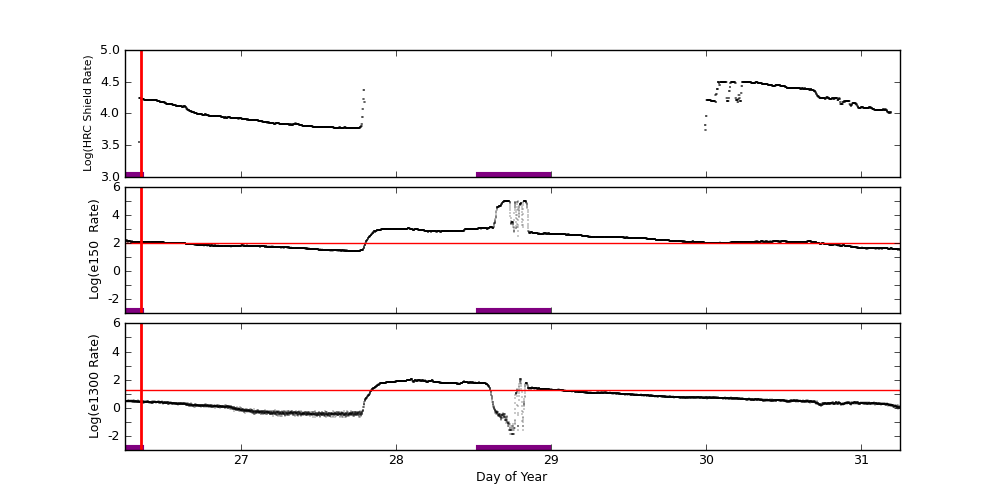
EPHIN Plot (HRC Shield Rate/E150/E1300)
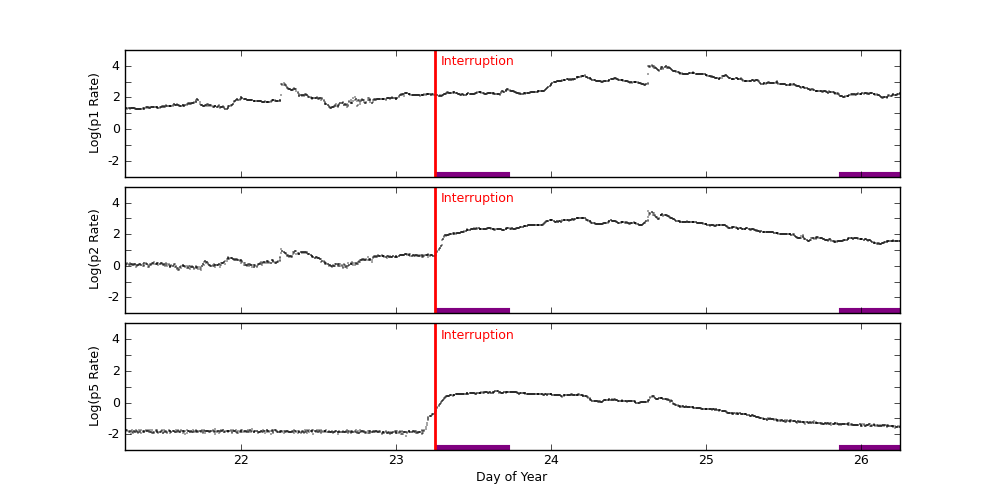
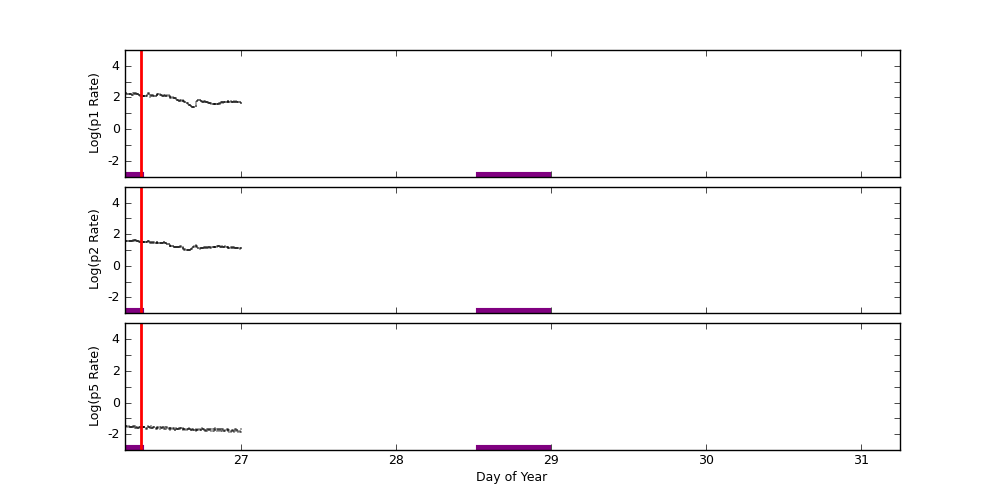
GOES-15 Plot (P1/P2/P5)
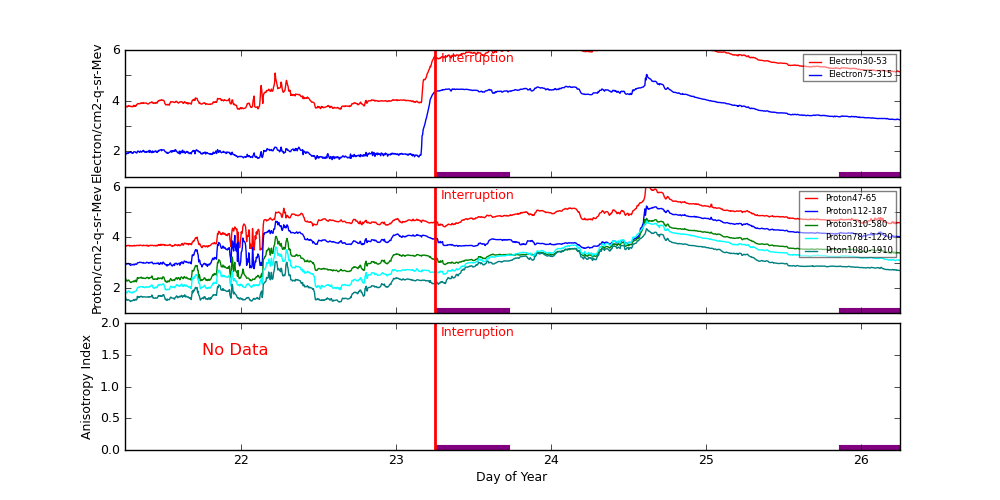
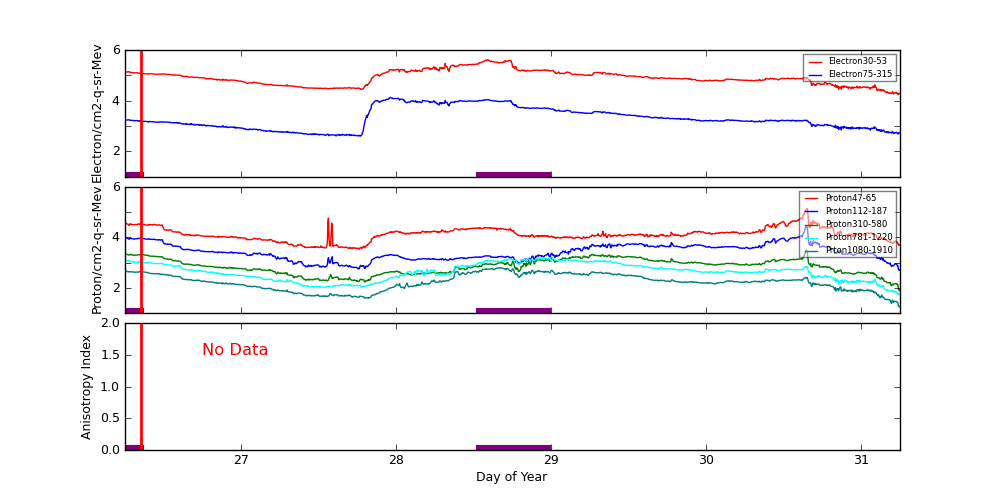
ACE radiation data are plotted around periods when science runs were interrupted. Plots start exactly 2 days before the interruption started. The top panel shows differential fluxes of electrons 38-53 and 175-315 (particles/cm2-s-ster-MeV), the middle panel shows differential fluxes of protons 47-65, 112-187, and 310-580 (particles/cm2-s-ster-MeV), and the bottom panel shows anisotropy ratio. The original data are prepared by the U.S. Dept. of Commerce, NOAA, Space Environment Center.
Data Period  (dom): 21.2500 - 31.2500
Interruption (dom): 23.2500 - 26.3521
			Avg		 Max		Time	Min		Time		Value at Interruption Started
--------------------------------------------------------------------------------------------------------------------------
e38 		3.723e+05+/-7.718e+05	8.860e+06	24.615 	4.530e+03	21.986		1.840e+04
e175		6.915e+03+/-1.091e+04	1.080e+05	24.615 	4.680e+01	22.587		5.260e+02
p47 		5.080e+04+/-1.009e+05	1.470e+06	24.615 	3.160e+03	22.122		5.100e+03
p112		1.043e+04+/-2.026e+04	1.720e+05	24.615 	5.060e+02	31.243		5.220e+02
p310		2.880e+03+/-6.236e+03	5.640e+04	24.615 	7.840e+01	31.247		8.410e+01
p761		1.990e+03+/-4.578e+03	4.460e+04	24.615 	5.400e+01	31.240		5.510e+01
p1060		9.189e+02+/-2.106e+03	2.200e+04	24.615 	1.810e+01	31.247		1.810e+01
anisotropy	0.000e+00+/-0.000e+00	0.000e+00	0.000 	1.000e+10	0.000		-1.000e+00

Hardness:
e38/e175	6.805e+01+/-4.751e+01	8.723e+02	22.219 	1.022e+01	27.868		3.498e+01
p47/p1060	1.384e+02+/-2.091e+02	1.706e+03	22.642 	2.051e+01	24.510		2.818e+02
p112/p1060	2.655e+01+/-3.280e+01	2.835e+02	22.010 	1.382e+00	24.562		2.884e+01
p310/p1060	4.934e+00+/-2.738e+00	1.906e+01	22.642 	9.624e-01	24.108		4.646e+00
p761/p1060	2.515e+00+/-5.667e-01	4.196e+00	22.462 	1.119e+00	23.903		3.044e+00

Steepest Rise
------------
	Time		Slope(in log per hr)
----------------------------------------
e1  	24.5972		7619944.6016
e175	24.5972		90479.3422
p47 	24.5972		1487989.1820
p112	24.5972		178318.7036
p310	24.5868		48719.6458
p761	24.5972		30479.7784
p1060	24.5972		15179.8896
Two vertical red lines indicate the start and the end of the interruption. Purple hatched areas indicate that the satellite is in the radiation belt.
EPHIN Data are used to trigger science run interruptions. The trigger levels are:
| HRC Shield Rate | NA | |
| E150 | 100 | Counts/cm2 sec sr eV |
| E1300 | 20 | Counts/cm2 sec sr eV |
		Avg			Max		Time		Min		Time		Value at Interruption Started
--------------------------------------------------------------------------------------------------------------------------
hrc	hrc	1.024e+04 +/- 7.911e+03		3.169e+04	30.126		7.182e+01	29.882		NA
e150	3.410e+03 +/- 1.333e+04		9.926e+04	28.826		2.945e+00	21.289		5.887e+02
e1300	4.013e+01 +/- 8.181e+01		1.027e+03	26.079		1.000e-04	21.735		9.824e+00
Two vertical red lines indicate the start and the end of the interruption. Red horizontal lines indicate SCS 107 limits. Purple hatched areas indicate that the satellite is in the radiation belt.
GOES-15 data are taken from NOAA site (http://goes.ngdc.noaa.gov).
| P1 | .8 - 4.0 | MeV protons (Counts/cm2 sec sr MeV) Uncorrected |
| P2 | 4.0 - 9.0 | MeV protons (Counts/cm2 sec sr MeV) Uncorrected |
| P5 | 40.0 - 80.0 | MeV protons (Counts/cm2 sec sr MeV) Uncorrected |
		Avg			Max		Time		Min		Time		Value at Interruption Started
--------------------------------------------------------------------------------------------------------------------------
p1	1.051e+02 +/- 7.779e+01		4.660e+02	30.698		2.070e+01	31.250		3.230e+01
p2	3.956e+01 +/- 3.688e+01		1.660e+02	28.097		2.850e+00	30.694		6.210e+01
p5	4.522e-01 +/- 5.874e-01		2.070e+00	28.219		2.140e-02	31.247		1.620e+00
Two vertical red lines indicate the start and the end of the interruption. Red horizontal lines indicate SCS 107 limits. Purple hatched areas indicate that the satellite is in the radiation belt.