| Science Run Stop: | 2012:01:27:19:39 |
| Science Run Start: | 2012:01:30:02:20 |
| Interruption: | 157.4ks |
| Triggered by: | auto |
Go to:
ACE Plot (E38/E175, P47/P112/P310/P761/P1060, Anisotopy)
EPHIN Plot (HRC Shield Rate/E150/E1300)
GOES-15 Plot (P1/P2/P5)
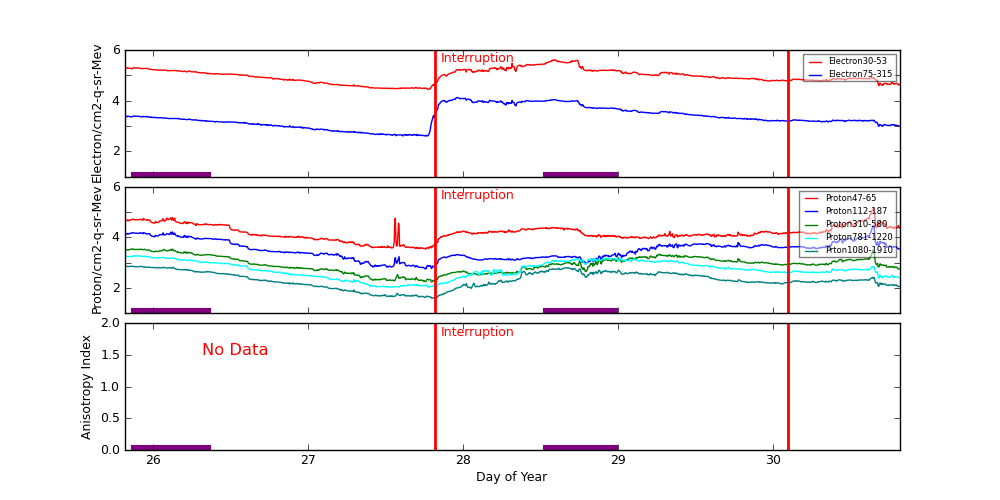
ACE radiation data are plotted around periods when science runs were interrupted. Plots start exactly 2 days before the interruption started. The top panel shows differential fluxes of electrons 38-53 and 175-315 (particles/cm2-s-ster-MeV), the middle panel shows differential fluxes of protons 47-65, 112-187, and 310-580 (particles/cm2-s-ster-MeV), and the bottom panel shows anisotropy ratio. The original data are prepared by the U.S. Dept. of Commerce, NOAA, Space Environment Center.
Data Period  (dom): 25.8188 - 30.8188
Interruption (dom): 27.8188 - 30.0972
			Avg		 Max		Time	Min		Time		Value at Interruption Started
--------------------------------------------------------------------------------------------------------------------------
e38 		1.131e+05+/-7.467e+04	4.110e+05	28.590 	2.790e+04	27.774		4.350e+04
e175		3.291e+03+/-3.225e+03	1.340e+04	27.962 	3.970e+02	27.771		9.970e+02
p47 		1.871e+04+/-1.430e+04	1.370e+05	30.649 	3.430e+03	27.760		2.330e+04
p112		4.317e+03+/-3.775e+03	2.890e+04	30.646 	5.680e+02	27.760		3.440e+03
p310		1.093e+03+/-7.753e+02	3.530e+03	25.865 	1.740e+02	27.795		5.630e+02
p761		6.814e+02+/-4.568e+02	1.880e+03	25.875 	1.060e+02	27.542		2.510e+02
p1060		2.640e+02+/-1.761e+02	7.320e+02	25.865 	3.900e+01	27.799		1.150e+02
anisotropy	0.000e+00+/-0.000e+00	0.000e+00	0.000 	1.000e+10	0.000		-1.000e+00

Hardness:
e38/e175	4.892e+01+/-2.116e+01	8.363e+01	25.955 	1.022e+01	27.868		4.363e+01
p47/p1060	8.654e+01+/-6.886e+01	1.186e+03	27.562 	2.211e+01	29.000		2.026e+02
p112/p1060	1.832e+01+/-1.110e+01	1.180e+02	30.646 	2.667e+00	28.649		2.991e+01
p310/p1060	4.397e+00+/-1.353e+00	1.298e+01	30.646 	1.447e+00	28.427		4.896e+00
p761/p1060	2.581e+00+/-4.004e-01	4.084e+00	28.809 	1.611e+00	28.392		2.183e+00

Steepest Rise
------------
	Time		Slope(in log per hr)
----------------------------------------
e1  	28.5764		484805.4626
e175	28.5764		13200.1487
p47 	30.6354		94801.0682
p112	30.6285		21480.2420
p310	26.1007		3684.0415
p761	26.1007		1836.0207
p1060	26.1007		712.8080
Two vertical red lines indicate the start and the end of the interruption. Purple hatched areas indicate that the satellite is in the radiation belt.
EPHIN Data are used to trigger science run interruptions. The trigger levels are:
| HRC Shield Rate | NA | |
| E150 | 100 | Counts/cm2 sec sr eV |
| E1300 | 20 | Counts/cm2 sec sr eV |
		Avg			Max		Time		Min		Time		Value at Interruption Started
--------------------------------------------------------------------------------------------------------------------------
hrc	hrc	1.473e+04 +/- 8.553e+03		3.169e+04	30.126		7.182e+01	29.882		NA
e150	3.852e+03 +/- 1.531e+04		9.926e+04	28.826		2.601e+01	27.755		2.201e+02
e1300	1.926e+01 +/- 5.866e+01		1.027e+03	26.079		1.000e-04	28.731		7.583e+00
Two vertical red lines indicate the start and the end of the interruption. Red horizontal lines indicate SCS 107 limits. Purple hatched areas indicate that the satellite is in the radiation belt.

GOES-15 data are taken from NOAA site (http://goes.ngdc.noaa.gov).
| P1 | .8 - 4.0 | MeV protons (Counts/cm2 sec sr MeV) Uncorrected |
| P2 | 4.0 - 9.0 | MeV protons (Counts/cm2 sec sr MeV) Uncorrected |
| P5 | 40.0 - 80.0 | MeV protons (Counts/cm2 sec sr MeV) Uncorrected |
		Avg			Max		Time		Min		Time		Value at Interruption Started
--------------------------------------------------------------------------------------------------------------------------
p1	1.130e+02 +/- 8.035e+01		4.660e+02	30.698		4.390e+01	29.795		3.230e+01
p2	4.445e+01 +/- 3.728e+01		1.660e+02	28.097		2.850e+00	30.694		6.210e+01
p5	5.172e-01 +/- 6.055e-01		2.070e+00	28.219		2.950e-02	30.771		1.620e+00
Two vertical red lines indicate the start and the end of the interruption. Red horizontal lines indicate SCS 107 limits. Purple hatched areas indicate that the satellite is in the radiation belt.
