| Science Run Stop: | 2012:03:07:05:30 |
| Science Run Start: | 2012:03:13:05:14 |
| Interruption: | 435.8ks |
| Triggered by: | auto |
Go to:
ACE Plot (E38/E175, P47/P112/P310/P761/P1060, Anisotopy)
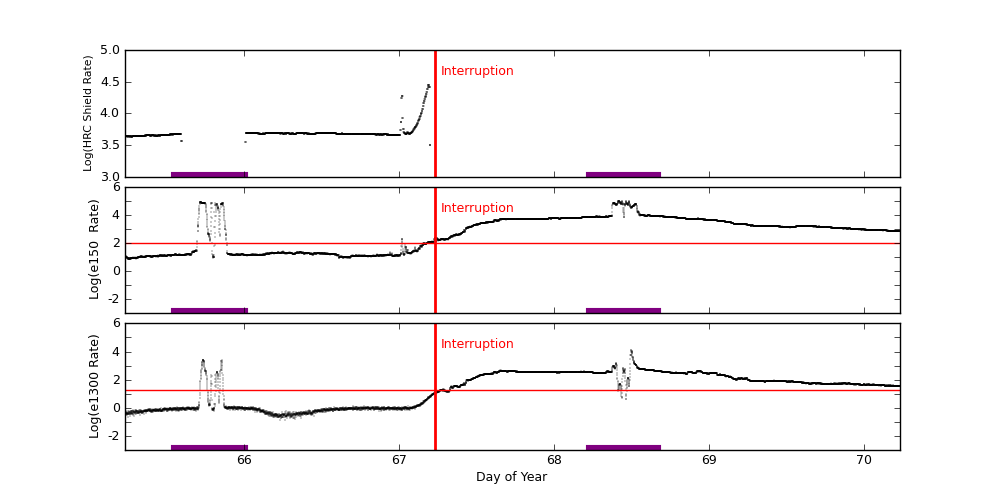
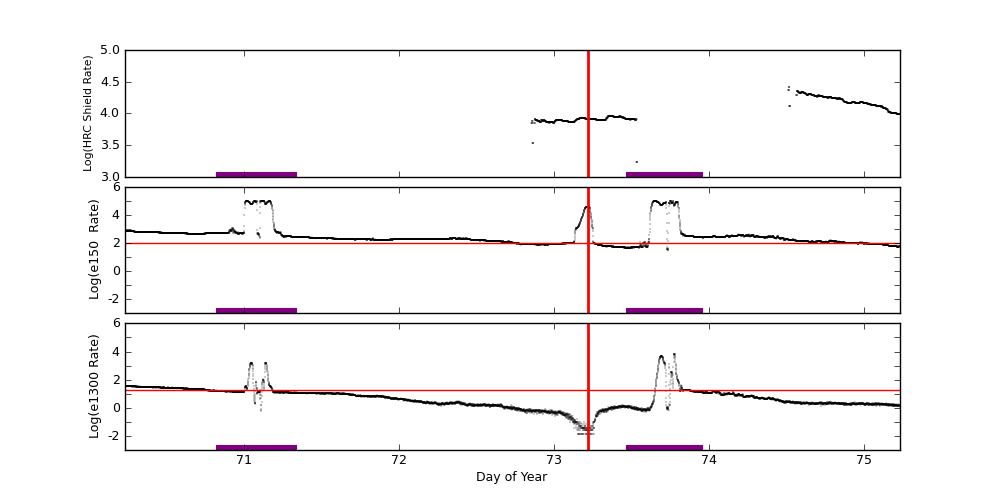
EPHIN Plot (HRC Shield Rate/E150/E1300)
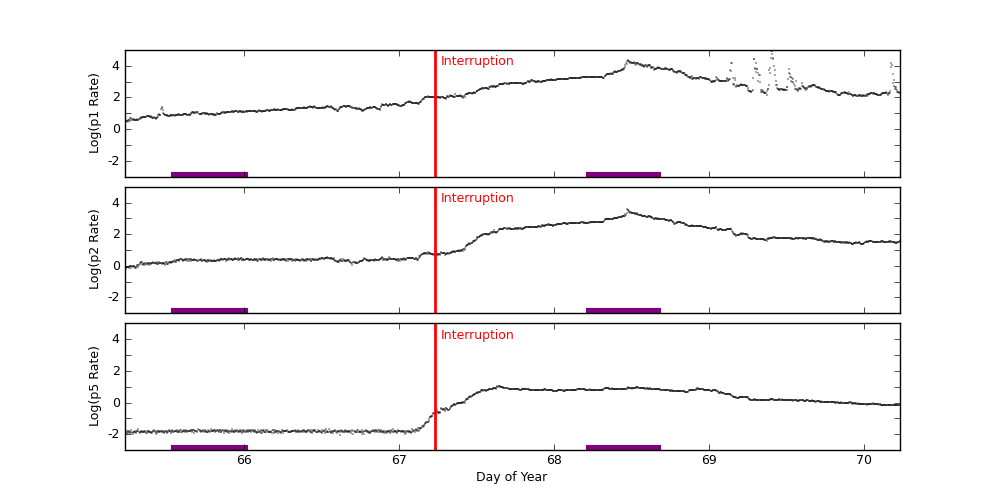
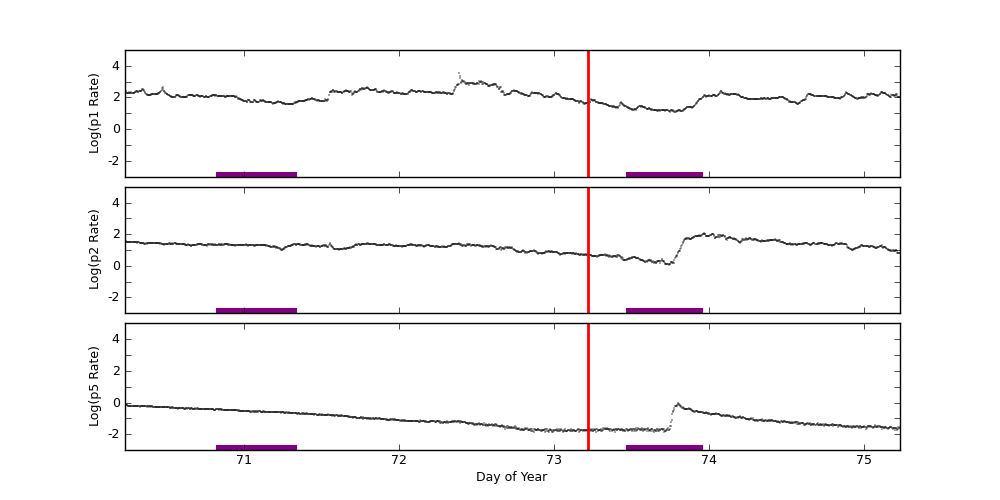
GOES-15 Plot (P1/P2/P5)
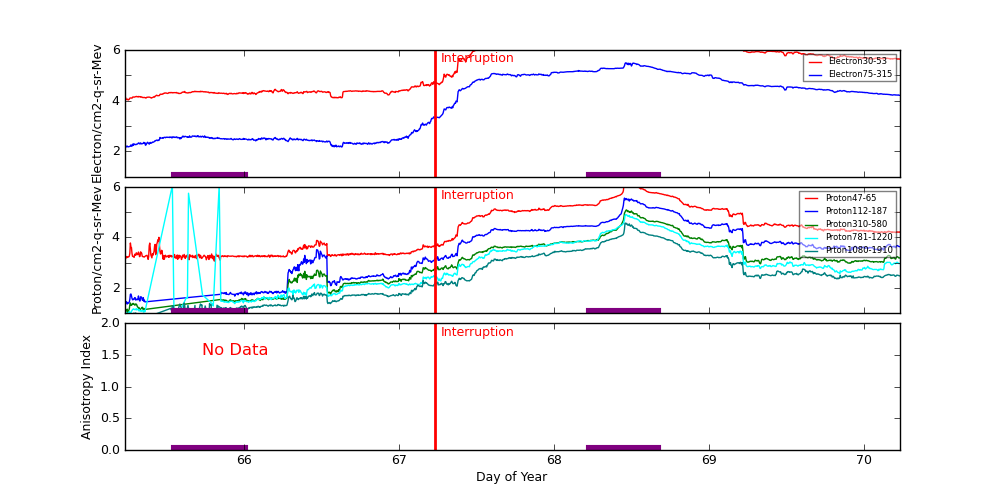
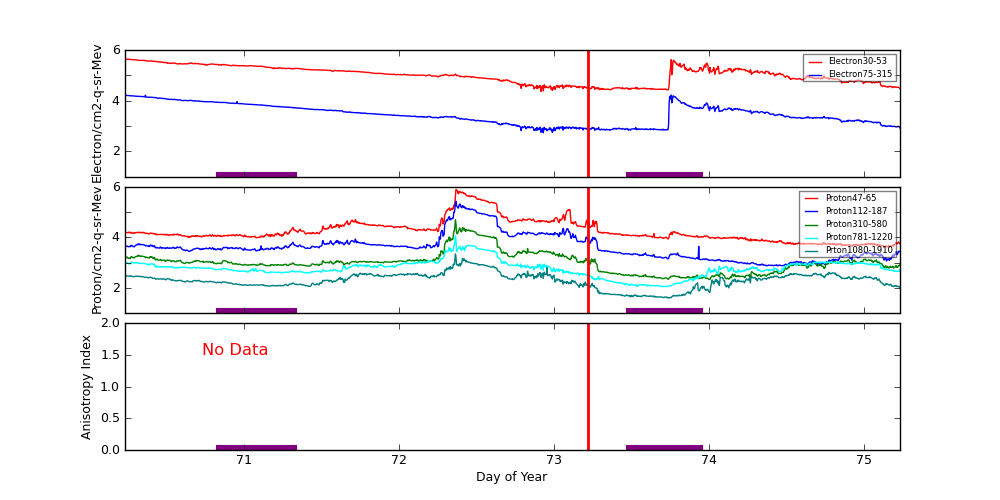
ACE radiation data are plotted around periods when science runs were interrupted. Plots start exactly 2 days before the interruption started. The top panel shows differential fluxes of electrons 38-53 and 175-315 (particles/cm2-s-ster-MeV), the middle panel shows differential fluxes of protons 47-65, 112-187, and 310-580 (particles/cm2-s-ster-MeV), and the bottom panel shows anisotropy ratio. The original data are prepared by the U.S. Dept. of Commerce, NOAA, Space Environment Center.
Data Period  (dom): 65.2292 - 75.2292
Interruption (dom): 67.2292 - 73.2181
			Avg		 Max		Time	Min		Time		Value at Interruption Started
--------------------------------------------------------------------------------------------------------------------------
e38 		6.646e+05+/-1.278e+06	8.320e+06	68.458 	1.060e+04	65.250		3.030e+04
e175		2.876e+04+/-5.444e+04	3.100e+05	68.458 	1.460e+02	65.236		8.380e+02
p47 		7.544e+04+/-1.858e+05	2.620e+06	68.455 	1.150e+03	65.806		5.540e+03
p112		1.783e+04+/-4.297e+04	3.550e+05	68.451 	2.310e+01	65.243		2.830e+03
p310		4.387e+03+/-1.207e+04	1.210e+05	68.465 	1.090e+01	65.246		8.520e+02
p761		3.855e+03+/-3.255e+04	1.100e+06	65.535 	2.520e-33	65.681		5.260e+02
p1060		1.142e+03+/-3.428e+03	3.640e+04	68.458 	1.280e-33	65.597		1.080e+02
anisotropy	0.000e+00+/-0.000e+00	0.000e+00	0.000 	1.000e+10	0.000		-1.000e+00

Hardness:
e38/e175	3.986e+01+/-2.059e+01	1.293e+02	66.795 	5.851e+00	73.740		3.616e+01
p47/p1060	2.018e+33+/-5.293e+34	1.492e+36	65.764 	1.332e+01	74.774		5.130e+01
p112/p1060	2.244e+01+/-2.529e+01	2.665e+02	72.392 	2.626e+00	74.698		2.620e+01
p310/p1060	4.803e+00+/-2.991e+00	2.759e+01	72.392 	1.295e+00	74.361		7.889e+00
p761/p1060	1.587e+35+/-8.272e+36	4.313e+38	65.639 	1.086e-34	65.715		4.870e+00

Steepest Rise
------------
	Time		Slope(in log per hr)
----------------------------------------
e1  	68.4410		4500012.5830
e175	68.0278		162000.4530
p47 	68.4375		2593207.2512
p112	68.4340		343800.9613
p310	68.4479		108360.3030
p761	65.5174		1320003.6910
p1060	68.4410		30480.0852
Two vertical red lines indicate the start and the end of the interruption. Purple hatched areas indicate that the satellite is in the radiation belt.
EPHIN Data are used to trigger science run interruptions. The trigger levels are:
| HRC Shield Rate | NA | |
| E150 | 100 | Counts/cm2 sec sr eV |
| E1300 | 20 | Counts/cm2 sec sr eV |
		Avg			Max		Time		Min		Time		Value at Interruption Started
--------------------------------------------------------------------------------------------------------------------------
hrc	hrc	8.448e+03 +/- 4.931e+03		2.837e+04	67.188		1.033e+02	69.088		NA
e150	5.103e+03 +/- 1.623e+04		1.023e+05	71.110		6.984e+00	65.199		2.285e+02
e1300	1.135e+02 +/- 4.654e+02		1.257e+04	68.496		1.000e-04	73.192		1.256e+01
Two vertical red lines indicate the start and the end of the interruption. Red horizontal lines indicate SCS 107 limits. Purple hatched areas indicate that the satellite is in the radiation belt.
GOES-15 data are taken from NOAA site (http://goes.ngdc.noaa.gov).
| P1 | .8 - 4.0 | MeV protons (Counts/cm2 sec sr MeV) Uncorrected |
| P2 | 4.0 - 9.0 | MeV protons (Counts/cm2 sec sr MeV) Uncorrected |
| P5 | 40.0 - 80.0 | MeV protons (Counts/cm2 sec sr MeV) Uncorrected |
		Avg			Max		Time		Min		Time		Value at Interruption Started
--------------------------------------------------------------------------------------------------------------------------
p1	8.637e+02 +/- 3.439e+03		8.590e+04	69.399		3.020e+00	65.250		9.790e+01
p2	1.151e+02 +/- 3.070e+02		3.660e+03	68.469		6.900e-01	65.236		5.080e+00
p5	1.327e+00 +/- 2.433e+00		1.080e+01	67.642		9.440e-03	66.615		2.620e-01
Two vertical red lines indicate the start and the end of the interruption. Red horizontal lines indicate SCS 107 limits. Purple hatched areas indicate that the satellite is in the radiation belt.