| Science Run Stop: | 2013:10:02:02:04 |
| Science Run Start: | 2013:10:03:13:27 |
| Interruption: | 85.3ks |
| Triggered by: | manual |
Go to:
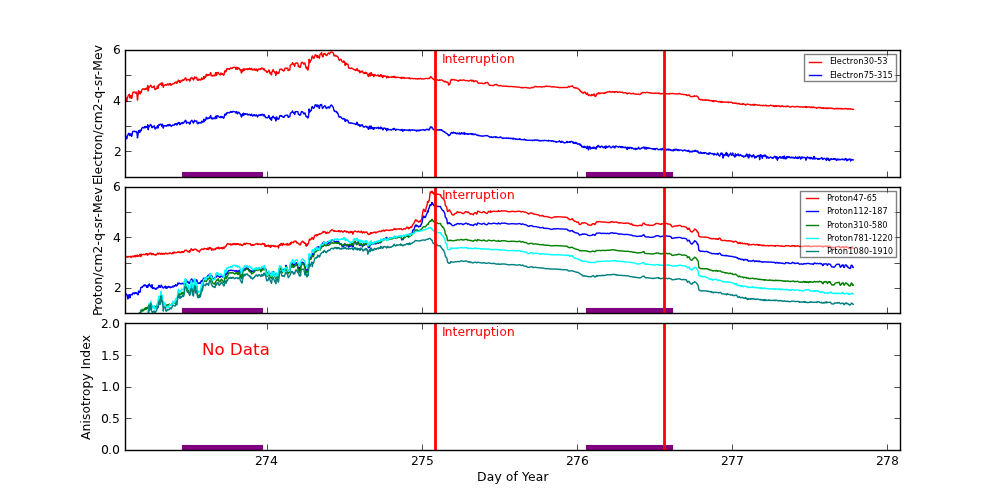
ACE Plot (E38/E175, P47/P112/P310/P761/P1060, Anisotopy)
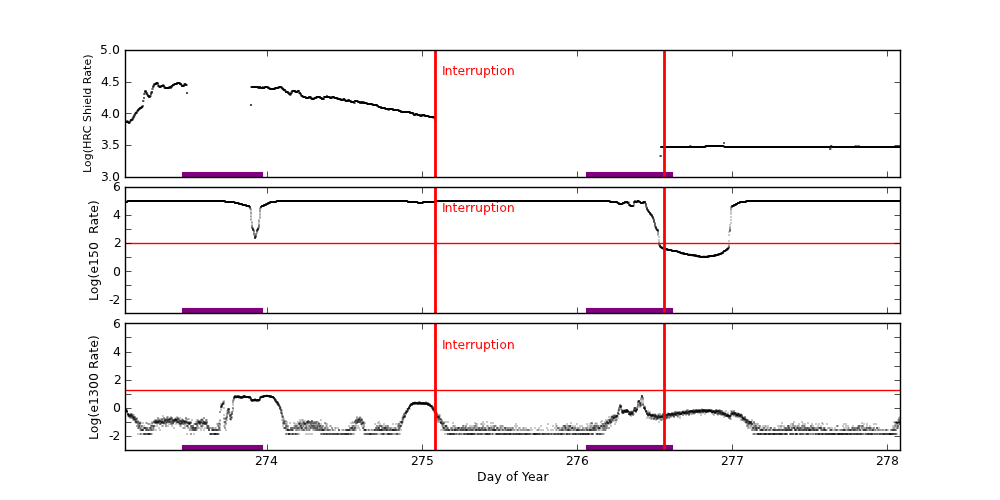
EPHIN Plot (HRC Shield Rate/E150/E1300)
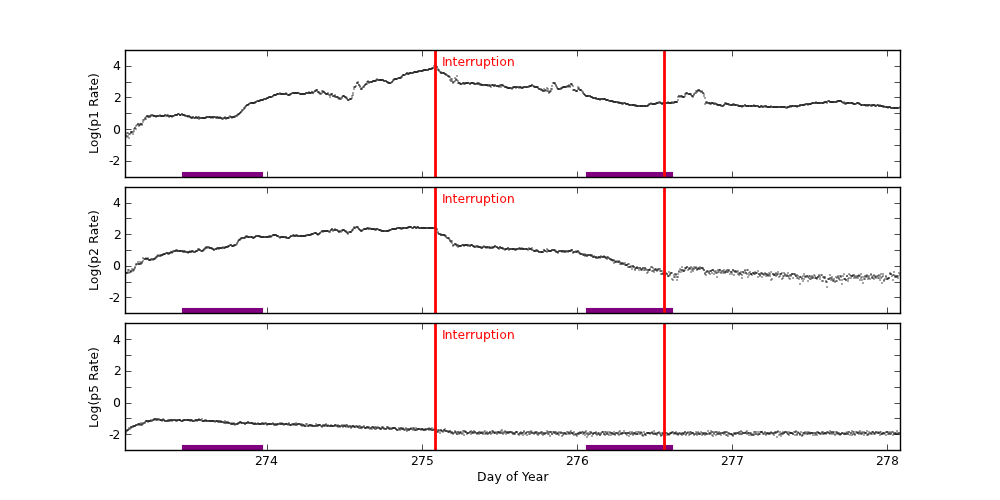
GOES-15 Plot (P1/P2/P5)
ACE radiation data are plotted around periods when science runs were interrupted. Plots start exactly 2 days before the interruption started. The top panel shows differential fluxes of electrons 38-53 and 175-315 (particles/cm2-s-ster-MeV), the middle panel shows differential fluxes of protons 47-65, 112-187, and 310-580 (particles/cm2-s-ster-MeV), and the bottom panel shows anisotropy ratio. The original data are prepared by the U.S. Dept. of Commerce, NOAA, Space Environment Center.
Data Period  (dom): 273.0861 - 278.0861
Interruption (dom): 275.0861 - 276.5604
			Avg		 Max		Time	Min		Time		Value at Interruption Started
--------------------------------------------------------------------------------------------------------------------------
e38 		8.417e+04+/-1.310e+05	8.400e+05	274.417 	4.470e+03	277.781		4.510e+03
e175		9.424e+02+/-1.293e+03	7.120e+03	274.354 	4.120e+01	277.767		4.550e+01
p47 		3.837e+04+/-7.516e+04	6.700e+05	275.066 	1.600e+03	273.128		3.630e+03
p112		1.331e+04+/-2.657e+04	2.390e+05	275.066 	3.680e+01	273.104		6.520e+02
p310		3.915e+03+/-6.554e+03	5.140e+04	275.066 	4.680e+00	273.115		1.290e+02
p761		2.674e+03+/-4.273e+03	2.440e+04	275.052 	7.290e-01	273.097		5.770e+01
p1060		1.039e+03+/-1.753e+03	9.150e+03	275.052 	2.230e-01	273.097		2.260e+01
anisotropy	0.000e+00+/-0.000e+00	0.000e+00	0.000 	1.000e+10	0.000		-1.000e+00

Hardness:
e38/e175	1.069e+02+/-3.681e+01	1.900e+02	274.479 	2.891e+01	273.097		9.912e+01
p47/p1060	1.322e+02+/-3.815e+02	7.713e+03	273.097 	3.806e+00	274.736		1.606e+02
p112/p1060	2.416e+01+/-1.953e+01	2.516e+02	273.097 	1.159e+00	274.497		2.885e+01
p310/p1060	5.360e+00+/-3.249e+00	2.601e+01	273.097 	8.433e-01	273.188		5.708e+00
p761/p1060	2.784e+00+/-7.462e-01	4.741e+00	274.295 	4.530e-01	273.188		2.553e+00

Steepest Rise
------------
	Time		Slope(in log per hr)
----------------------------------------
e1  	274.2778		447601.6094
e175	274.2778		4224.0152
p47 	275.0382		615602.2134
p112	275.0486		188760.6787
p310	275.0486		26160.0941
p761	274.9444		6240.0224
p1060	274.9444		2844.0102
Two vertical red lines indicate the start and the end of the interruption. Purple hatched areas indicate that the satellite is in the radiation belt.
EPHIN Data are used to trigger science run interruptions. The trigger levels are:
| HRC Shield Rate | NA | |
| E150 | 100 | Counts/cm2 sec sr eV |
| E1300 | 20 | Counts/cm2 sec sr eV |
		Avg			Max		Time		Min		Time		Value at Interruption Started
--------------------------------------------------------------------------------------------------------------------------
hrc	1.022e+04 +/- 8.667e+03		3.037e+04	273.289		2.143e+03	276.538		7.718e+03
e150	8.076e+04 +/- 3.152e+04		9.905e+04	275.303		9.407e+00	276.842		8.923e+04
e1300	5.128e-01 +/- 1.289e+00		7.609e+00	274.002		1.000e-04	273.169		5.081e-01
Two vertical red lines indicate the start and the end of the interruption. Red horizontal lines indicate SCS 107 limits. Purple hatched areas indicate that the satellite is in the radiation belt.
GOES-15 data are taken from NOAA site (http://goes.ngdc.noaa.gov).
| P1 | .8 - 4.0 | MeV protons (Counts/cm2 sec sr MeV) Uncorrected |
| P2 | 4.0 - 9.0 | MeV protons (Counts/cm2 sec sr MeV) Uncorrected |
| P5 | 40.0 - 80.0 | MeV protons (Counts/cm2 sec sr MeV) Uncorrected |
		Avg			Max		Time		Min		Time		Value at Interruption Started
--------------------------------------------------------------------------------------------------------------------------
p1	4.939e+02 +/- 1.254e+03		1.440e+04	275.083		2.670e-01	273.115		1.220e+04
p2	4.440e+01 +/- 7.503e+01		2.930e+02	274.583		4.840e-02	277.618		2.540e+02
p5	2.481e-02 +/- 2.022e-02		9.750e-02	273.302		6.690e-03	276.069		2.200e-02
Two vertical red lines indicate the start and the end of the interruption. Red horizontal lines indicate SCS 107 limits. Purple hatched areas indicate that the satellite is in the radiation belt.