| Science Run Stop: | 2015:06:22:22:40 |
| Science Run Start: | 2015:06:23:21:40 |
| Interruption: | 82.0ks |
| Triggered by: | manual |
Go to:
ACE Plot (E38/E175, P47/P112/P310/P761/P1060)
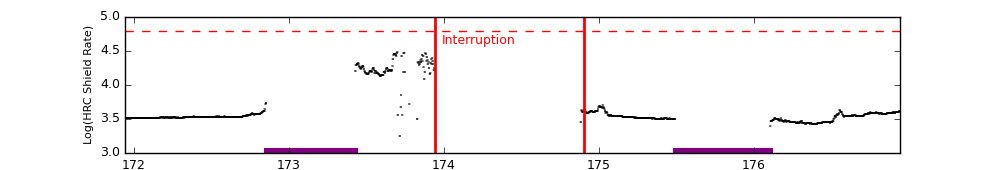
HRC Plot (HRC Shield Rate)
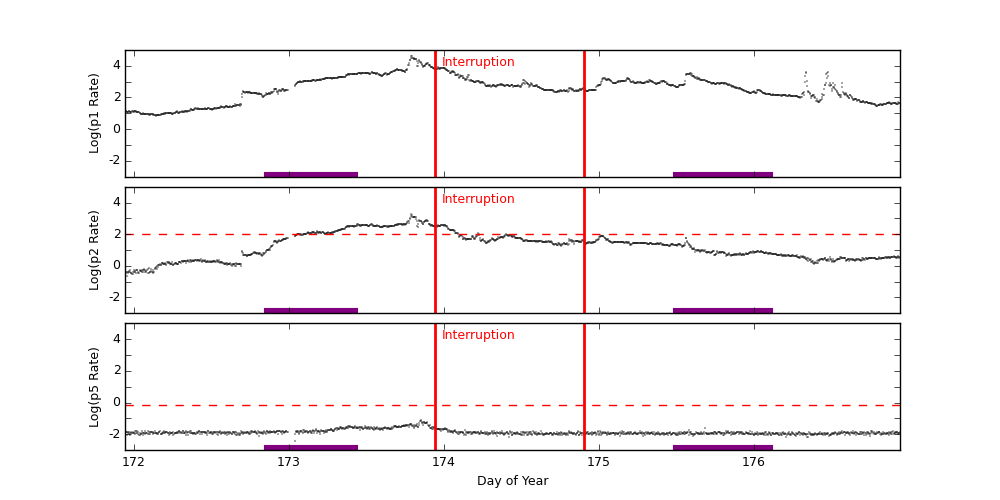
GOES-15 Plot (P1/P2/P5)
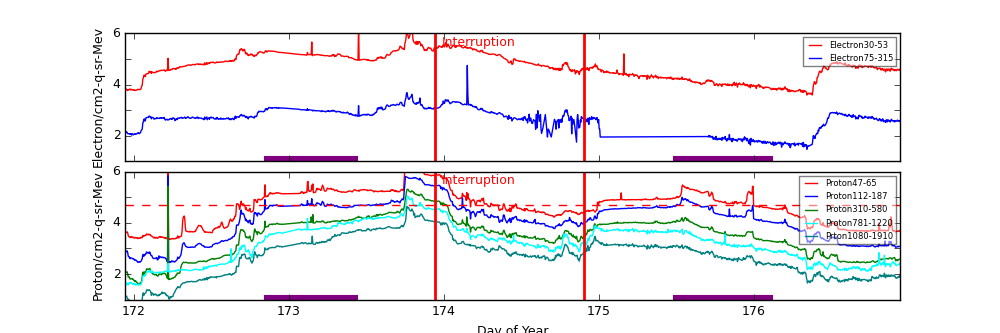
ACE radiation data are plotted around periods when science runs were interrupted. Plots start exactly 2 days before the interruption started. The top panel shows differential fluxes of electrons 38-53 and 175-315 (particles/cm2-s-ster-MeV), the middle panel shows differential fluxes of protons 47-65, 112-187, and 310-580 (particles/cm2-s-ster-MeV).
Data Period  (dom): 171.9444 - 176.9444
Interruption (dom): 173.9444 - 174.9028
			Avg		 Max		Time	Min		Time		Value at Interruption Started
--------------------------------------------------------------------------------------------------------------------------
e38 		9.702e+04+/-1.456e+05	2.370e+06	173.451 	3.900e+03	176.344		3.630e+04
e175		6.616e+02+/-1.640e+03	5.570e+04	174.153 	1.000e-37	175.302		3.660e+02
p47 		1.195e+05+/-2.216e+05	1.710e+06	173.754 	2.230e+03	172.233		4.700e+03
p112		4.407e+04+/-9.467e+04	6.860e+05	172.222 	2.850e+02	172.233		1.200e+03
p310		1.139e+04+/-2.587e+04	2.630e+05	172.222 	3.850e+01	172.031		3.860e+02
p761		5.677e+03+/-1.173e+04	1.090e+05	173.767 	3.670e+01	172.014		2.400e+02
p1060		2.006e+03+/-4.430e+03	4.320e+04	173.764 	5.650e+00	172.028		7.550e+01

Hardness:
e38/e175	2.730e+38+/-6.368e+39	2.170e+41	175.302 	4.973e+00	174.153		9.918e+01
p47/p1060	1.753e+02+/-2.738e+03	1.029e+05	172.222 	9.054e+00	174.976		6.225e+01
p112/p1060	6.392e+01+/-1.314e+03	4.935e+04	172.222 	5.929e+00	174.979		1.589e+01
p310/p1060	1.976e+01+/-5.037e+02	1.892e+04	172.222 	2.882e+00	174.361		5.113e+00
p761/p1060	3.291e+00+/-1.246e+00	1.842e+01	172.222 	1.391e+00	172.750		3.179e+00

Steepest Rise
------------
	Time		Slope(in log per hr)
----------------------------------------
e1  	173.4340		2696252.1956
e175	174.1354		64217.4453
p47 	173.7361		1830024.6588
p112	172.2049		815705.5297
p310	172.2049		312805.7104
p761	173.7500		106255.6580
p1060	173.7465		41966.8204
Two vertical red lines indicate the start and the end of the interruption. Purple hatched areas indicate that the satellite is in the radiation belt. The horizontal dashed line indicates P3 trigger level. If P3 level is higher than this level more than 2 hours, SCS 107 may be manually triggered.
		Avg			Max		Time		Min		Time		Value at Interruption Started
--------------------------------------------------------------------------------------------------------------------------
hrc	5.658e+03 +/- 5.725e+03		3.016e+04	173.699		6.051e+02	172.855		1.670e+04
Two vertical red lines indicate the start and the end of the interruption. Purple hatched areas indicate that the satellite is in the radiation belt. The red horizontal dashedline indicates SCS 107 limits. If the HRC shield rate/256 goes above 248, automatic SCS 107 is triggered.
The follwoing plots are copied from ACIS Threshold Corssings Page. For more details, please refer to Using ACIS to detect and report high radiation conditions


GOES-15 data are taken from NOAA site (http://goes.ngdc.noaa.gov).
| P1 | .8 - 4.0 | MeV protons (Counts/cm2 sec sr MeV) Uncorrected |
| P2 | 4.0 - 9.0 | MeV protons (Counts/cm2 sec sr MeV) Uncorrected |
| P5 | 40.0 - 80.0 | MeV protons (Counts/cm2 sec sr MeV) Uncorrected |
		Avg			Max		Time		Min		Time		Value at Interruption Started
--------------------------------------------------------------------------------------------------------------------------
p1	1.510e+03 +/- 3.625e+03		4.210e+04	173.795		7.110e+00	172.146		6.620e+03
p2	8.559e+01 +/- 1.747e+02		1.840e+03	173.792		2.180e-01	171.955		3.510e+02
p5	1.449e-02 +/- 7.324e-03		7.600e-02	173.851		3.930e-03	173.038		2.320e-02
Two vertical red lines indicate the start and the end of the interruption. Purple hatched areas indicate that the satellite is in the radiation belt. The red horizontal dashed lines indicate SCS 107 limits. If GOES P2 or P5 levels go above these levels, SCS 107 may be manually triggered.