| Science Run Stop: | 2017:09:06:03:30 |
| Science Run Start: | 2017:09:09:06:04 |
| Interruption: | 207.7ks |
| Triggered by: | auto |
Go to:
ACE Plot (E38/E175, P47/P112/P310/P761/P1060, Anisotopy)
HRC Plot (HRC Shield Rate)
GOES-15 Plot (P1/P2/P5)
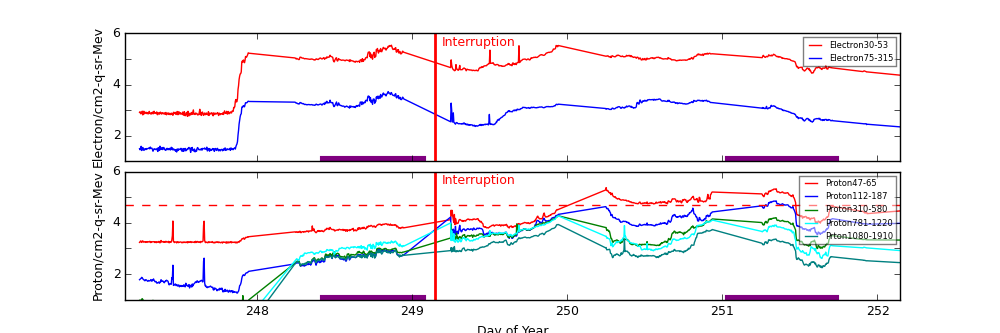
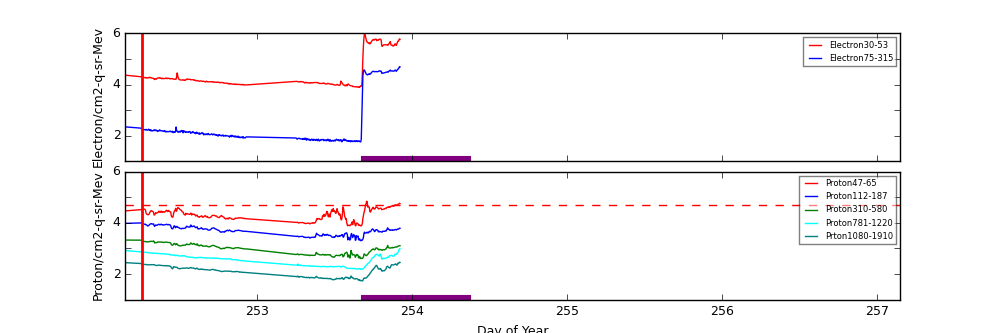
ACE radiation data are plotted around periods when science runs were interrupted. Plots start exactly 2 days before the interruption started. The top panel shows differential fluxes of electrons 38-53 and 175-315 (particles/cm2-s-ster-MeV), the middle panel shows differential fluxes of protons 47-65, 112-187, and 310-580 (particles/cm2-s-ster-MeV).
Data Period  (dom): 247.1458 - 257.1458
Interruption (dom): 249.1458 - 252.2528

			Avg		 Max		Time	Min		Time		Value at Interruption Started
-----------------------------------------------------------------------------------------------
e38 		8.767e+04+/-1.125e+05	9.590e+05	253.691 	5.740e+02	247.549		5.790e+05
e175		2.556e+03+/-7.105e+03	4.990e+04	253.917 	2.240e+01	247.569		4.890e+04
p47 		2.975e+04+/-3.902e+04	2.370e+05	250.250 	1.600e+03	247.799		5.670e+04
p112		7.581e+03+/-1.155e+04	7.160e+04	251.347 	1.810e+01	247.868		6.130e+03
p310		2.426e+03+/-3.346e+03	1.890e+04	249.941 	1.820e+00	247.868		1.280e+03
p761		1.823e+03+/-2.673e+03	1.880e+04	249.941 	4.690e-01	247.882		9.790e+02
p1060		7.482e+02+/-1.175e+03	8.640e+03	249.941 	1.280e-01	247.847		2.860e+02

Hardness:
e38/e175	8.511e+01+/-5.124e+01	7.639e+02	249.500 	4.033e+00	253.677		1.184e+01
p47/p1060	1.155e+03+/-3.384e+03	6.448e+04	247.455 	3.331e+00	249.691		1.983e+02
p112/p1060	4.161e+01+/-8.372e+01	1.646e+03	247.656 	7.793e-01	248.403		2.143e+01
p310/p1060	6.768e+00+/-5.840e+00	4.506e+01	247.903 	9.170e-01	248.278		4.476e+00
p761/p1060	2.826e+00+/-8.570e-01	1.201e+01	249.246 	1.096e+00	248.496		3.423e+00

Steepest Rise
------------
	Time		Slope(in log per hr)
----------------------------------------
e1  	253.6736		1141071.7374
e175	253.6701		44687.1864
p47 	250.2326		284400.9315
p112	251.2639		61800.2024
p310	251.2639		13800.0452
p761	249.2292		11892.0389
p1060	249.9167		3252.0107
Two vertical red lines indicate the start and the end of the interruption. Purple hatched areas indicate that the satellite is in the radiation belt. The horizontal dashed line indicates P3 trigger level. If P3 level is higher than this level more than 2 hours, SCS 107 may be manually triggered.
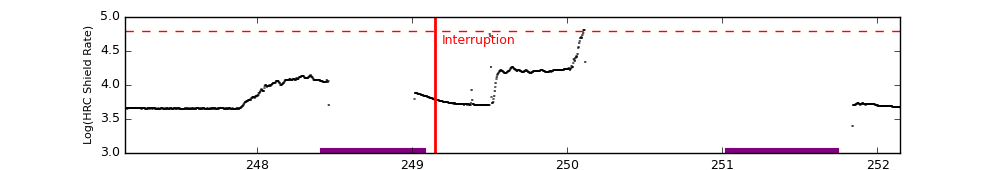
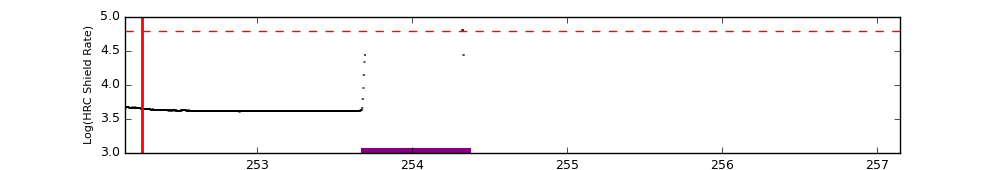
		Avg			Max		Time		Min		Time		Value at Interruption Started
-----------------------------------------------------------------------------------------------
hrc	7.622e+03 +/- 7.078e+03		6.528e+04	250.104		1.436e+02	255.747		6.066e+03
Two vertical red lines indicate the start and the end of the interruption. Purple hatched areas indicate that the satellite is in the radiation belt. The red horizontal dashedline indicates SCS 107 limits. If the HRC shield rate/256 goes above 248, automatic SCS 107 is triggered.
The follwoing plots are copied from ACIS Threshold Corssings Page. For more details, please refer to Using ACIS to detect and report high radiation conditions


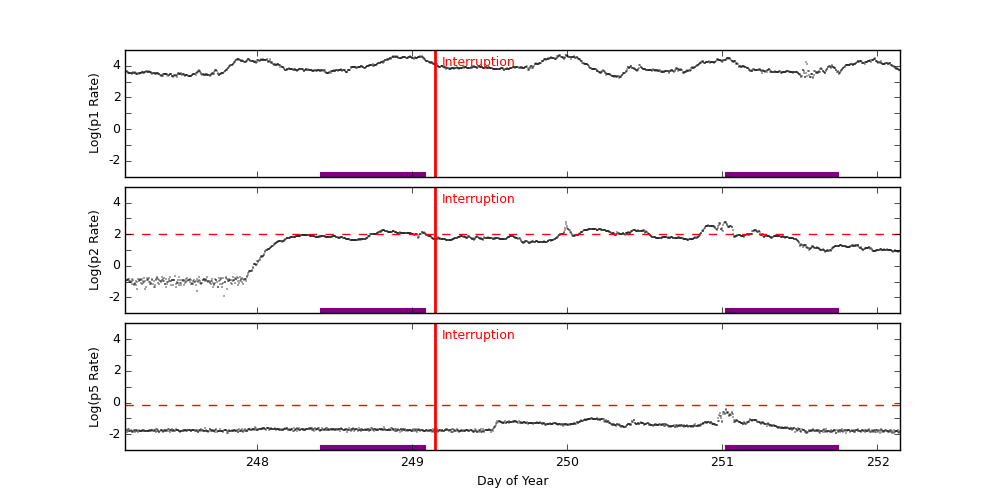
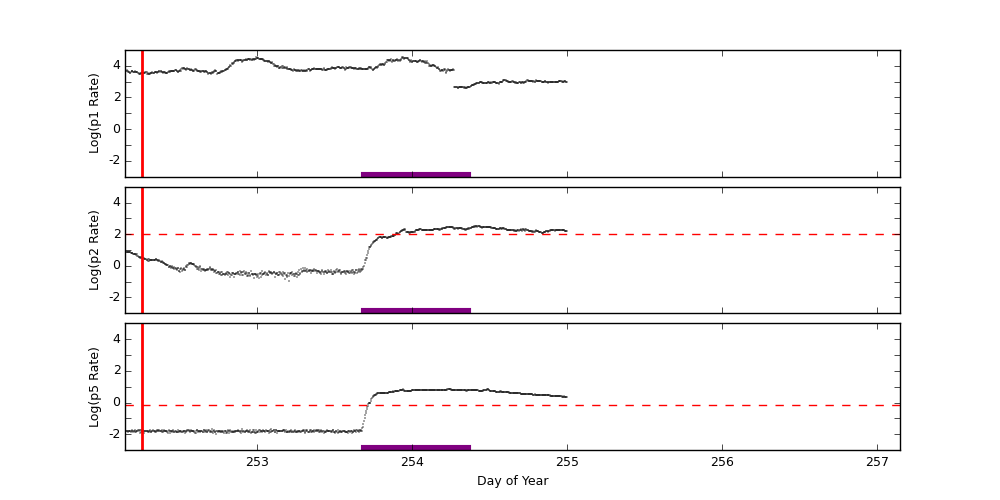
GOES-15 data are taken from NOAA site (http://goes.ngdc.noaa.gov).
| P1 | .8 - 4.0 | MeV protons (Counts/cm2 sec sr MeV) Uncorrected |
| P2 | 4.0 - 9.0 | MeV protons (Counts/cm2 sec sr MeV) Uncorrected |
| P5 | 40.0 - 80.0 | MeV protons (Counts/cm2 sec sr MeV) Uncorrected |
		Avg			Max		Time		Min		Time		Value at Interruption Started
-----------------------------------------------------------------------------------------------
p1	1.066e+04 +/- 9.195e+03		4.740e+04	249.948		1.700e+03	251.587		1.260e+04
p2	5.540e+01 +/- 7.444e+01		6.260e+02	251.017		1.210e-02	247.785		5.180e+01
p5	2.927e-02 +/- 2.827e-02		3.760e-01	251.021		1.100e-02	252.736		1.770e-02
Two vertical red lines indicate the start and the end of the interruption. Purple hatched areas indicate that the satellite is in the radiation belt. The red horizontal dashed lines indicate SCS 107 limits. If GOES P2 or P5 levels go above these levels, SCS 107 may be manually triggered.
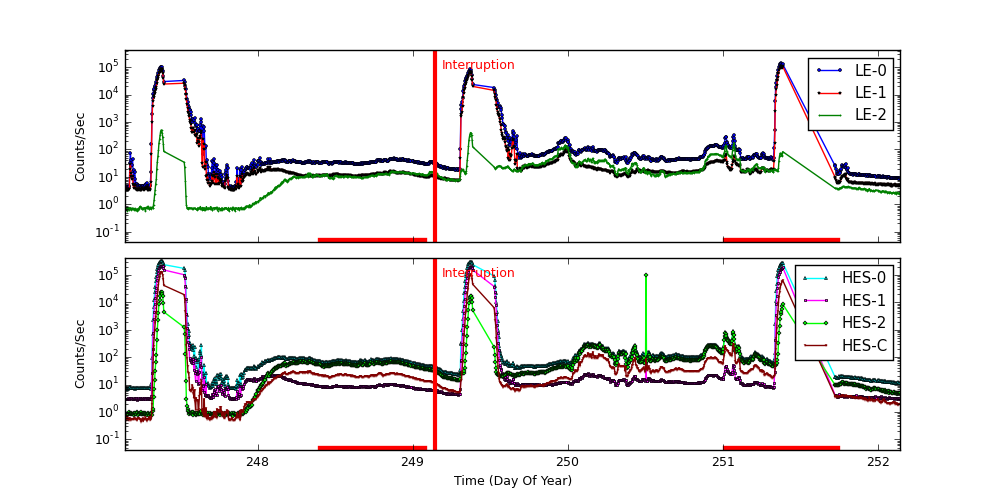
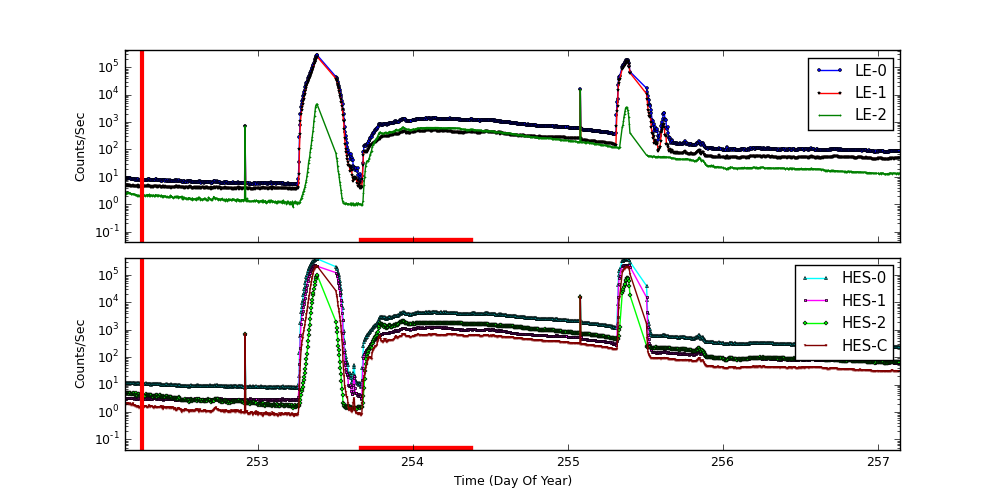
          Avg                    Max             Time        Min             Time        Value at Interruption Started
-----------------------------------------------------------------------------------------------
LE-0:  3.880e+03 +/- 2.054e+04	2.781e+05	    253.385		4.090e+00	    247.826	      4.460e+00
LE-1:  3.099e+03 +/- 1.769e+04	2.438e+05	    253.385		3.223e+00	    247.826	      3.504e+00
LE-2:  1.182e+02 +/- 4.260e+02	1.512e+04	    255.083		5.630e-01	    247.277	      7.880e-01
HES-0: 1.020e+04 +/- 4.959e+04	3.880e+05	    253.385		7.012e+00	    247.860	      7.083e+00
HES-1: 5.960e+03 +/- 3.126e+04	2.278e+05	    255.374		2.575e+00	    252.917	      2.998e+00
HES-2: 1.008e+03 +/- 6.245e+03	1.003e+05	    253.385		7.370e-01	    247.843	      8.810e-01
HES-C: 3.004e+03 +/- 1.965e+04	2.105e+05	    253.385		4.450e-01	    247.250	      5.990e-01
Two vertical red lines indicate the start and the end of the interruption. Red hatched areas indicate that the satellite is in the radiation belt.