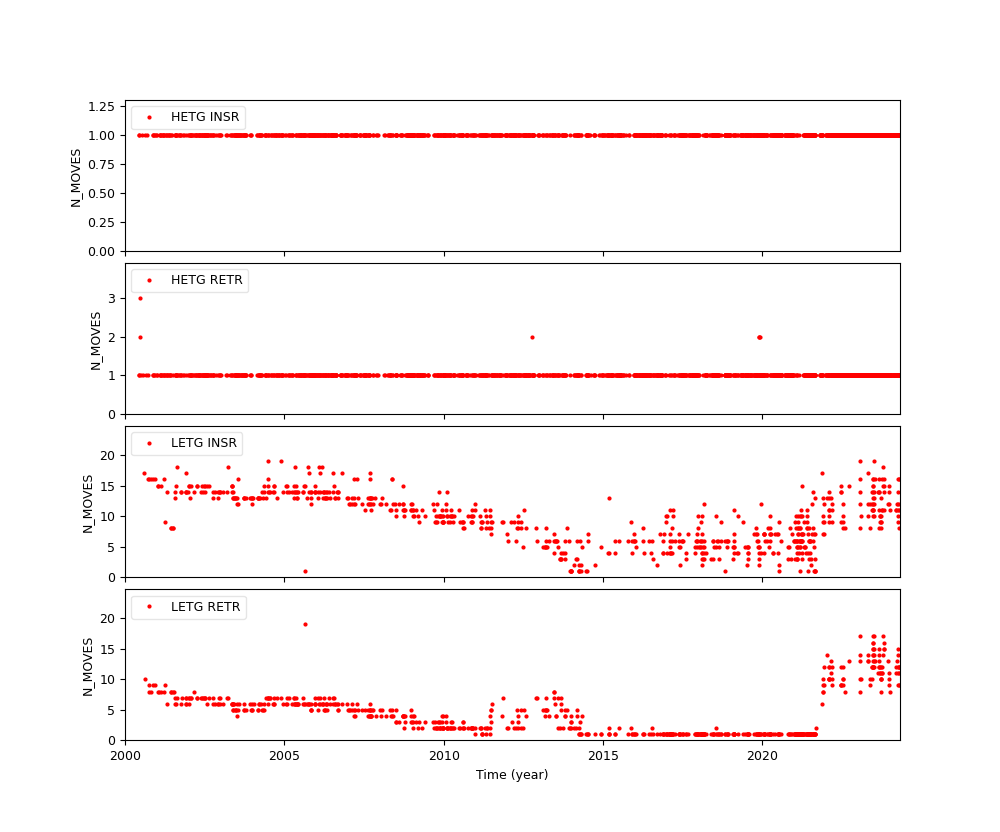

This page tracks the insertions and retractions of the LETG and HETG. The table below shows the recent movements and the "All Data" will show all data since year 2000.
| DIRECTION | GRATING | START_TIME | START_VCDU | STOP_TIME | STOP_VCDU | SUMMARY | PLOT |
| INSR | LETG | 2025279.18142100 | 5801181 | 2025279.18171600 | 5801866 | Summary | Plot |
| RETR | LETG | 2025279.22571700 | 5867429 | 2025279.23000200 | 5868074 | Summary | Plot |
| INSR | HETG | 2025280.03363800 | 5932837 | 2025280.03390800 | 5933426 | Summary | Plot |
| RETR | HETG | 2025280.16451800 | 6117501 | 2025280.16474800 | 6118091 | Summary | Plot |
| INSR | HETG | 2025281.13362900 | 6410463 | 2025281.13390000 | 6411053 | Summary | Plot |
| RETR | HETG | 2025282.00104100 | 6558957 | 2025282.00131200 | 6559545 | Summary | Plot |
| INSR | HETG | 2025282.19180300 | 6827609 | 2025282.19203300 | 6828195 | Summary | Plot |
| INSR | HETG | 2025285.10323900 | 7716103 | 2025285.10351000 | 7716689 | Summary | Plot |
| RETR | HETG | 2025286.06165600 | 7993399 | 2025286.06192700 | 7993987 | Summary | Plot |
| INSR | HETG | 2025288.02044900 | 8608705 | 2025288.02072000 | 8609293 | Summary | Plot |
| RETR | HETG | 2025288.22032600 | 8889359 | 2025288.22055800 | 8889949 | Summary | Plot |
| INSR | LETG | 2025289.06230200 | 9006339 | 2025289.06262100 | 9007112 | Summary | Plot |
| RETR | LETG | 2025289.11024200 | 9071821 | 2025289.11052700 | 9072466 | Summary | Plot |
| INSR | HETG | 2025290.17361400 | 9501135 | 2025290.17384400 | 9501723 | Summary | Plot |
| RETR | HETG | 2025291.13393200 | 9782881 | 2025291.13420200 | 9783471 | Summary | Plot |
| INSR | HETG | 2025292.04125600 | 9987387 | 2025292.04152800 | 9987977 | Summary | Plot |
| RETR | HETG | 2025292.21512800 | 10235237 | 2025292.21535900 | 10235825 | Summary | Plot |
| INSR | HETG | 2025293.08572200 | 10391157 | 2025293.08595300 | 10391747 | Summary | Plot |
| RETR | HETG | 2025294.04350300 | 10666905 | 2025294.04373300 | 10667495 | Summary | Plot |
| INSR | HETG | 2025296.00311400 | 11284159 | 2025296.00334500 | 11284748 | Summary | Plot |
| EMF_AVG_LONG |
f4HPOSARO |
N_LONG |
|
| EMF_AVG_SHORT |
f4HPOSARO |
N_MOVES |
|
| EMF_MAX_LONG |
f4HPOSBRO |
N_SHORT |
|
| EMF_MAX_SHORT |
i4HPOSARO |
OBC_ERRS |
|
| EMF_MIN_LONG |
i4HPOSBRO |
T_LONG |
|
| EMF_MIN_SHORT |
Last Update: Sept 17, 2021
If you have any questions about this page, please contact swolk@cfa.harvard.edu.