Click an image to enlarge it.
The slopes are in Mag / day.
| ACIS |

Slope: #MAG_SLP1# STD: #MAG_STD1#
|

Slope: #MAG_SLP2# STD: #MAG_STD2#
|

Slope: #MAG_SLP3# STD: #MAG_STD3#
|
|
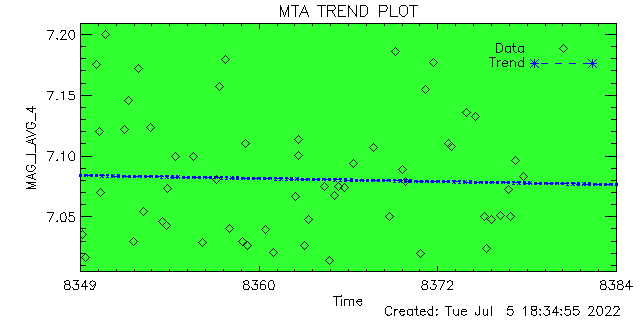
Slope: #MAG_SLP4# STD: #MAG_STD4#
|

Slope: #MAG_SLP5# STD: #MAG_STD5#
|

Slope: #MAG_SLP6# STD: #MAG_STD6#
|
|
HRCI |

Slope: #MAG_SLP7# STD: #MAG_STD7#
|
Slope: #MAG_SLP8# STD: #MAG_STD8#
|

Slope: #MAG_SLP9# STD: #MAG_STD9#
|
Slope: #MAG_SLP10# STD: #MAG_STD10#
|
| HRCS |

Slope: #MAG_SLP11# STD: #MAG_STD11#
|

Slope: #MAG_SLP12# STD: #MAG_STD12#
|
Slope: #MAG_SLP13# STD: #MAG_STD13#
|

Slope: #MAG_SLP14# STD: #MAG_STD14#
|
Click an image to enlarge it.
The slopes are per day.
| Slot | Pos_Err | Delta Magnitude | Angynea | Angznea |
|---|
| 0 |

Slope: #POS_SLP0# STD: #POS_STD0#
|
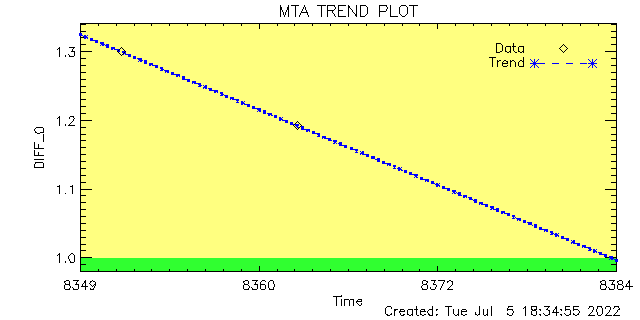
Slope: #DIFF_SLP0# STD: #DIFF_STD0#
|

Slope: #ANGY_SLP0# STD: #ANGY_STD0#
|
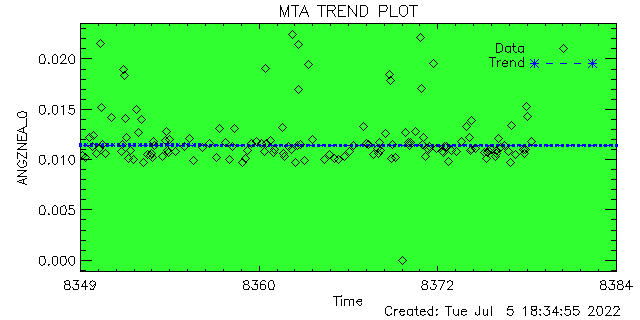
Slope: #ANGZ_SLP0# STD: #ANGZ_STD0#
|
| 1 |

Slope: #POS_SLP1# STD: #POS_STD1#
|
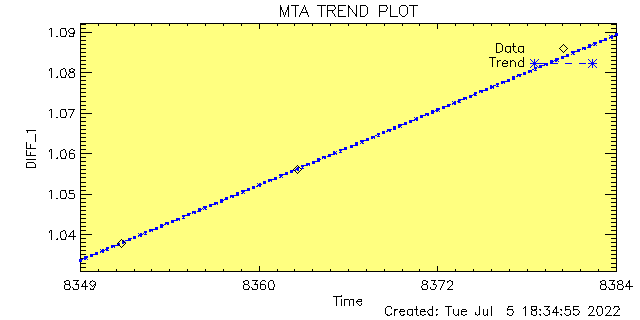
Slope: #DIFF_SLP1# STD: #DIFF_STD1#
|
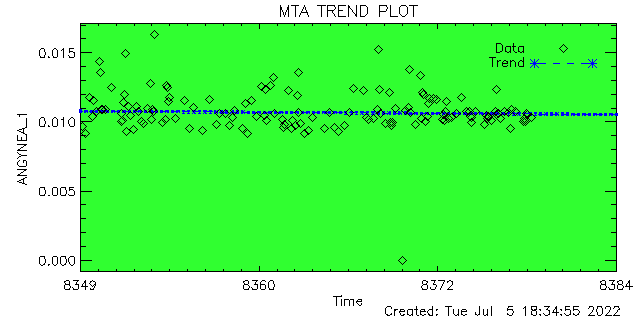
Slope: #ANGY_SLP1# STD: #ANGY_STD1#
|

Slope: #ANGZ_SLP1# STD: #ANGZ_STD1#
|
| 2 |

Slope: #POS_SLP2# STD: #POS_STD2#
|
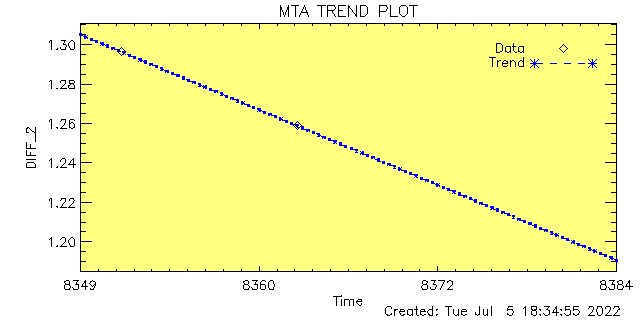
Slope: #DIFF_SLP2# STD: #DIFF_STD2#
|
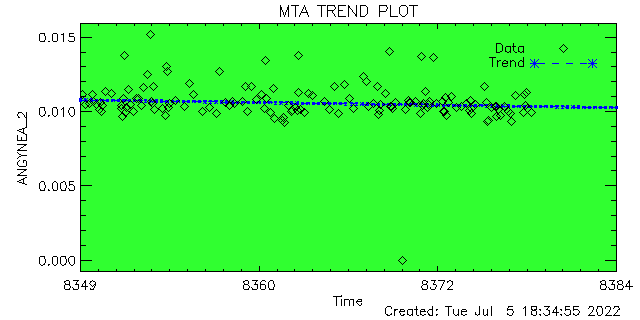
Slope: #ANGY_SLP2# STD: #ANGY_STD2#
|

Slope: #ANGZ_SLP2# STD: #ANGZ_STD2#
|
| 3 |

Slope: #POS_SLP3# STD: #POS_STD3#
|

Slope: #DIFF_SLP3# STD: #DIFF_STD3#
|

Slope: #ANGY_SLP3# STD: #ANGY_STD3#
|

Slope: #ANGZ_SLP3# STD: #ANGZ_STD3#
|
| 4 |
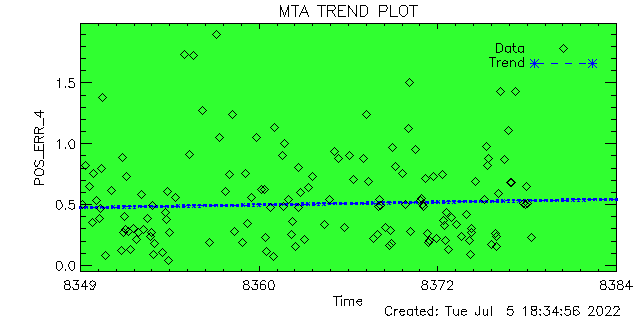
Slope: #POS_SLP4# STD: #POS_STD4#
|

Slope: #DIFF_SLP4# STD: #DIFF_STD4#
|

Slope: #ANGY_SLP4# STD: #ANGY_STD4#
|

Slope: #ANGZ_SLP4# STD: #ANGZ_STD4#
|
| 5 |

Slope: #POS_SLP5# STD: #POS_STD5#
|

Slope: #DIFF_SLP5# STD: #DIFF_STD5#
|
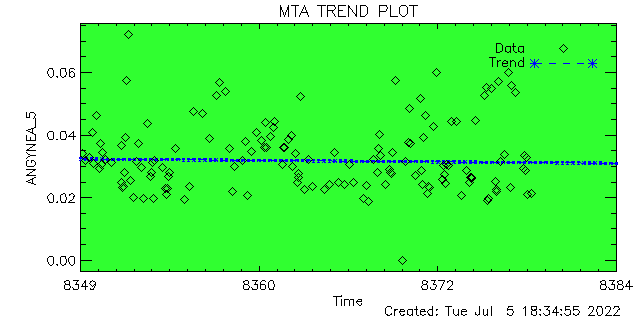
Slope: #ANGY_SLP5# STD: #ANGY_STD5#
|

Slope: #ANGZ_SLP5# STD: #ANGZ_STD5#
|
| 6 |

Slope: #POS_SLP6# STD: #POS_STD6#
|

Slope: #DIFF_SLP6# STD: #DIFF_STD6#
|

Slope: #ANGY_SLP6# STD: #ANGY_STD6#
|

Slope: #ANGZ_SLP6# STD: #ANGZ_STD6#
|
| 7 |

Slope: #POS_SLP7# STD: #POS_STD7#
|

Slope: #DIFF_SLP7# STD: #DIFF_STD7#
|

Slope: #ANGY_SLP7# STD: #ANGY_STD7#
|

Slope: #ANGZ_SLP7# STD: #ANGZ_STD7#
|


