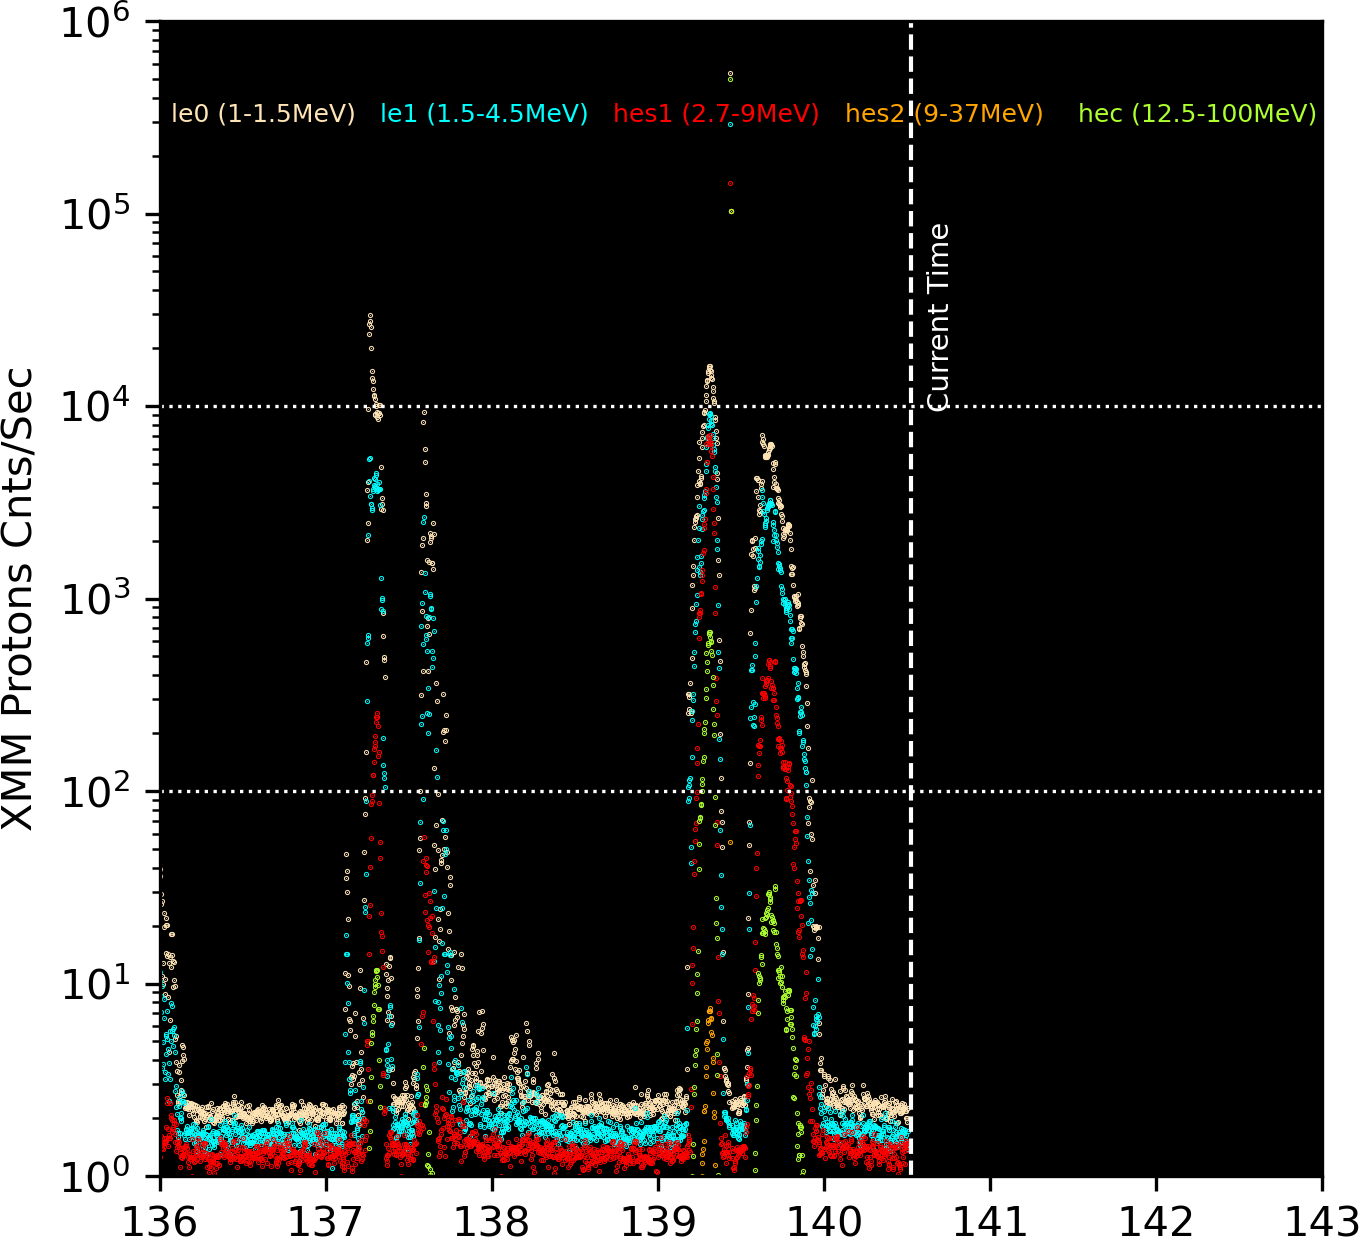
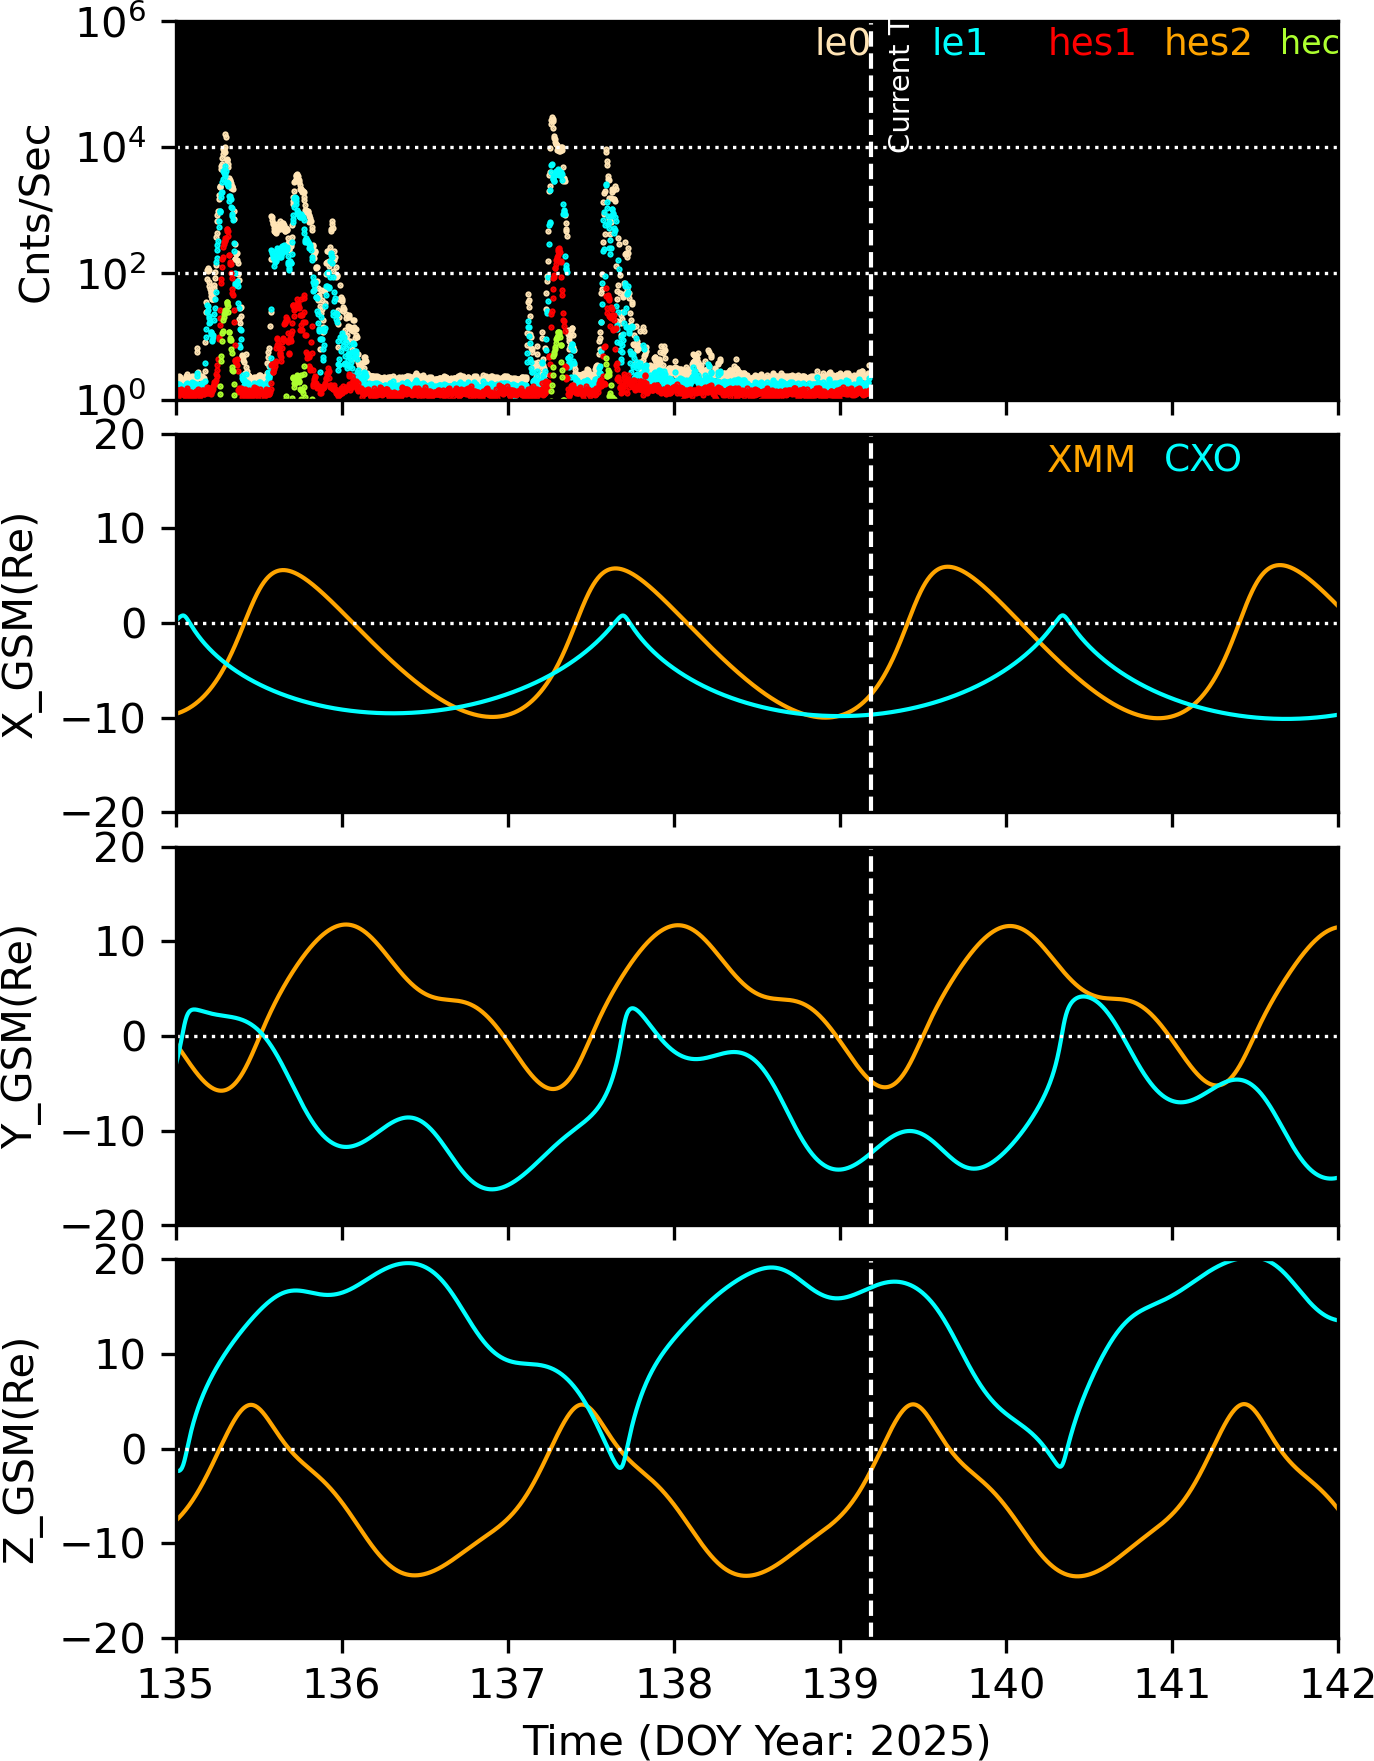
                                        Most recent XMM radiation observations
                                 Differential Flux particles/cm2-s-ster-MeV

 UT Date   Time    ---------------------------------- Protons MeV -------------------------------
                          LE1          LE2         HES1         HES2         HESC
  YR MO DA HHMM          1-1.5       1.5-4.5       2.7-9        9-37       12.5-100
2025-Jun20-11:30      555.941        0.419       82.658        0.474        5.746
2025-Jun20-12:30     2025.273        0.435      309.772        0.513       18.417
2025-Jun20-13:30     1824.398        0.427      292.093        0.468       15.823
2025-Jun20-14:30     2315.140        0.424      396.766        0.519       22.810
2025-Jun20-15:30     1745.719        0.404      167.361        0.493       10.657
2025-Jun20-16:30     1558.145        0.420      172.841        0.485       11.965
2025-Jun20-17:30      796.046        0.417       91.230        0.467        6.160
2025-Jun20-18:30      507.226        0.406       44.701        0.450        3.213
2025-Jun20-19:30      305.730        0.402       27.126        0.445        1.787
2025-Jun20-20:30      167.344        0.407       12.088        0.453        1.019
2025-Jun20-21:30      134.206        0.386       18.391        0.433        1.368
2025-Jun20-22:30       41.528        0.441        7.743        0.426        0.680
2025-Jun20-23:30        6.827        0.379        2.166        0.421        0.417
2025-Jun21-00:30        1.889        0.380        1.313        0.433        0.366
2025-Jun21-01:30        1.743        0.408        1.209        0.438        0.347
2025-Jun21-02:30        1.558        0.378        1.180        0.481        0.364
2025-Jun21-03:30        1.928        0.393        1.315        0.432        0.353
2025-Jun21-04:30        1.853        0.378        1.251        0.435        0.376
2025-Jun21-05:30        1.642        0.433        1.169        0.414        0.358
2025-Jun21-06:30        1.893        0.437        1.134        0.427        0.362
2025-Jun21-07:30        1.615        0.417        1.278        0.400        0.333
2025-Jun21-08:30        1.786        0.384        1.205        0.437        0.356
2025-Jun21-09:30        1.736        0.381        1.252        0.407        0.345
The following plots show the orbits of CXO and XMM in GSM coordinates. The left plot is in X-Y plane, and the right plot is in X-Z plane. If the orbit is in green, the satellite is in the solar wind area, if it is in light blue, the satellite is in magnetosheath, and if it is in yellow, the satellite is in magnetosphere.
The periods of the plotted orbits are +/-1.35 days from the current satellite positions (*), and the orange pentagon (*) mark the positions of one day ago.
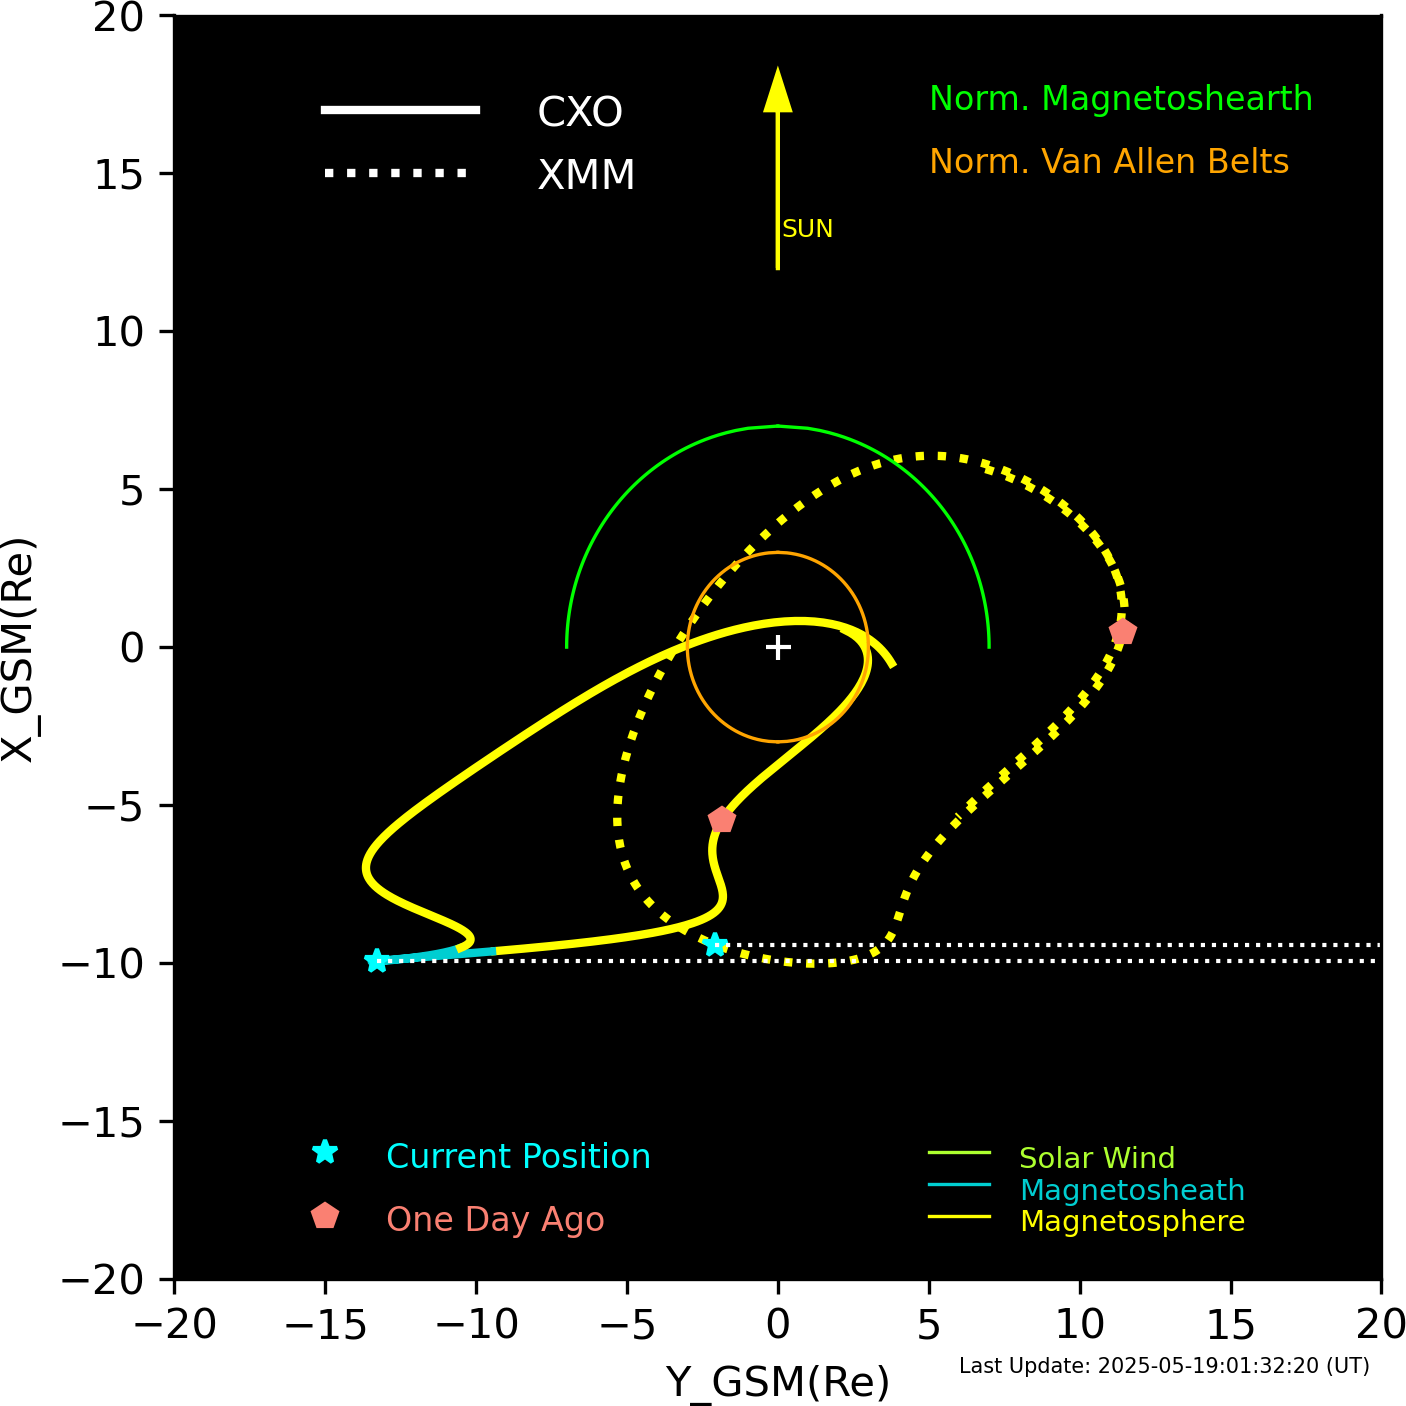
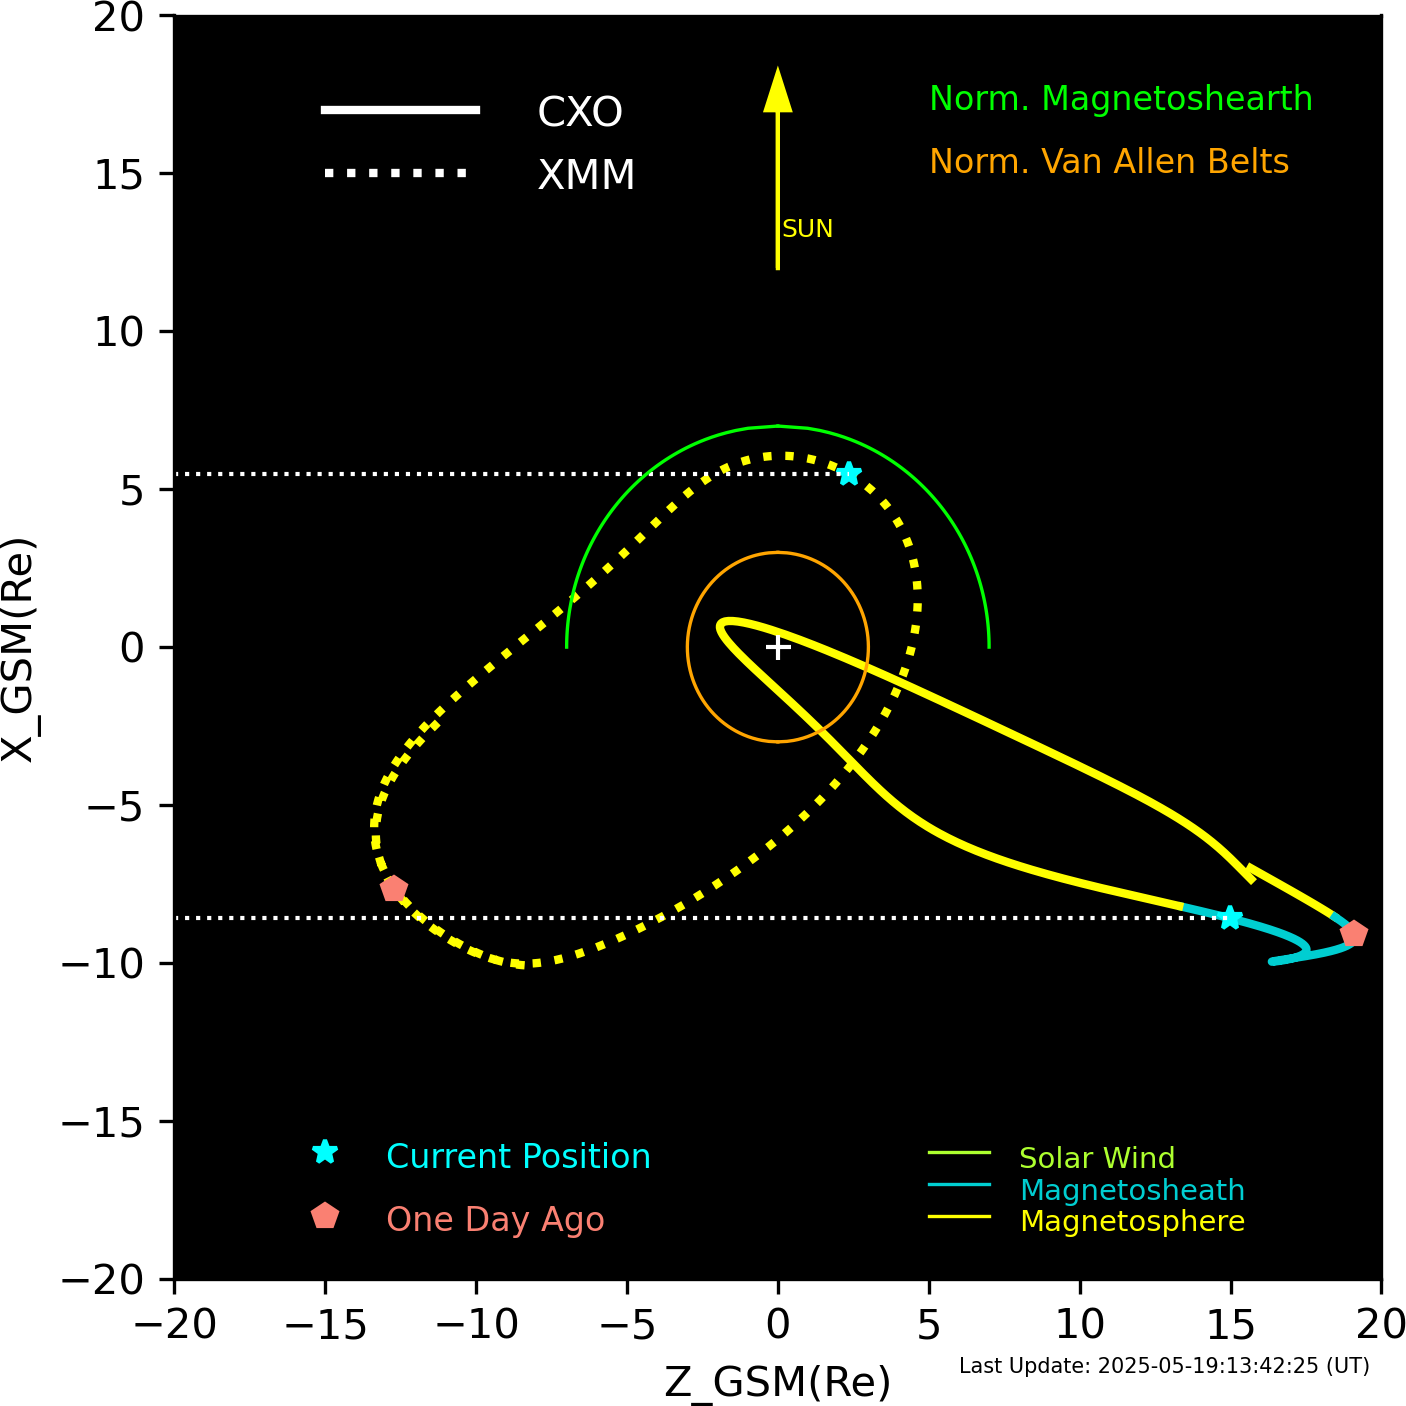
XMM and CXO orbits in GSM coordinates.
Email problems to: swolk
(Scott Wolk)
...it is all his fault