Previous Next Contents
Instruments: HETG
HETG Calibration
The Chandra Calibration Workshop held in early November 2002 provided a useful forum for discussing Chandra calibration issues and included a session on the Chandra gratings [1]. Some items of note with respect to HETG are summarized here.
A growing contamination layer on ACIS reduces the HETG long wavelength effective area; representative modeled transmission curves are plotted in Figure 8 (Fig in ACIS article) for the MEG wavelength range. Edges in the contaminant spectrum have been identified and include Fluorine (~18Å), Oxygen (~23Å), and Carbon (~43Å, not shown). This time-dependant contamination layer is an additional term that needs to be included in HETG ARF files. This will be transparent to the user when a new version of the mk[g]arf tool and appropriate CALDB files are released in the future. In the meantime, software is available through the CXC to correct for or include knowledge of this contamination in analyses. For more information, see the Calibration Workshop[1] presentations by Plucinsky; Chartas; and Marshall.
Another "ARF" effect is the likely reduction of front-illuminated (FI) CCD effective quantum efficiency (QE) due to random and occasional cosmic ray events, which deposit a large amount of charge in the device. This effectively "splotches out" a fraction of the active area for one or more frames. In the process, any real X-rays that may have interacted in the region are not detected. More quantitative details will be coming, but roughly expect an energy-independent factor of 0.92 to 0.95 to be applied to the QE of FI CCDs. This is relevant to HETG because both back-illuminated (BI) and FI CCDs are used in the ACIS-S grating readout and resulting grating ARFs. At present, without the correction, slight discontinuities and plus-side versus minus-side differences may be expected where statistics allow.
Finally, more accurate grating RMFs (line spread functions) can be created by using mkgrmf. These new custom-created RMFs are made up of two Gaussian and two Lorentzian components based on high-count MARX grating simulations. For more details see the calibration workshop poster by Ishibashi[1].
Calibration progress will continue, so please refer to the CXC and Calibration web pages for the latest information and calibration products.
HETG Science: Ne and Fe
A "dispersion fest" of sorts was held in October 2002 at the Mullard Space Science Laboratory (MSSL) in the UK --- more formally known as the "High Resolution X-ray Spectroscopy with XMM-Newton and Chandra" workshop. Quite a range of topics was covered and many of the contributions are available on the web[2]. A few, containing information about the Ne and Fe lines, are mentioned here (numbered references are to talks on the two websites below).
Plasma diagnostics using the forbidden to intercombination lines of He-like triplets are common: the f/i ratio can indicate the plasma density. For the Ne triplet around 13.5 Å, however, lines of Fe can blend with the Ne lines, complicating measurements. Ness[1,2] compares the HEG, MEG, LETG, and RGS views of this spectral region, finding that the spectra are consistent given the underlying high-resolution view provided by the HEG.

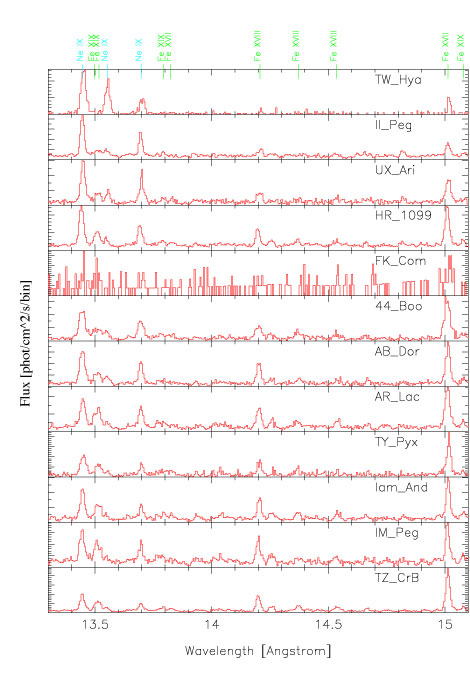
FIGURE 14: Gallery of spectra for a very diverse collection of cool
stars. The Ne IX triplet lines (13.44, 13.55, 13.70 Å) are at the
left, and Fe XVII, which has a similar emissivity distribution with
temperature is at the right (15.02Å). Spectra have been ordered by
relative strength of Ne IX to Fe XVII, a mainly abundance-dependent
ratio.
Ne and Fe emission from stellar coronae are summarized in
Figure 14 taken from Huenemoerder[2]. The Ne triplet lines
are on the left, and a variety of Fe lines are indicated from
the triplet to the Fe XVII line at 15 Å . The stars are arranged here in order of their Ne IX to Fe XVII flux, which depends largely on the Ne/Fe abundance ratio. The flux observed is averaged over the whole star and all emitting regions. In his presentation, Guedel[2] noted that there are a range of volumes of different density in a corona. If the distribution of these densities goes as a power law, then the global f/i ratio, which we measure in data such as these, is more a measure of the power-law index than the average emission density.
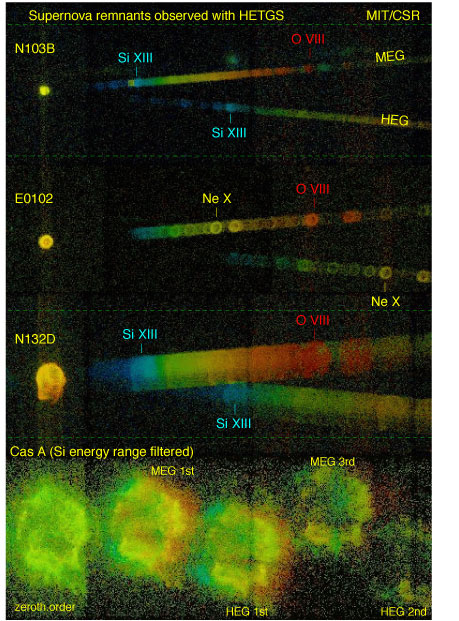
Supernova remnants also show various amounts of Ne and Fe. Four SNR observed with the HETGS are shown in Figure 15, from Dewey[2]. Note that for E0102 there is little Fe emission and so Ne X (and Ne IX just to its right) is clearly visible against weaker lines and continuum. In the case of N103B and N132D, however, there is significant Fe emission, which fills in the range between Si XIII and O VIII and swamps the Ne emission. Note that because of its large size, the image of Cas A is shown here only in Si line emission.
Dan Dewey , for the HETG Team
References
[1] Chandra Calibration Workshop:
http://cxc.harvard.edu/ccw/proceedings/02_proc/index.html
[2] High Resolution X-ray Spectroscopy with XMM-Newton and Chandra:
http://www.mssl.ucl.ac.uk/~gbr/rgs_workshop/

FIGURE 15: Supernova remnants as observed in the HETG GTO program are
shown on the same scale.
Previous Next Contents

