Previous: LETG Contents Next: Submitting a Cycle 6
Instruments: HETG
Physics at a Glance
In the past year some very nice HETG results have
been published. A small selection is presented here. Each spectrum
yields its basic "physics at a glance". X-ray line emission requires
excitation of atoms, for which the two most common mechanisms are: i)
through collision with hot electrons (a thermal plasma), and ii)
through ionization by an intense hard X-ray continuum flux (a
photoionized plasma, see Paerels et al). In general, a given type of
source is dominated by one or the other mechanism, e.g., stars,
supernova remnants, and clusters of galaxies generally include a
strong thermal component of emission. On the other hand, illuminated
accretion disks in X-ray binaries and Seyfert galaxies often show
photoionized signatures. A Cataclysmic Variable (CV) is an X-ray
binary system whose compact object is not a glamorous neutron star or
black hole but instead a white dwarf, the degenerate remains (C-O or
O-Ne-Mg) of a low to middle mass star. In a recent paper, Mukai et
al. have shown that HETGS spectra of CVs show and roughly divide
between both of the main types of emission spectra mentioned
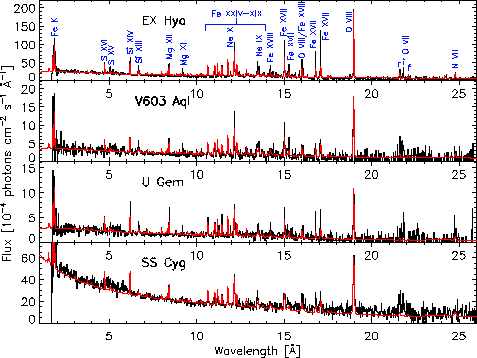
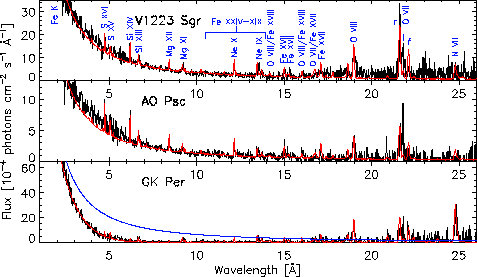
above. Figure 10 shows examples of both of these types of spectra
obtained from CVs. In the case of EX Hya, the emission is thermal and
well fit with a cooling flow model with only two free parameters: the
initial temperature and total mass flow rate. In this spectrum
hydrogen-like oxygen emission, O VIII, is dominant and an iron "forest"
of lines from ionization states XIX to XXIV is seen. In comparison,
the CV V1223 Sgr spectrum shows no clear iron XIX to XXIV lines and O
VII (helium-like oxygen) is more pronounced compared to the O VIII
line; this is similar to the spectrum of a Seyfert 2 galaxy. Which
characteristics of the CV system determine the X-ray spectral
character is still under investigation.
The bright X-ray continuum
emitted by a binary system has to pass through the intervening ISM
before we see it. On the way, absorption by not only neutral but
ionized atoms in the ISM leaves its mark on the spectrum. Looking at
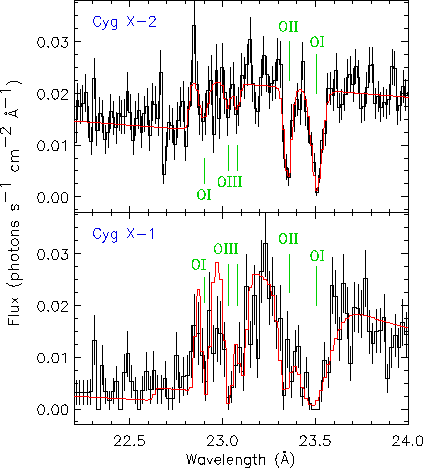
the oxygen Kshell absorption in a set of seven X-ray binaries, Juett,
Schulz, and Chakrabarty have created an O-K model consisting of two
edges and five absorption lines. Fig. 11 shows two examples, Cyg X-2
and Cyg X-1. Additionally the ionization fractions of O II and O III
in the ISM are measured, e.g., the ratio of O II to O I is constrained
to be of order 0.1. This work is useful for both studying the ISM and
to better remove ISM features from a source spectrum.

|

|
| FIGURE 10: The spectra of cataclysmic variables are seen to fall into two main types. The first (left panel) are represented by EX Hya, and demonstrate multi-T thermal or "cooling flow" line emission. The second type (right panel) are similar to V1223 Sgr, and show lines characteristic of a cooler plasma that is photoionized by a bright X-ray continuum. All plots are taken from Mukai et al (2003). |
In plots like Figure 10, the octave from 5 keV to 10 keV is relegated
to the 1.2 Å to 2.4 Å region and may seem to merely contain some
continuum and an iron line or two. In reality, there is a lot of
physics that can leave signatures in this high-energy region. A recent
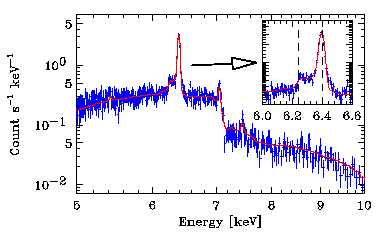
paper by Watanabe et al. shows a detailed spectrum and Monte Carlo
model for the massive binary GX 301-2 in this 5 to 10 keV range
(Figure 12). The bright Fe-K flourescent line at 6.4 keV scatters off
of cool electrons imparting to them a
recoil energy and "down scattering" the photon energy by as much as
0.156 keV for 180 degree back-scattering. The result is beautifully
shown in this spectrum by the plateau and "Compton shoulder" in the
6.2 to 6.4 keV region. Using their Monte Carlo simulations they are
able to fit the observed shoulder by adjusting metal abundance and
optical thickness of the scattering cloud, and to constrain the
temperature and geometrical distribution of the scattering
electrons. This HEG spectrum is a tasty appetizer for the spectra to
be obtained in 2005 from the X-ray Spectrometer (XRS) on board the
Astro-E2 observatory!
Dan Dewey for the HETG team
 |
| FIGURE 11:The bright continuum radiation from binary systems shows the imprint of the ISM along the line of sight. Absorption dips are seen in MEG spectra from neutral oxygen, O I, as well as singly and doubly ionized oxygen, O II and O III. For reference, the energy range shown is roughly 0.558 keV to 0.517 keV, left to right. From Juett, Schulz, and Chakrabarty (2004). |
 |
| FIGURE 12: HETGS observed and modeled spectra from GX 301-2. The Compton shoulder at 6.2 keV, just below the iron Kα fluorescent line at 6.4 keV, is the result of photons scattering off of cold (< 105 K) material around the source. From Watanabe et al. CXC Newsletter |
References
Paerels, F. B. S. & Kahn, S. M., 2003, ARA&A, 41,291
Mukai, K. et al. 2003, ApJ, 586, L77
Juett, A. M., Schulz, N. S., & Chakrabarty, D. 2004, ApJ submitted,
astro-ph/0312205.
Watanabe, S. et al. 2003, ApJ, 597, L37
Previous: LETG Contents Next: Submitting a Cycle 6
cxchelp@head.cfa.harvard.edu