 |
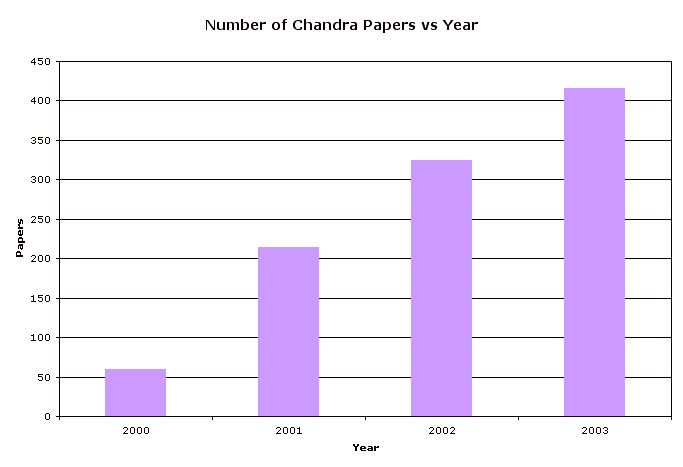
| FIGURE 14: The total number of Chandra-related papers per year. This counts only papers in refereed journals, but we include Chandra data from all types of proposals (GO, GTO, DDT, TOO and CAL). |
The CXC has been accumulating data on Chandra-related publications. In December 2002, the Chandra User's Committee suggested that the ChandraDirector's Office expand a study of publication metrics, and recently (Spring 2003), the Space Telescope Institute published a Newsletter article on Hubble Science Metrics. To allow for metrics as complete and flexible as is practical, the Chandra Data Archive (CDA) Group at the CXC has designed and populated a large bibliographic database, described in the previous article by Arnold Rots. The ADS is queried daily for publications related to Chandra or to X-ray astronomy. These publications are scanned and reviewed by hand. Publications are categorized by several different parameters and entered into the Bibliography Database. When any publication analyzes or refers to Chandra data, Chandra target ObsIDs are sought in the publication, or if necessary directly from the authors. (Authors please list relevant Chandra ObsIDs whenever feasible!) ObsID links allow for cross-correlation with the full CXC Observation Catalog, a database that links together the X-ray data, observation status and description (date, exposure time, instrument, etc.). ObsIDs are in turn linked to a Proposal Database containing the scientific category of the proposal, proposal type, etc. The Bibliography Database is kept within a couple of weeks of ADS updates, and has been backfilled to pre-launch.
The Chandra Bibliography Database thus allows for a large number of
publication statistics to be compiled. We are just beginning to study
and understand some of these, and we are immediately aware that while
a histogram may look simple, there are potentially many embedded
assumptions and complications. For instance, publication statistics
may include articles, books, theses, reviews, proceedings, circulars,
etc. These may be refereed or not. Categories of Chandra publications
include those that
1. present specific Chandra observations
2. refer to published results from Chandra
3. describe Chandra instrumentation, software, or operations
4. predict Chandra results
and a fifth category for publications that cannot be classified.
Any of these may also be flagged as presenting analysis
or modelling of previously published or reduced data, or
multiwavelength follow-up. The moral of this story is that a lot may
be folded into what looks like a simple statistic. With these caveats,
we provide here plots of some of the simplest preliminary publication
metrics. Library science afficionados can look forward to more
detailed information soon on CXC web pages.
 |
| FIGURE 14: The total number of Chandra-related papers per year. This counts only papers in refereed journals, but we include Chandra data from all types of proposals (GO, GTO, DDT, TOO and CAL). |
 |
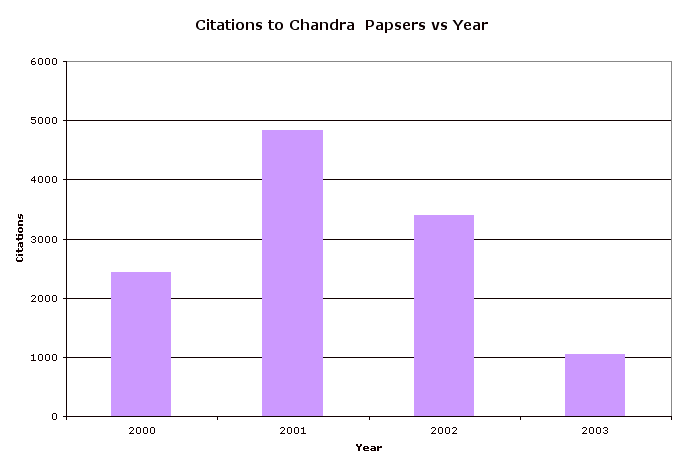
| FIGURE 15: The number of citations to Chandra-related papers (categories 1 and 2) published in the years shown. |
Paul J. Green and Mihoko Yukita