|
|
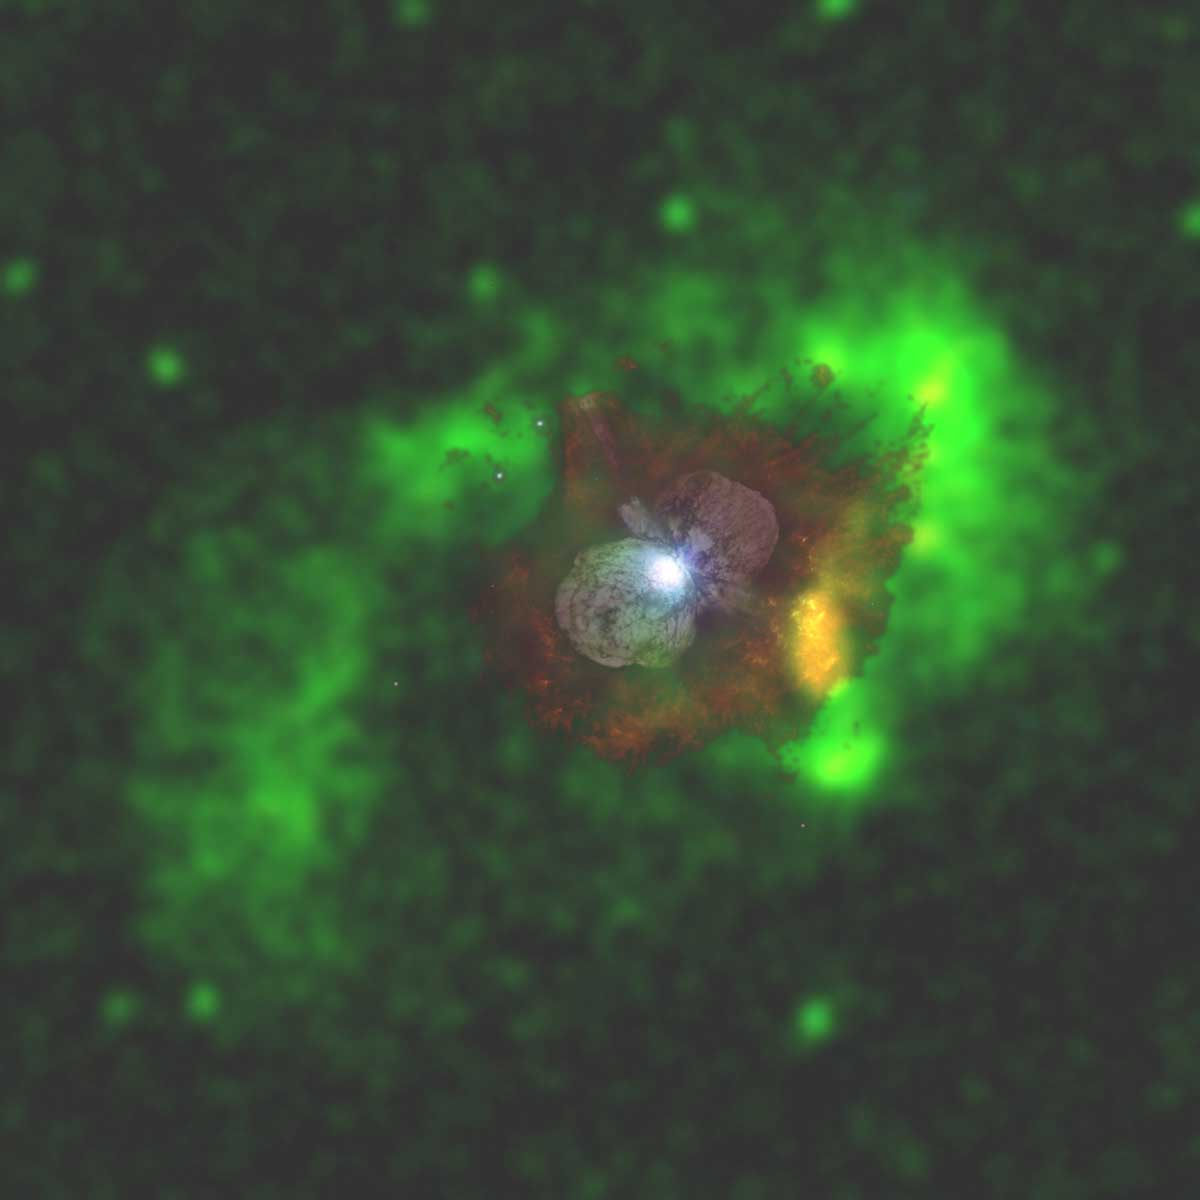
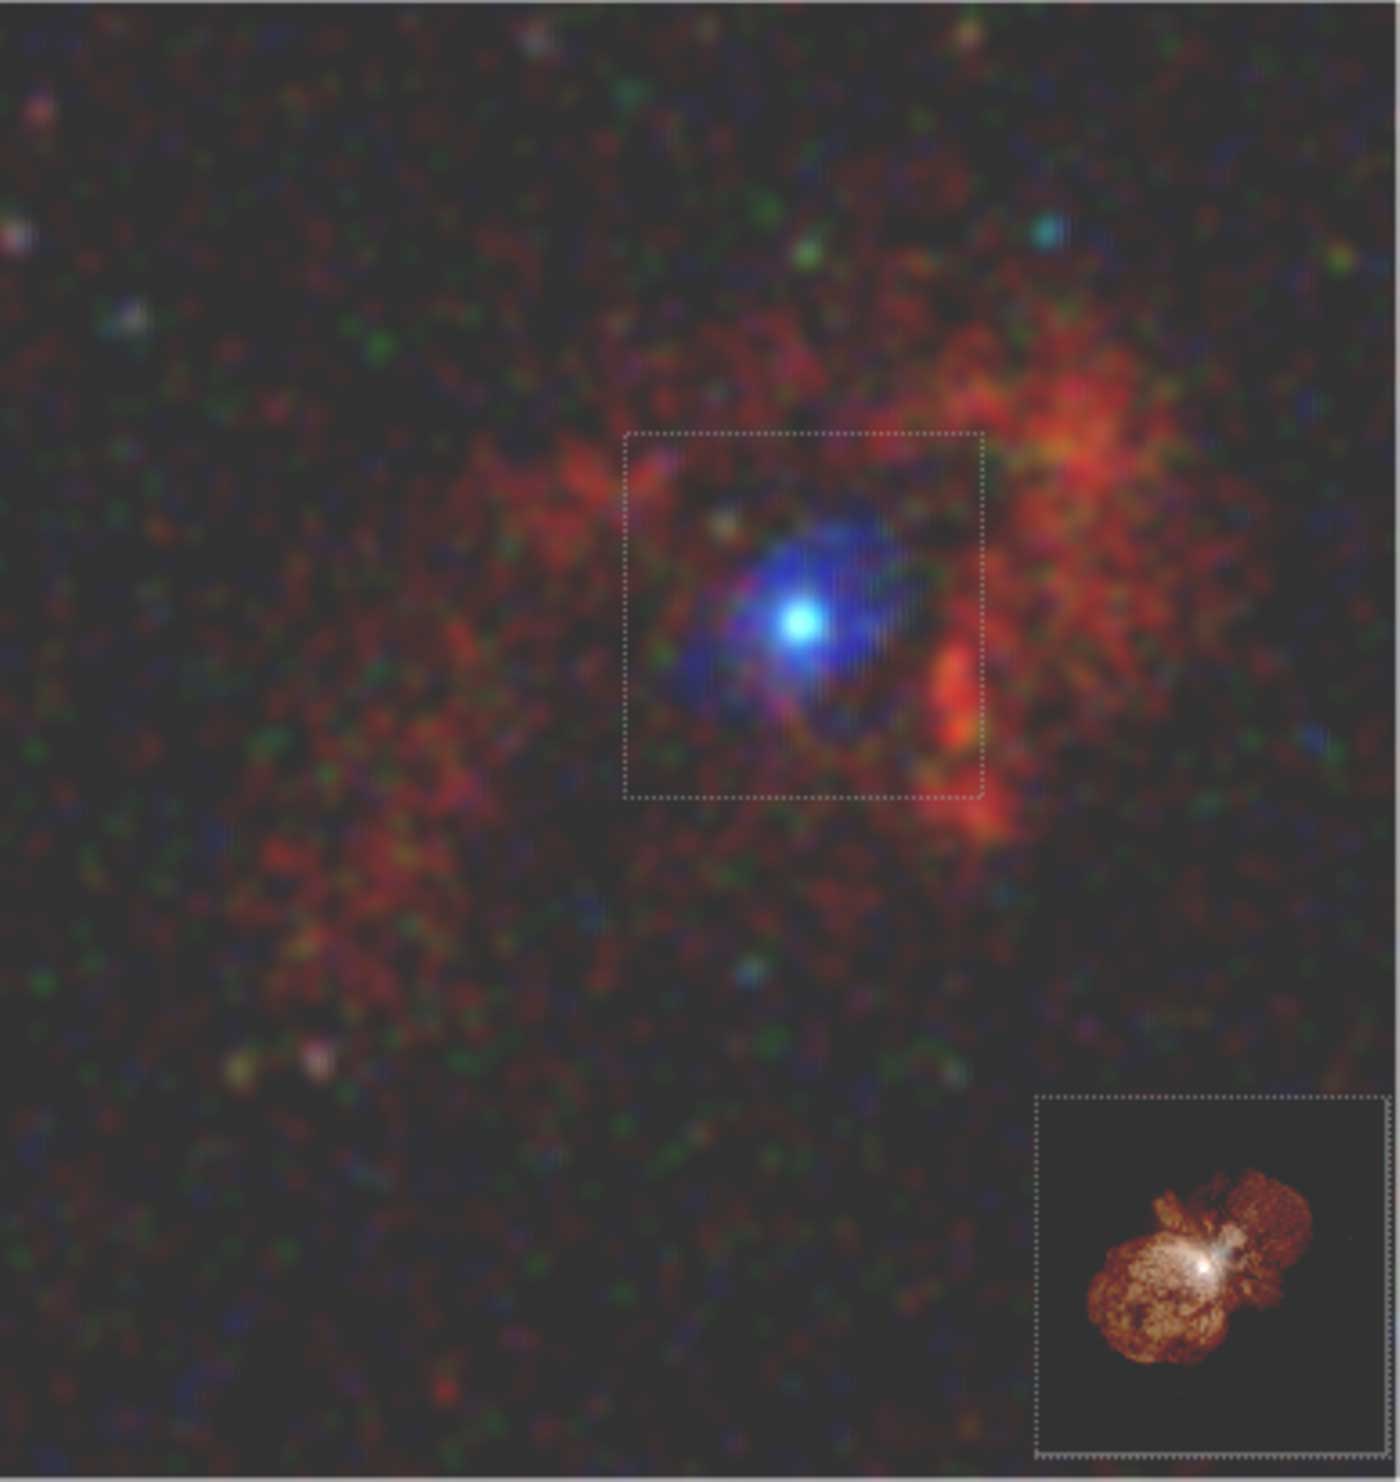
| Figure 1: Chandra image of Eta Carinae superimposed on an HST/WFPC2 image from Nathan Smith & Jon Morse (private communication). The X-ray image was made by merging the zeroth-order images from 5-100 ksec HETG observations. The X-ray image is color coded by photon energy (green-blue, soft-hard). | Figure 2: "True-color" Chandra image of Eta Carinae during the X-ray minimum. Eta Carinae is the blue-white source at the center of the image. The blue (hard) emission around Eta Carinae is X-ray emission backscattered by the Homunculus. The inset at the lower right shows a WFPC2 image of Eta Carinae on the same scale as the X-ray image. |
The supermassive star Eta Carinae (Davidson & Humphreys 1997) is notorious for its extraordinarily large luminosity (L > 4 x 10^6 solar luminosities), its implicitly large mass (M > 100 solar masses), its wild instability (most notably the Great Eruption of 1843 when the star expelled more than 2 solar masses, and formed the striking, bipolar Homunculus nebula which now shrouds the star from direct view; see Figures 1 and 2) and its continued broad-band variations (Sterken et al. 1996, Davidson et al. 1999). Understanding Eta Carinae can help address a wide variety of astrophysical topics, namely: the formation and evolution of extremely massive stars; the dynamical and chemical interactions of these stars with their environment; the role of binarity in stellar instabilities and the formation of symmetrical nebulosity; and the relation of extremely massive stars to peculiar supernovae and hypernovae.
One Star or Two?Evidence gathered since the 1990s suggests that Eta Carinae is actually a binary system with a less massive, hotter companion, which orbits Eta Carinae in an extremely eccentric (e ~ 0.9), 5.53-year orbit. The impact of the companion on understanding the formation of Eta Carinae, its subsequent evolution and the possible role the companion may play in moderating or driving instabilities in Eta Carinae is important and needs to be understood. Unfortunately, the study of the companion star is difficult since the entire system is buried within the Homunculus. Because hard X-rays penetrate the Homunculus, X-rays are an extremely useful probe of the system.
Eta Carinae is a nice example of progress made in the field of X-ray astronomy. The first claim of X-ray detection was in 1972. A weak source at the limit of detectability appeared in a scan of the Galactic plane with a rocket-borne detector. In 1979, the first Einstein observation of this region showed that this source was the Carina Nebula, over 1 degree in extent - a bright (by present standards) diffuse source sprinkled with dozens of point-like O stars. Although Eta Carinae itself is the brightest of these, it accounts for only 6% of the emission from this area.
The observers claiming the first detection were blissfully ignorant of the true structure. We can now resolve Eta Carinae into a small horseshoe-shaped nebula around a central object and do high-resolution spectroscopy on each element.
As first shown by the Einstein Observatory, Eta Carinae is a hard X-ray source, and as shown by ROSAT and RXTE, these X-rays vary in sync with the rest of the emission, undergoing a 3-month long minimum every 5.53 years. The X-rays are believed to be produced by the collision of the slow, dense wind of Eta Carinae with the faster, low-density wind of the companion. Because the X-ray emission depends on the wind parameters of the two stars, and because the wind parameters are tightly coupled to the stellar parameters, X-ray observations can be used to constrain the stellar parameters. Unlike emission in any other waveband, the hard X-ray emission is not appreciably affected by absorption by or emission from the Homunculus.
Arguably, the hard X-ray emission provides our clearest view of the Eta Carinae system, and Chandra provides our clearest view of the hard X-rays, due to Chandra's exquisite spatial and fine spectral resolution at energies up to 10 keV (which includes the bulk of Eta Carinae's emission). Spatial resolution is key to resolving emission from the star from that of other nearby sources. Spectral resolution is needed in order to determine accurate properties of the pre-shocked wind, and to probe densities and flow dynamics. In this article we discuss some recent Chandra HETG observations of Eta Carinae, mostly obtained during the star�s last X-ray minimum in mid-2003.
Chandra Observations of Eta CarinaeFigure 1 compares a WFPC2 image of Eta Carinae with a Chandra image. This Chandra image is the equivalent of a 500 ksec zeroth-order grating image and is the deepest, most detailed X-ray image of Eta Carinae yet obtained. The X-ray image is color-coded by photon energy (green-blue, soft-hard) and shows an incomplete ring of X-ray emission (in green and yellow) which corresponds to material ejected from the star during the "Great Eruption" (and perhaps older outer material as well), produced as the ejecta plows into the pre-existing interstellar environment. The star itself is the hard source (blue/white) at the center of the image. This hard source results from the X-ray emission in the colliding wind shocks, which is not spatially resolved by Chandra.
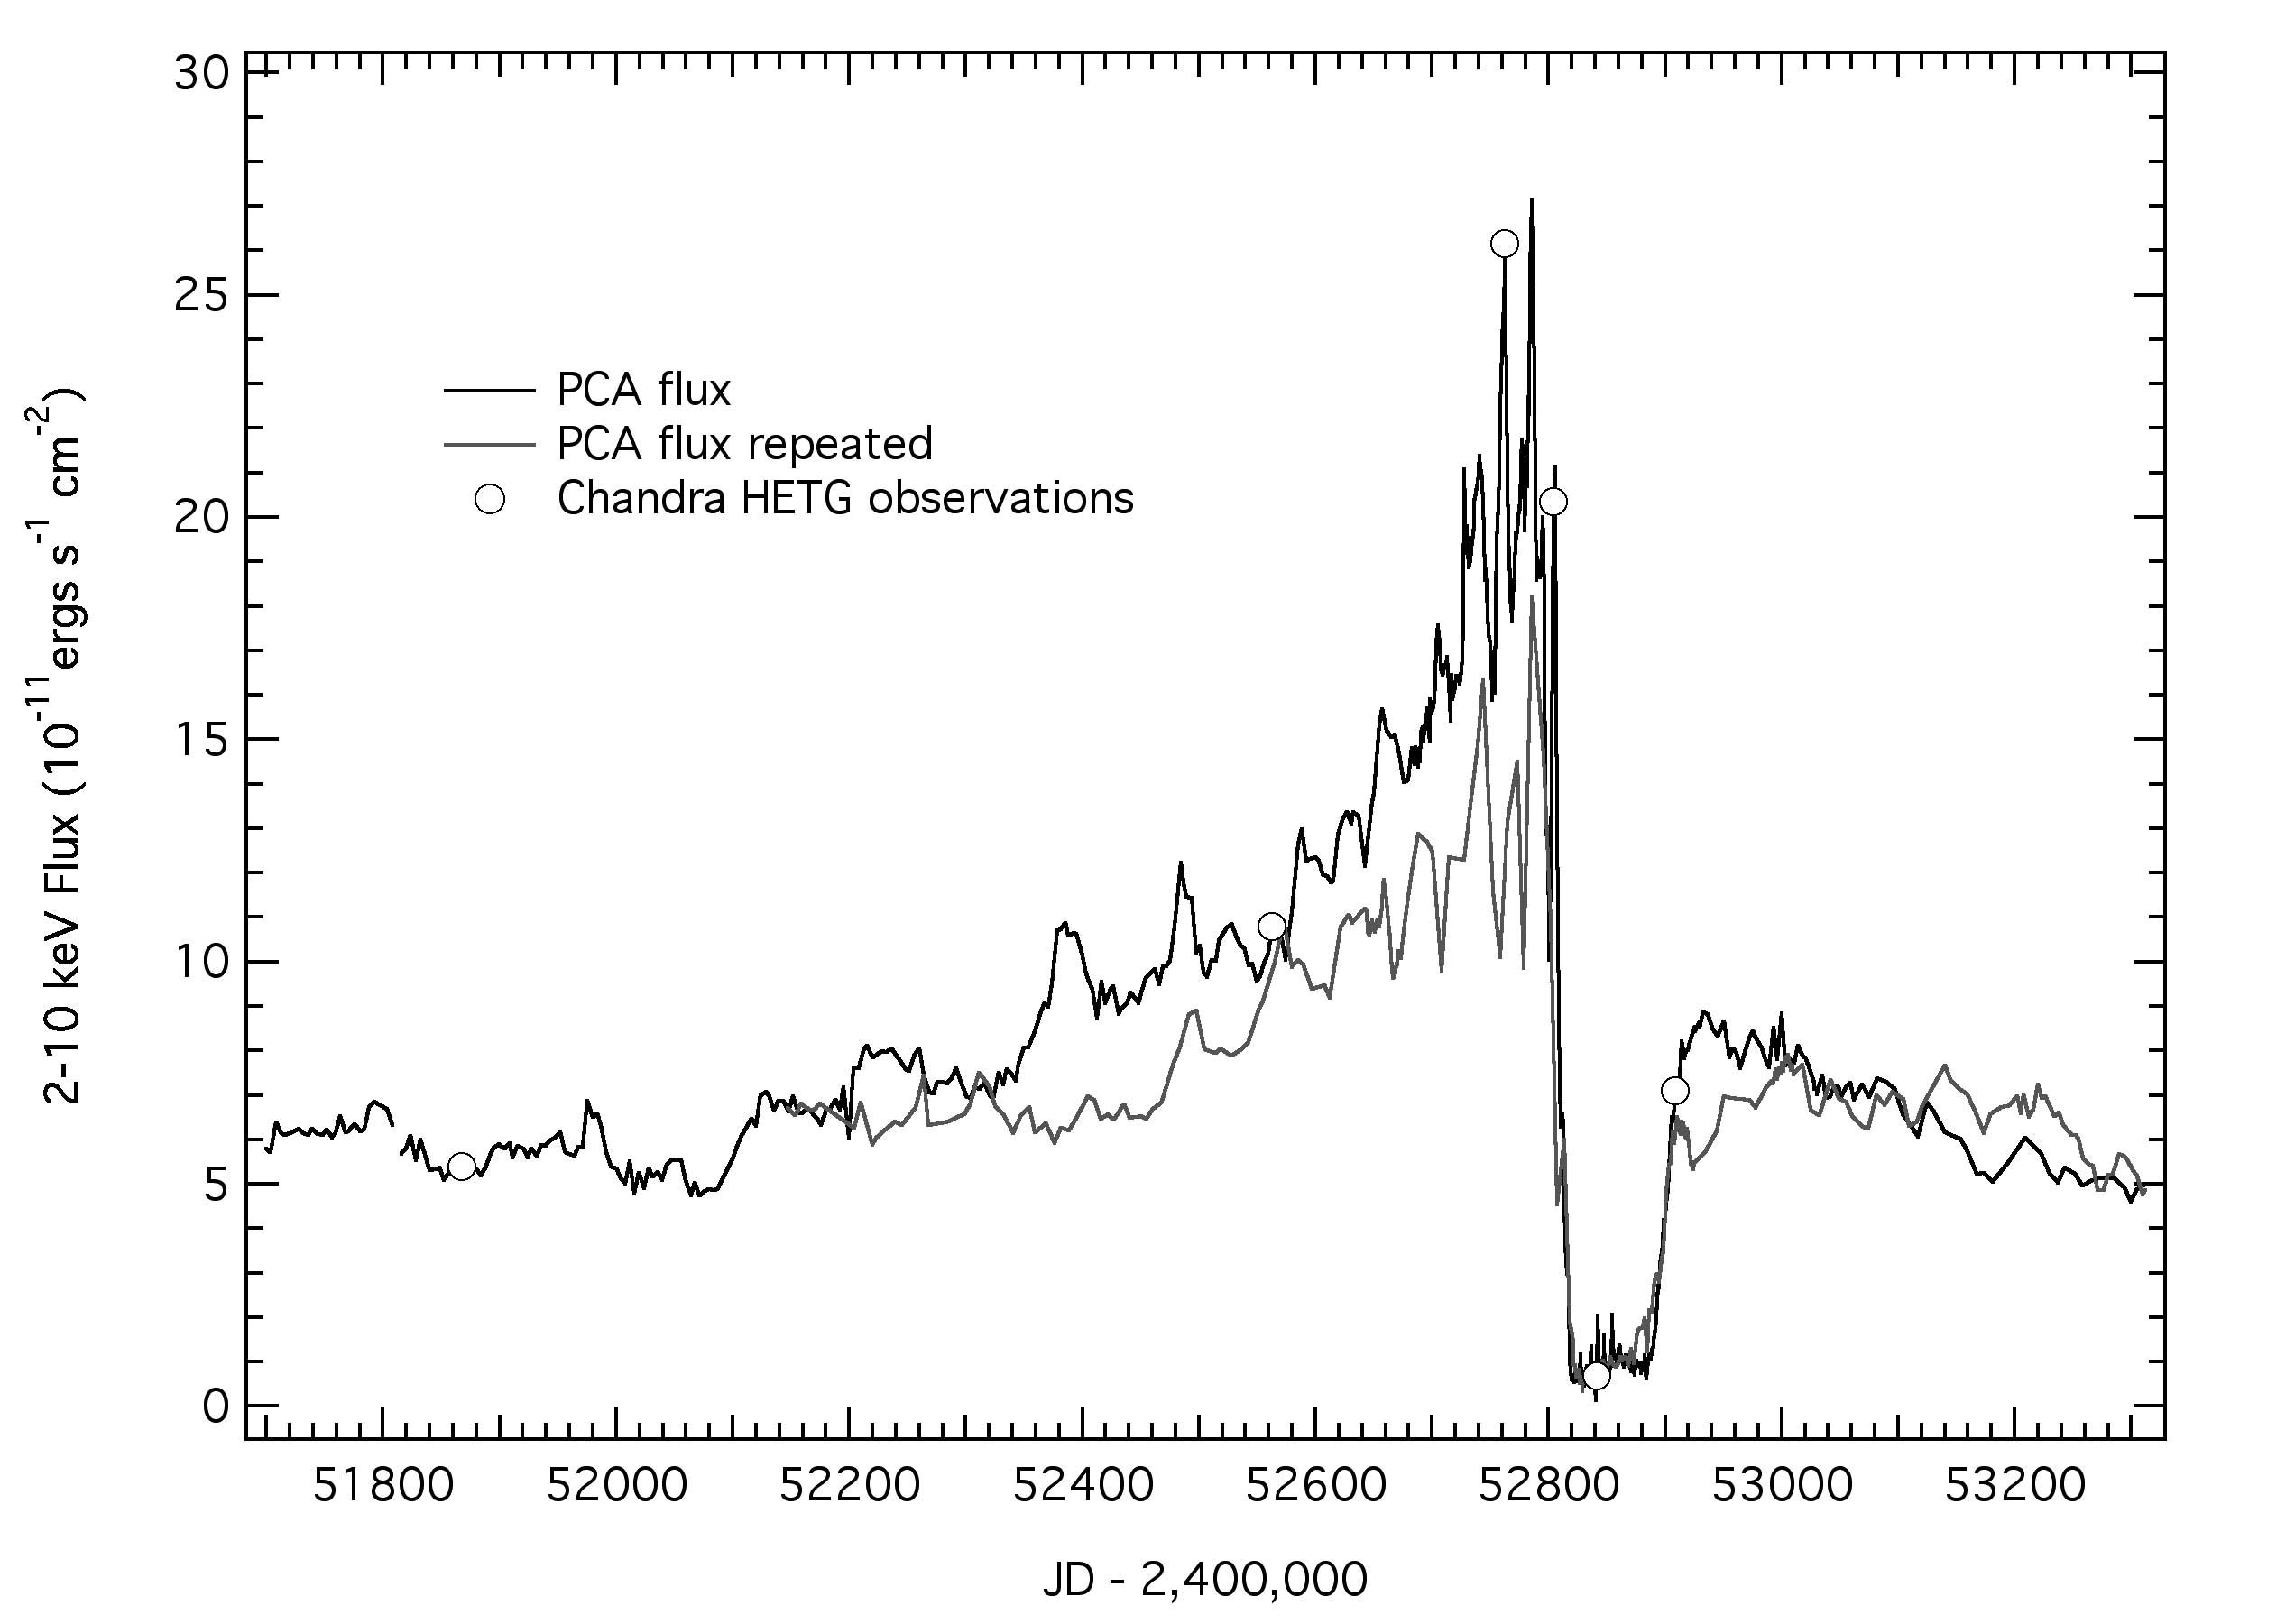
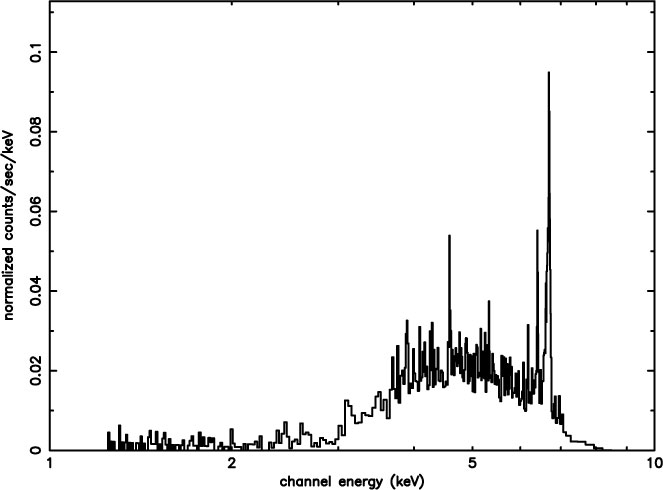
We obtained five 100 ksec HETG observations at important times before, during and after the X-ray minimum which occurred in mid-2003. Figure 3 shows the times of these observations on the X-ray lightcurve of Eta Carinae measured by RXTE. These HETG observations, along with an earlier one obtained in November 2000 near apastron, allow us to measure changes in the X-ray spectral energy distribution, and, for the first time, to use the X-ray line profiles to constrain the dynamics of the hot plasma during the large variations around the 2003 X-ray minimum. Because the X-ray emitting plasma flows along a conical surface where the winds collide, the X-ray emission line velocities should reflect the orbital motion of this cone and the plasma flow along the cone modulated by the phase-dependent orientation of the cone to the line of sight (Henley, Stevens & Pittard 2003). Figure 4 shows some of the variation seen. We highlight a few of the important results from these observations below.
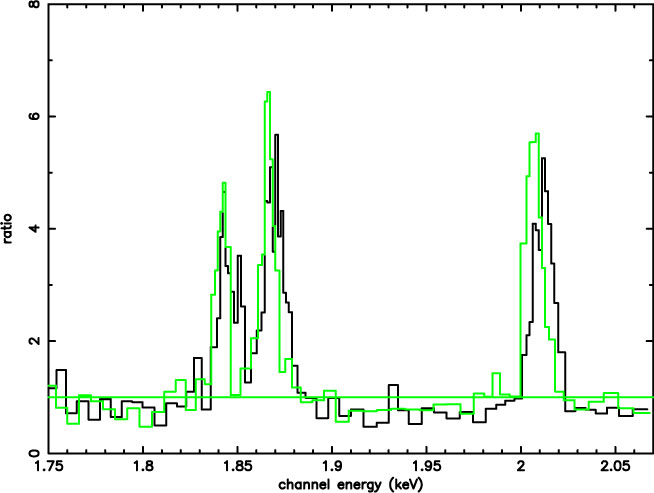 | 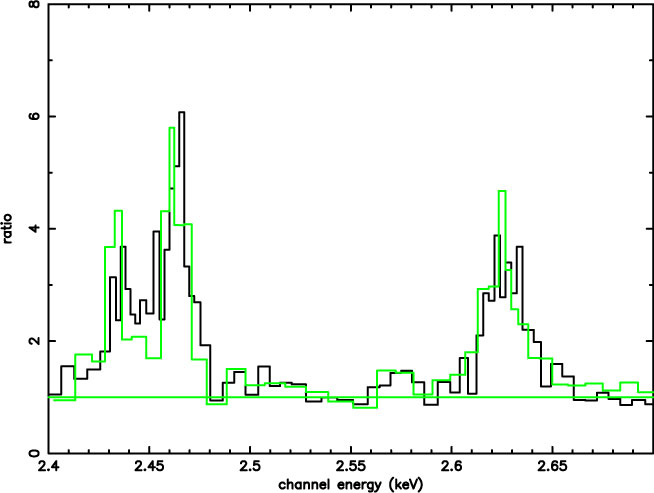 | 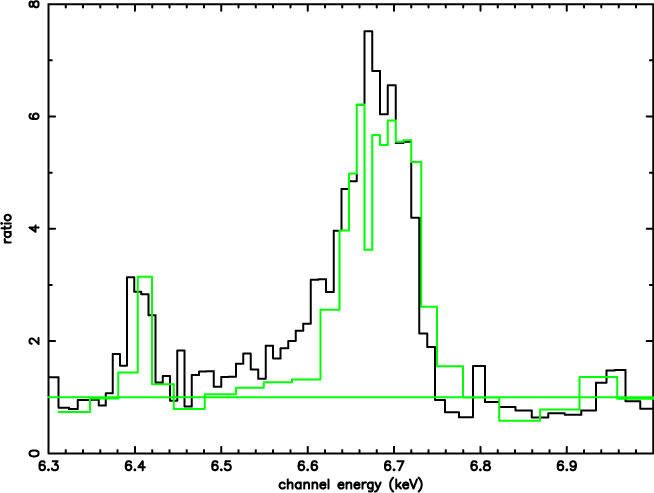 |
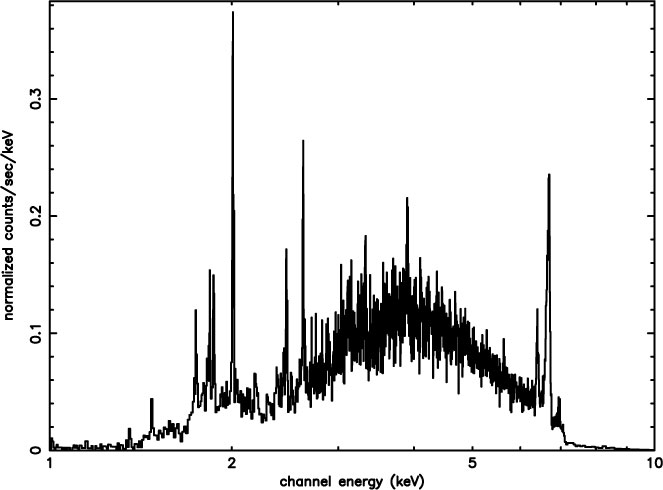
| Figure 4: Top: HEG spectra of Eta Car from May 3, 2003, before the X-ray minimum. Middle: HEG spectrum from September 26, just after the X-ray minimum. Bottom, left to right: Comparison of continuum-normalized Si XIII & XIV lines, S XV & XVI lines, and Fe XXV lines from November 2000 (believed to be near apastron, in green) and from June 16, 2003 (near periastron, in black). | ||
X-ray Emission Line Variability
The HETG spectra showed clear changes in the emission lines. The forbidden-to-intercombination line ratios of the S and Si He-like ions seem to decrease on approach to the X-ray minimum, indicating that the X-ray emitting plasma is either increasing in density or being exposed to higher UV flux. Either explanation is qualitatively consistent with current colliding wind models of the system in which the X-ray minimum occurs near periastron.
A particularly surprising result is that the lower-temperature lines from H-like and He-like Si and S become increasingly blueshifted on approach to the X-ray minimum, while the higher-temperature He-like Fe lines (which are unresolved in the HEG spectra) do not. The line shifts in all cases are much larger than the expected orbital velocities near periastron, and so do not appear to represent the bulk motion of the shock cone. The discrepancy in redshift between the Si and S lines and the Fe lines is not fully understood yet, but may represent a spatial segregation between the hotter and cooler plasma. The Chandra grating spectra also show blended line emission between the Fe XXV lines and the Fe fluorescent line. This emission is probably produced by plasma that has not yet reached ionization equilibrium, and if so suggests a density of ~ r = 10-18 g cm-3, about that expected from the companion�s shocked stellar wind using the model of Pittard & Corcoran (2002). Note that during these long HETG observations near the X-ray minimum, RXTE monitoring showed significant variations in the X-ray plasma, especially for those observations just before the X-ray minimum, so perhaps it�s not surprising that at least some of the plasma had not reached ionization equilibrium.
Imaging h Carinae During the MinimumThe HETG observation of Eta Carinae during the X-ray minimum provided a surprising discovery (Corcoran et al. 2004). The zeroth-order image clearly showed X-ray emission from the star (proving for the first time that the X-ray �eclipse�� is not total), but also showed faint, spatially-resolved X-ray emission from the Homunculus. This was the first detection of the Homunculus in X-rays, and it would not have been possible without Chandra's excellent spatial resolution. This emission is produced by reflection of time-delayed X-rays from the wind-wind collision near the star by gas in the back wall of the Homunculus. Figure 2 shows a "true-color" image of Eta Carinae during the minimum which shows the soft (0.2-1.5 keV) outer emission in red, the faint stellar emission in white, and hard (3-8 keV) reflected emission from the Homunculus in blue. This adds the Homunculus to the small class of ``X-ray reflection nebula" and it is the only one in which the reflected source is observable apart from the reflecting source.
RecoveryWe also obtained a grating spectrum after the X-ray minimum. The resulting spectrum showed a surprisingly large amount of absorption, so that the S and Si lines were difficult to measure accurately. This "enhanced absorption" may be direct evidence of some sort of interaction between the companion and h Carinae near periastron in which passage of the companion near h Carinae apparently increases the wind density of Eta Carinae for a period of time, a sort of "mini-Great Eruption". Though the S and Si lines were too absorbed to measure, the redshift of the Fe XXV blend decreased to nearly the value it had prior to the start of the X-ray minimum.
Eta Carinae in ContextThe X-ray data must be understood in the context of observations with other X-ray and non-X-ray observatories, and vice-versa. Observations with the Advanced Camera for Surveys (ACS), obtained by Smith et al. (2004) during the 2003 X-ray minimum as part of the HST Treasury Project on Eta Car (Kris Davidson PI), show shadowing of the companion�s UV flux by Eta Carinae, which helps define the orientation of the orbit, and which helps to clarify the interpretation of the X-ray variations. Another key observation during the 2003 event was made by Augusto Damineli and Joao Steiner, who discovered He II 4686 emission which reaches maximum strength just after the start of the X-ray minimum (Steiner & Damineli 2004). This is important since He II 4686 cannot be formed in the relatively cool wind of Eta Carinae. But it's not clear whether the He II 4686 emission is excited directly by flux from the companion, or if some or all of the emission is produced in the wind-wind shock. Other important observations in the IR (Whitelock, Feast, Marang, & Breedt 2004) and optical (Fernandez Lajus et al. 2003, van Genderen, Sterken, Allen & Liller 2003, Martin & Koppelman 2004, van Genderen & Sterken 2004) showed minima which are correlated with the X-ray drop. Radio observations by Bob Duncan and Stephen White confirmed the presence of a minimum in radio brightness but also showed secular decreases in the radio emission. This is in contrast to the RXTE observations which showed secular increases in the 2-10 keV flux for most of the interval prior to the mid-2003 minimum. In addition to the ACS imaging, the HST h Carinae Treasury Project obtained a trove of spatially-resolved spectra using the Space Telescope Imaging Spectrograph (STIS), which show in unprecedented detail changes in the stellar flux and in the surrounding nebula at the sub-arcsecond level. The information density of these STIS observations is very large and the understanding of these data is ongoing.
While Eta Carinae is a unique object, it does have some stellar cousins. Its X-ray variability is similar in many ways to the "canonical" colliding wind binary WR 140, which is also a hard, variable source of X-rays and which is a long period (P = 7.9 years), highly eccentric (e = 0.88) massive binary. Another related object is the "Pistol Star" near the center of the Galaxy, which vies with h Carinae for the title of most massive known star. Chandra imaging ( Law & Yusef-Zadeh 2004) has shown that other extremely massive stars found in the clusters near the Galactic center, like the bright stars in the Quintuplet Cluster, are X-ray bright and probably colliding wind binaries. Perhaps the most intriguing Eta Carinae analog is HD 5980, a short-period WR+WR binary in the Small Magellanic Cloud. The primary star (star A) has a mass of about 50 solar masses, while the secondary (star B) is a Wolf-Rayet star (subtype WNE) of mass ~ 28 solar masses. Star A is believed to have undergone a large-scale eruption in 1994 similar to the 1843 Great Eruption of Eta Carinae. Chandra and XMM observations show that HD 5980 is also a variable X-ray source, but is more difficult to study than Eta Carinae due to its much larger distance. It's interesting to note that all these systems (except possibly the Pistol star), and other important ones as well, appear to be binaries. The effects of companions on the evolution of these stars is an issue that needs to be addressed, and an important way to address it is to probe the wind-collision zone using X-rays. The availability of Chandra to make detailed observations of X-ray spectra offers us a unique tool to understand these important systems.
M. F. Corcoran (USRA), F. D. Seward (SAO), D. B. Henley (Birmingham), and K. Hamaguchi (NRC)
ReferencesCorcoran, M.F., et al. 2004,
ApJ, 613, 381
Davidson, K. et al. 1999, AJ, 118, 1777
Davidson,
K. & Humphreys, R.M. 1997, ARA&A, 35, 1
Fernandez Lajus, E.,
Gamen, R., Schwartz, M., Salerno, N., Llinares, C., Farina, C.,
Amorn, R., \& Niemela, V. 2003, Informational Bulletin on Variable
Stars, 5477, 1
Henley, D.B., Stevens, I. R., & Pittard,
J.M. 2003, MNRAS, 346, 773
Law, C. & Yusef-Zadeh, F. 2004, ApJ,
611, 858
Martin, J.C. & Koppelman, M.D. 2004, AJ, 127, 2352
Pittard, J.M. & Corcoran, M.F. 2002, AAp, 383, 636
Smith, N.,
Morse, J.A., Collins, N.R., & Gull, T.R. 2004, ApJL, 610, L105
Steiner, J.E. & Damineli, A. 2004, ApJL, 612, L133
Sterken, C.,
de Groot, M. J. H., and van Genderen, A. M. 1996, A&AS, 116, 9
van Genderen, A.M., Sterken, C., Allen, W.H., & Liller, W. 2003,
AAp, 412, L25
van Genderen, A.M. & Sterken, C. 2004, AAp, 423, L1
Weis, K., Corcoran, M. F., Bomans, D. J., & Davidson, K. 2004,
AAp, 415, 595
Whitelock, P.A., Feast, M.W., Marang, F., & Breedt,
E. 2004, MNRAS, 352, 447