counted against the target’s time allocation to determine if additional scheduling is required to complete the observation; (3) triggering promotion of data products in the Chandra Data Archive to identify the data products as the default versions available to users; (4) triggering data distribution (or feedback for reprocessing); (5)~initiating the start of the proprietary period clock (for observations with proprietary data rights); and (6) enabling the reviewer to complete V&V in ~5 minutes for a successfully processed observation.
Automated Validation and Verification Design
The design goals of our post-launch efforts were aimed at encapsulating experience gathered with the live mission into automated checking. This included limit-checking only pertinent science and engineering data, identifying specific serious pipeline warnings and errors, and presenting and evaluating carefully selected data views defined by V&V and instrument scientists based on experience. Human review is minimized by identifying unexpected test results using color coding.
To improve system integrity and automation goals, the V&V software also manages all of the required interfaces and system triggers, including triggering an error recovery path - reprocessing, rescheduling, and further investigation by instrument teams. Other design goals included enabling other groups to evaluate V&V by providing an interface to CDO and instrument scientists, and allowing off-site access via a standard web browser to support rapid turnaround of fast processing requests or anomaly resolution.
Automated Validation and Verification
Implementation
The V&V software is implemented as three components: (1) a pipeline, which executes after the completion of level 2 processing for an observation; (2) a manager process that controls the V&V flow after the pipeline completes; and (3) a GUI that provides the user interface for the reviewer.
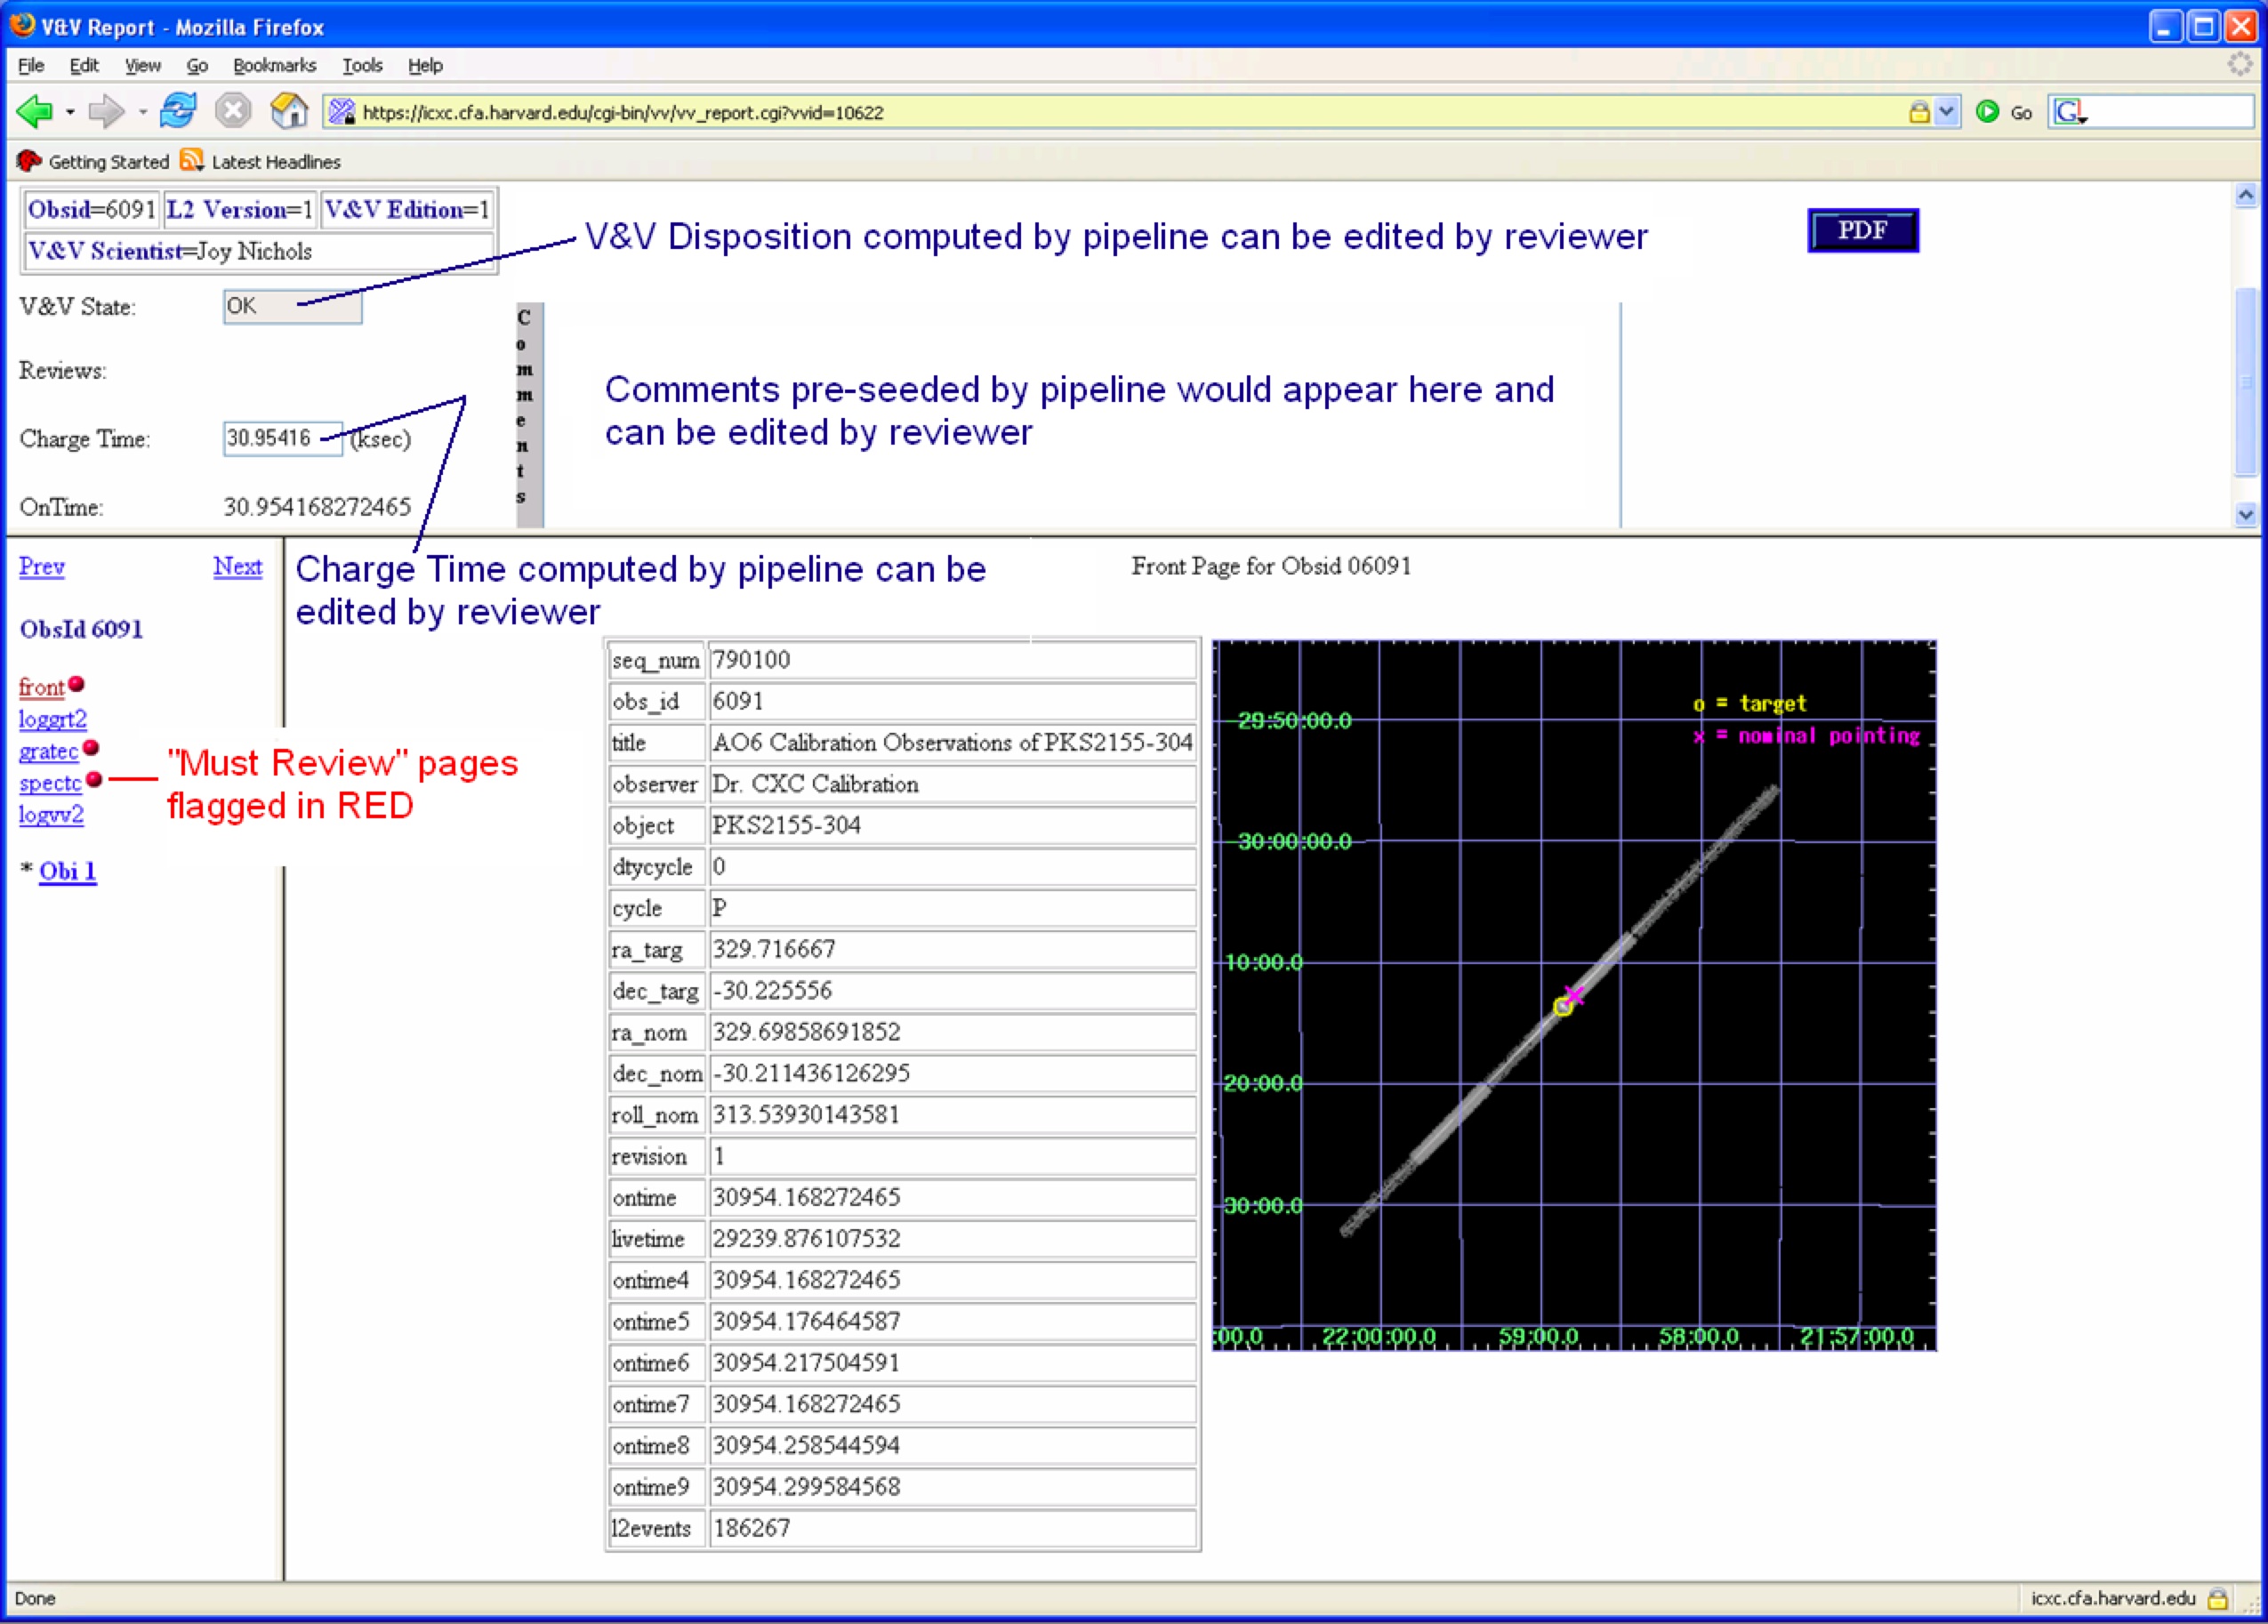
The pipeline creates the V&V data products that are displayed through the GUI, including predefined html web-pages, JPEG images, PNG plots, and key tabular information designed specifically for V&V. The pipeline also creates a template PDF format report for distribution to the user, and seeds the report with textual comments and the “most likely’’ disposition status based on the results of the tests applied by the pipeline. Finally, the pipeline computes the nominal charge time for the observation.
The manager builds and links the V&V report web-pages into the GUI for display to the reviewer, and manages any input that the reviewer may supply using the GUI, including verifying that any revisions to the calculated charge time comply with appropriate rules. State transition updates occur when a new disposition status is selected by a reviewer for an observation, and initiate further actions by the manager process, such as sending email notifications to appropriate parties, or triggering data distribution. The manager also creates the final V&V report for distribution to the user by incorporating the reviewer comments and disposition status entered via the GUI into the template report. This last action is triggered when the reviewer submits a final state as the disposition status for the observation, indicating that the review is complete.

FIGURE 23: Sample V&V GUI observation front page.
V&V. It guides the reviewers through the evaluation process byidentifying required (“must review’’) and supporting data views, and provides the capabilities to edit the comments, charge time, and disposition status seeded by the pipeline. The GUI also provides mechanisms to manage authorized users of the V&V software, including their privileges (which define the functions that they may perform) and their capabilities (which identify the types of data that they may handle). The GUI provides a selectable set of mechanisms to assign reviews to reviewers based on comparison of the actual instrument configuration and scientist’s capabilities. Finally, the GUI triggers creation of a new edition of a report if it must be revised after submission with a final state.
The new V&V software was installed in operations in January 2005. It provides a systematic evaluation of SDP results and issues, and allows operations staff to perform V&V. As a result, the data processing statistics have improved dramatically and the quality of the data products to the user has improved.
Janet DePonte Evans