[Last Change: 01 Mar 2011 (rev 4)]
Optical Axis Measurement
Maxim Markevitch (maxim@head-cfa.harvard.edu), 11 Oct 1999, updated 12 Oct 2000
This report describes a determination of the HRMA optical axis position using a raster scan of the star HR1099 with HRC-I. The position is determined by searching for a minimum of the PSF width. (There is ambiguity in defining "optical axis" for a non-ideal mirror, and one possibility is to define it as a direction of the narrowest PSF which is adopted here. Should any other definition be made, it can be related to the measured position of the PSF minimum using the HRMA model.) The present measurement is a refinement of a preliminary test performed earlier with ACIS-S (see
this memo). For a pre-flight simulation of this measurement, see
this memo.
Data analysis for HRC-I
The measurement was performed with
SIM_Z =91.866 mm (from the fits headers of L1 event files) which puts the aimpoint to one of the HRC-I corners. The source was observed at 33 different offsets within a 4' radius from the presumed optical axis position, with exposures of 500-1000 s each (OBSIDs 1120-1152).
To check for any aspect problems, each pointing was divided into 4 time intervals. A source centroid was calculated in each interval and compared to the centroid from the full exposure. This procedure detected an aspect drift in OBSID 1124 which was excluded from further analysis. In addition, time intervals in which the centroid was offset by more than 0.2" from the average were excluded (20 one-quarter exposure intervals in total, almost all of them either in the beginning or in the end of the observation).
The event files cleaned of aspect error intervals and also of events with
amp_sf=3 were used to make the aspect-uncorrected images in chip (u,v) coords and aspect-corrected images in sky coords. From the former, I determined the average position of the source in chip coords during the exposure, and from the latter, the width of the PSF. Note that for the present analysis, we are interested in the actual average position in chip coords weighted by the number of events (rather than, for example, the center of the dither pattern), because the PSF changes slightly over the dither pattern and we measure the average PSF width in each observation. The width of the PSF is characterized by the 50% and 90% encircled energy radii derived from a radial brightness profile centered on the source centroid.
Uncertainties of the 50% and 90% radii values were estimated by dividing the exposures for a representative set of pointings (1-2 for each off-axis angle) into 9 intervals, calculating the scatter of the PSF widths among these interval, and dividing this scatter by sqrt(9). Since not all clean exposures had the same length, for each observation, the above uncertainties for the correspondent off-axis angle were then normalized by 1/sqrt(N) where N is the number of photons. This resulted in the following dataset (errors are 1-sigma; radii are given in HRC pixels, 1 pixel=0.132"):
Table 1
| OBSID |
chipx |
chipy |
50% |
90% |
best-fit radius |
| |
|
|
radius |
err |
radius |
err |
50% |
90% |
| 1120 |
3715.8 |
3831.5 |
3.500 |
0.07 |
7.717 |
0.21 |
3.47 |
7.88 |
| 1121 |
4174.7 |
3441.3 |
4.561 |
0.14 |
9.745 |
0.26 |
4.53 |
9.54 |
| 1122 |
4446.7 |
3160.3 |
5.930 |
0.18 |
11.658 |
0.30 |
6.14 |
12.05 |
| 1123 |
4807.0 |
2820.9 |
8.790 |
0.30 |
16.092 |
0.53 |
9.23 |
16.86 |
| 1125 |
3840.9 |
3340.1 |
4.047 |
0.12 |
8.757 |
0.24 |
4.23 |
9.06 |
| 1126 |
3836.3 |
2894.0 |
5.825 |
0.20 |
11.306 |
0.33 |
5.85 |
11.59 |
| 1127 |
3840.5 |
2342.7 |
9.312 |
0.31 |
16.227 |
0.54 |
9.17 |
16.78 |
| 1128 |
3835.0 |
1971.6 |
11.884 |
0.40 |
21.417 |
0.60 |
12.21 |
21.52 |
| 1129 |
3517.5 |
3460.2 |
3.937 |
0.11 |
8.710 |
0.21 |
3.94 |
8.61 |
| 1130 |
3153.5 |
3167.1 |
5.517 |
0.16 |
10.806 |
0.26 |
5.31 |
10.74 |
| 1131 |
2823.5 |
2853.7 |
7.656 |
0.23 |
14.402 |
0.40 |
7.67 |
14.44 |
| 1132 |
2516.0 |
2516.8 |
11.441 |
0.31 |
19.865 |
0.46 |
11.06 |
19.72 |
| 1133 |
3342.2 |
3864.4 |
3.864 |
0.12 |
8.884 |
0.22 |
3.71 |
8.26 |
| 1134 |
2900.7 |
3802.9 |
4.846 |
0.15 |
9.663 |
0.24 |
4.88 |
10.07 |
| 1135 |
2467.8 |
3805.4 |
7.153 |
0.19 |
12.987 |
0.33 |
6.90 |
13.24 |
| 1136 |
1986.6 |
3814.8 |
10.550 |
0.36 |
18.163 |
0.54 |
10.20 |
18.38 |
| 1137 |
3516.3 |
4096.2 |
3.551 |
0.11 |
7.984 |
0.21 |
3.62 |
8.12 |
| 1138 |
3151.7 |
4442.6 |
4.853 |
0.17 |
9.880 |
0.27 |
4.84 |
10.02 |
| 1139 |
2833.1 |
4763.3 |
6.865 |
0.22 |
13.443 |
0.38 |
6.97 |
13.34 |
| 1140 |
2514.6 |
5084.5 |
9.890 |
0.38 |
18.537 |
0.57 |
10.07 |
18.18 |
| 1141 |
3837.2 |
4230.7 |
3.785 |
0.13 |
8.382 |
0.24 |
3.82 |
8.42 |
| 1142 |
3789.9 |
4715.4 |
5.073 |
0.19 |
10.401 |
0.31 |
5.15 |
10.50 |
| 1143 |
3841.5 |
5036.2 |
6.536 |
0.40 |
12.574 |
0.70 |
6.70 |
12.92 |
| 1144 |
3837.4 |
5577.3 |
9.702 |
0.61 |
18.548 |
0.91 |
10.37 |
18.65 |
| 1145 |
4157.1 |
4101.1 |
3.803 |
0.14 |
8.487 |
0.27 |
4.14 |
8.93 |
| 1146 |
4435.4 |
4427.7 |
5.127 |
0.21 |
10.576 |
0.34 |
5.57 |
11.16 |
| 1147 |
4757.5 |
4757.2 |
7.996 |
0.21 |
15.437 |
0.37 |
8.11 |
15.12 |
| 1148 |
5126.1 |
5040.4 |
11.663 |
0.44 |
21.883 |
0.66 |
11.71 |
20.75 |
| 1149 |
4245.3 |
3859.5 |
4.386 |
0.08 |
9.516 |
0.15 |
4.26 |
9.10 |
| 1150 |
4687.1 |
3854.7 |
6.058 |
0.13 |
11.740 |
0.22 |
5.93 |
11.72 |
| 1151 |
5142.4 |
3794.3 |
8.893 |
0.17 |
16.284 |
0.30 |
8.65 |
15.97 |
| 1152 |
5588.6 |
3795.9 |
12.077 |
0.32 |
21.787 |
0.48 |
12.26 |
21.59 |
The above data (PSF width as a function of two chip coordinates) were fit by a symmetric quadratic function. Uncertainties of the best-fit position of the function minimum were estimated by Monte-Carlo simulations, varying the data values by their uncertainties. The best-fit values for the fit to the 50% and 90% radii, including the 90% confidence intervals, are given in Table 2:
Table 2
| |
min position |
min value |
χ2 |
χν2 |
| |
chipx (±90%) |
chipy (±90%) |
|
|
|
| |
| 50% |
3678±15 |
3893±18 |
0.46" |
31.5 |
1.13 |
| 90% |
3658±16 |
3870±20 |
1.04" |
38.5 |
1.38 |
| |
| 50% |
3668 (fixed) |
3882 (fixed) |
0.46" |
33.6 |
1.20 |
| 90% |
3668 (fixed) |
3882 (fixed) |
1.04" |
40.4 |
1.44 |
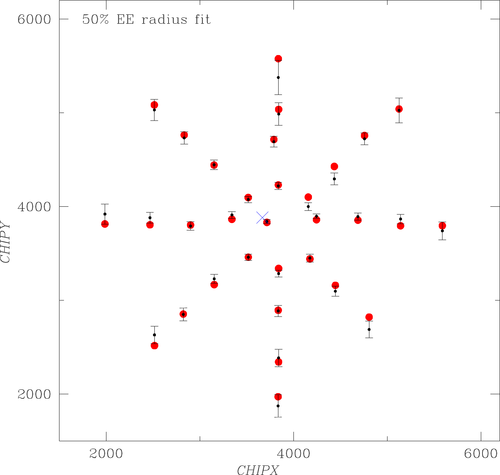
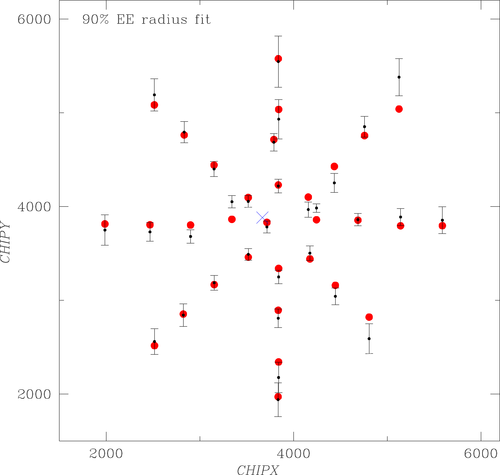
The best-fit positions from the 50% and 90% radius datasets are within each other's 95% confidence intervals. Although these are not exactly independent datasets, I take their average as the final result (keeping the same confidence interval). The bottom two lines in Table 2 give χ
2 for the fits with positions fixed at their average values, and the last 2 columns in Table 1 give the respective model values for each data point.
In the two (rather nonintuitive) figures below, I attempt to show the residual deviations in the fits with the fixed average position (bottom lines in Table 2). Axes in the plots show chip coordinates in the HRC-I detector. Big red dots show the weighted average positions of each pointing. The black data points with error bars (1-sigma) deviate from these red points in the vertical direction by the amount of the deviation from the best-fit parabolic model (the scale is arbitrary but the same for all points). The blue cross is the average minimum position. One can see that the fits are reasonably good, without any obvious systematic deviations.
A couple of tests, for example, excluding the central pointing (whose offset may seem suspiciously coincident with the best-fit axis position) or excluding the data point at the end of the upper-left diagonal, do not change the best-fit positions significantly. A close examination of the residuals shows that somewhat high χ
2 values are dominated by a couple of data points with the smallest errors. Our formal statistical errors do not attempt to account for any systematic uncertainties, while it is probably fair to say that we cannot measure the PSF width to better than, say, 1/3 of the detector pixel. If we replace all formal errors that are smaller than 0.3 pixels in our dataset by 0.3 pixels and rerun the fit, we get practically no change in the fitted parameters while χ
2 becomes acceptable. To conclude, there seems to be no problems from the data analysis standpoint, and the resulting optical axis position in the HRC-I chip coordinates is at
CHIPX = 3668 ±16 or ±2.1" (90%)
CHIPY = 3882 ±19 or ±2.5"
For SIM_Z = 91.866 mm            (this is NOT the HRC-I default aimpoint)
We can convert this position to the default (central) position in HRC-I at
SIM_Z 126.985 mm assuming that the detector is rotated exactly 45 deg w.r.t. SIM =z axis and the pixel size is 6.429 microns:
CHIPX     = 7530
CHIPY     = 7745
For SIM_Z = 126.985 mm           (this is the HRC-I nominal aimpoint)
An uncertainty of 0.1 deg in the detector rotation angle adds a 10 pixel (1.3") uncertainty to the above position.
Conversion to other detectors (updated 10/12/00)
Over the past year, the location of all detectors relative to the mirror and SIM has been calibrated with adequate accuracy, so the above HRC-I optical axis position can be converted to other detectors' coordinate frames. The optical axis location in chip coordinates for other detectors' nomimal
SIM_Z values are given in the
Jonathan McDowell's coordinate paper (see Table 11 of that paper) and summarized below:
Table 3: Optical axis positions
| detector |
SIMZ |
OPTICAL AXIS |
chip |
| |
mm |
chip x |
chip y |
|
| ACIS-I |
-233.592 |
984 |
995 |
I3 |
| ACIS-S |
-190.133 |
221 |
532 |
S3 |
| HRC-I |
126.985 |
7530 |
7745 |
|
| HRC-S |
250.456 |
2201 |
8977 |
S1 |
It is worth noticing that the resulting ACIS-S axis position is only 8" away from our previous
crude measurement that was derived directly in ACIS-S: that result was (238,532) if one averaged the 50% and 90% radii fits as it is done here.
For observations processed recently (since December 1999 or so), PIXLIB already uses the above values, and the optical axis by definition corresponds to the
detx,dety point (4096.5,4096.5) for both ACIS detectors, (16384.5,16384.5) for HRC-I, and (32768.5,32768.5) for HRC-S.
For reference, the table below gives positions of the aimpoint in each detector's chip coordinates. It is defined as a point where a source with zero commanded
y,z offsets and a given
SIM_Z offset will land on the detector (of course, the source will dither around that position). The aimpoint has been measured for ACIS-S, see
Tom Aldcroft's memo. It was derived by averaging over a number of observations, correcting for commanded target offsets and
SIM_Z offsets, and found to be
(chipx,chipy)=(252,510) in chip S3. This is away from the optical axis by
dy=15", dz=-11". This offset should be the same for all detectors, and I add it to the above optical axis positions to determine the aimpoints for other detectors. The results are summarized below:
Table 4: Aimpoints
| detector |
SIMZ |
AIMPOINT |
chip |
| |
mm |
chip x |
chip y |
|
| ACIS-I |
-233.592 |
962 |
964 |
I3 |
| ACIS-S |
-190.133 |
252 |
510 |
S3 |
| HRC-I |
126.985 |
7669 |
7721 |
|
| HRC-S |
250.456 |
2119 |
8862 |
S1 |
For ACIS-I and HRC detectors, the above converted aimpoints are within 5" of the approximate observed positions obtained by averaging of a few observations (which were given in Table 3 of the
10/11/99 version of this memo)

 A couple of tests, for example, excluding the central pointing (whose offset may seem suspiciously coincident with the best-fit axis position) or excluding the data point at the end of the upper-left diagonal, do not change the best-fit positions significantly. A close examination of the residuals shows that somewhat high χ2 values are dominated by a couple of data points with the smallest errors. Our formal statistical errors do not attempt to account for any systematic uncertainties, while it is probably fair to say that we cannot measure the PSF width to better than, say, 1/3 of the detector pixel. If we replace all formal errors that are smaller than 0.3 pixels in our dataset by 0.3 pixels and rerun the fit, we get practically no change in the fitted parameters while χ2 becomes acceptable. To conclude, there seems to be no problems from the data analysis standpoint, and the resulting optical axis position in the HRC-I chip coordinates is at
