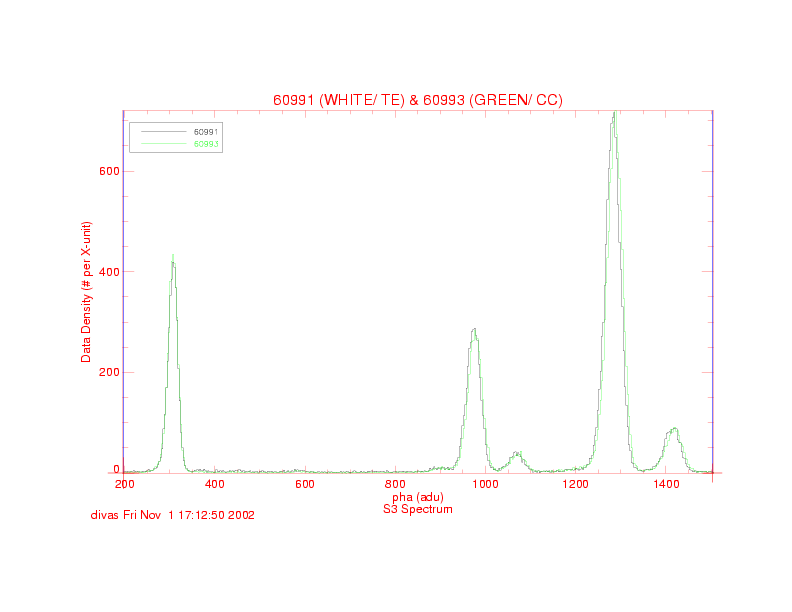
This figure shows the spectra of TE and CC mode observations of the Ext Cal
Source on S3 integrated over CHIPY. Notice that the TE data (black line :
ObsID 60991) and CC data (green line : ObsID 60993) show very similar spectra
with the CC data showing a slightly larger PHA value than the TE data at the
high energy end. (This is what was discussed at the start of this
presentation that the CC data shows larger slope in the PHA vs. energy
compared to TE).
Since for BI chip S3, the dominant CTI is the serial CTI, it is not surprising
that CTI has same effect on both CC and TE data as the serial transfer
timescale is the same for both CC and TE modes.