| One Week Plot | Three Month Plot | One year Plot | Five Year Plot | Full Range | Min | Mean | Max |
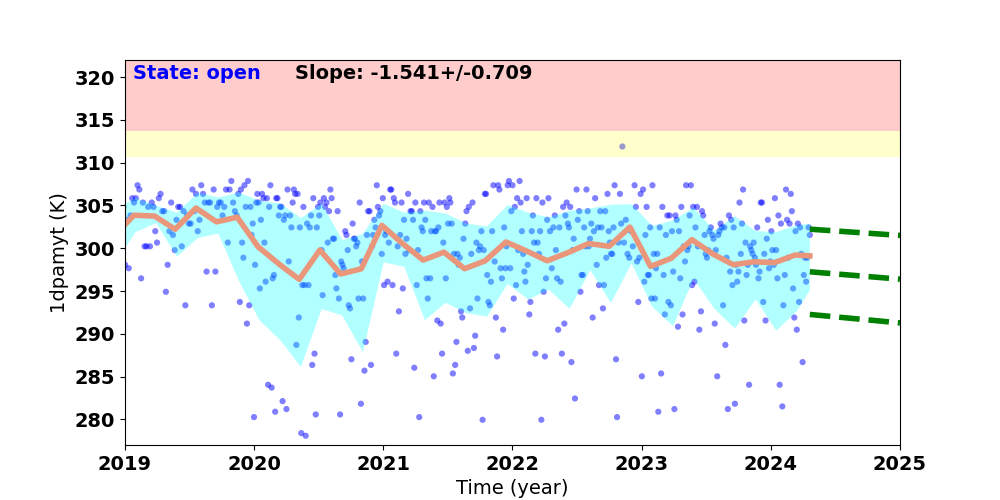
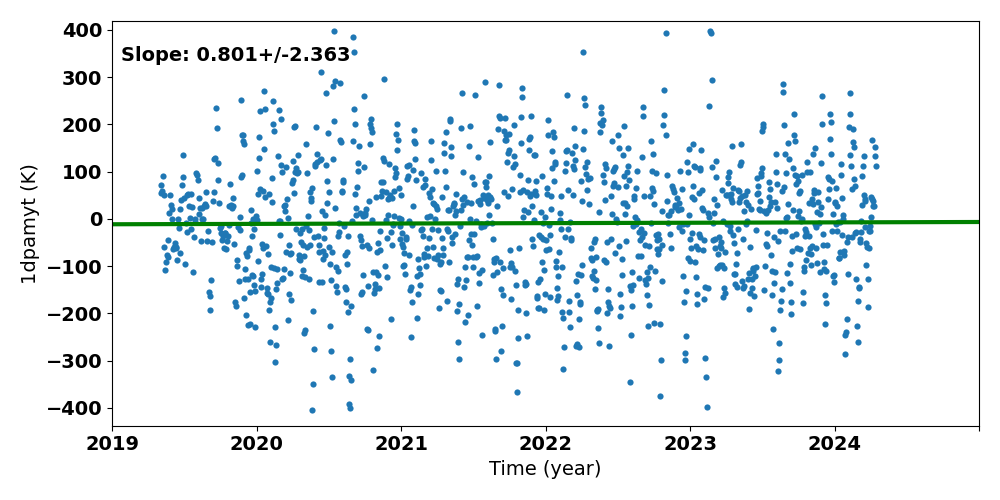
| 1cbat | 1cbbt | 1crat | 1crbt | 1dactbt | 1deamzt | 1dpamyt | 1dpamzt | 1oahat | 1oahbt | 1pdeaat | 1pdeabt |
| 1pin1at | 1wrat | 1wrbt | oobthr42 | oobthr44 |
If you have any questions, please contact
swolk@cfa.harvard.edu.
Data Updated: Jul 29, 2026
Last Site Modification: Sep 30, 2021