| One Week Plot | Three Month Plot | One year Plot | Five Year Plot | Full Range | Min | Mean | Max |
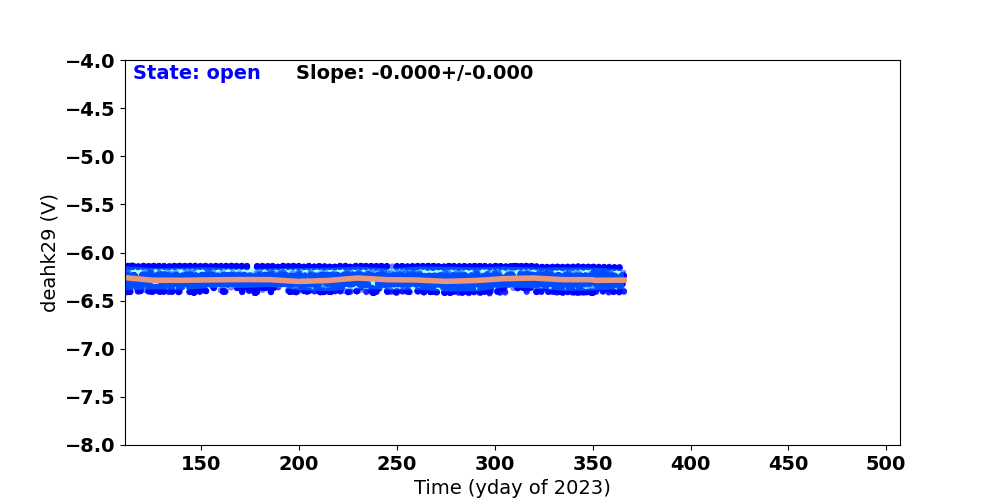
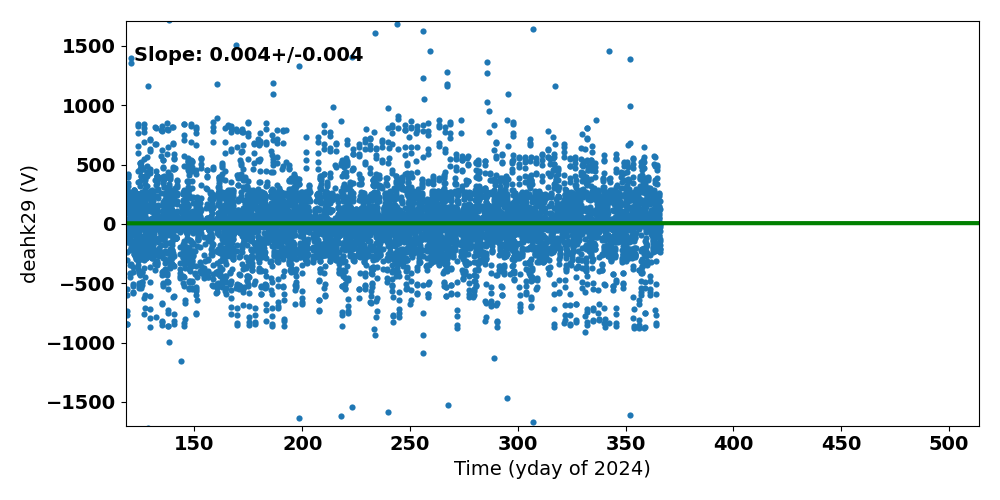
| deahk17 | deahk18 | deahk19 | deahk20 | deahk25 | deahk26 | deahk27 | deahk28 | deahk29 | deahk30 | deahk31 | deahk32 |
| deahk33 | deahk34 | deahk35 | deahk36 | deahk37 | deahk38 | deahk39 | deahk40 |
If you have any questions, please contact
swolk@cfa.harvard.edu.
Data Updated: Jul 28, 2026
Last Site Modification: Sep 30, 2021