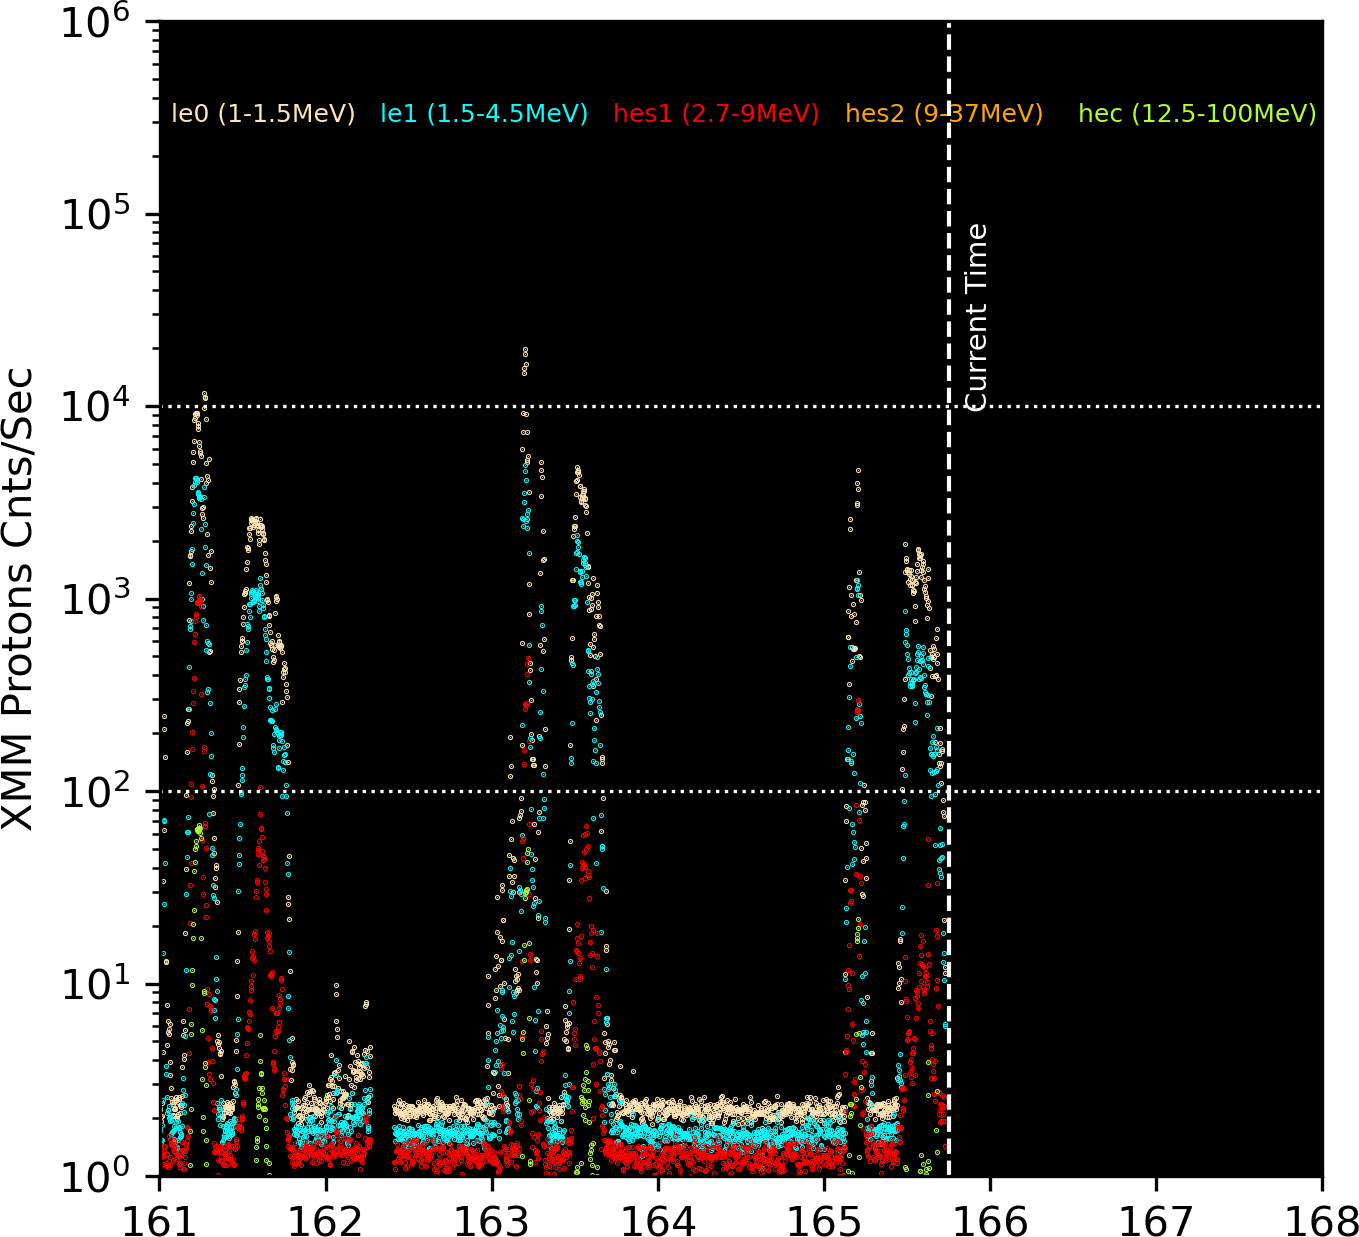
                                        Most recent XMM radiation observations
                                 Differential Flux particles/cm2-s-ster-MeV

 UT Date   Time    ---------------------------------- Protons MeV -------------------------------
                          LE1          LE2         HES1         HES2         HESC
  YR MO DA HHMM          1-1.5       1.5-4.5       2.7-9        9-37       12.5-100
2025-Jul05-13:30        1.642        0.424        1.255        0.401        0.379
2025-Jul05-14:30        1.654        0.400        1.322        0.429        0.378
2025-Jul05-15:30        1.615        0.415        1.268        0.426        0.376
2025-Jul05-16:30        1.600        0.403        1.349        0.450        0.377
2025-Jul05-17:30        1.526        0.396        1.254        0.415        0.358
2025-Jul05-18:30        1.580        0.395        1.246        0.459        0.371
2025-Jul05-19:30        1.613        0.374        1.255        0.412        0.396
2025-Jul05-20:30        1.562        0.404        1.194        0.406        0.349
2025-Jul05-21:30        1.653        0.389        1.231        0.429        0.384
2025-Jul05-22:30        2.658        0.383        1.354        0.424        0.381
2025-Jul05-23:30        3.507        0.396        1.464        0.409        0.332
2025-Jul06-00:30        1.650        0.420        1.235        0.455        0.385
2025-Jul06-01:30       38.380        0.412        3.011        0.436        0.431
2025-Jul06-02:30      276.809        0.396       43.170        0.436        2.788
2025-Jul06-03:30      737.152        0.449      569.677        0.551       37.112
2025-Jul06-04:30      114.377        0.414       11.624        0.428        1.062
2025-Jul06-05:30        4.059        0.411        1.334        0.408        0.355
2025-Jul06-06:30       16.557        0.391        1.337        0.449        0.387
2025-Jul06-07:30        3.638        0.444        1.203        0.432        0.363
2025-Jul06-08:30        1.903        0.416        1.307        0.458        0.361
2025-Jul06-09:30        1.775        0.397        1.257        0.443        0.361
2025-Jul06-10:30      487.499        0.404       22.837        0.428        1.752
2025-Jul06-11:30     1232.442        0.412       65.444        0.477        4.163
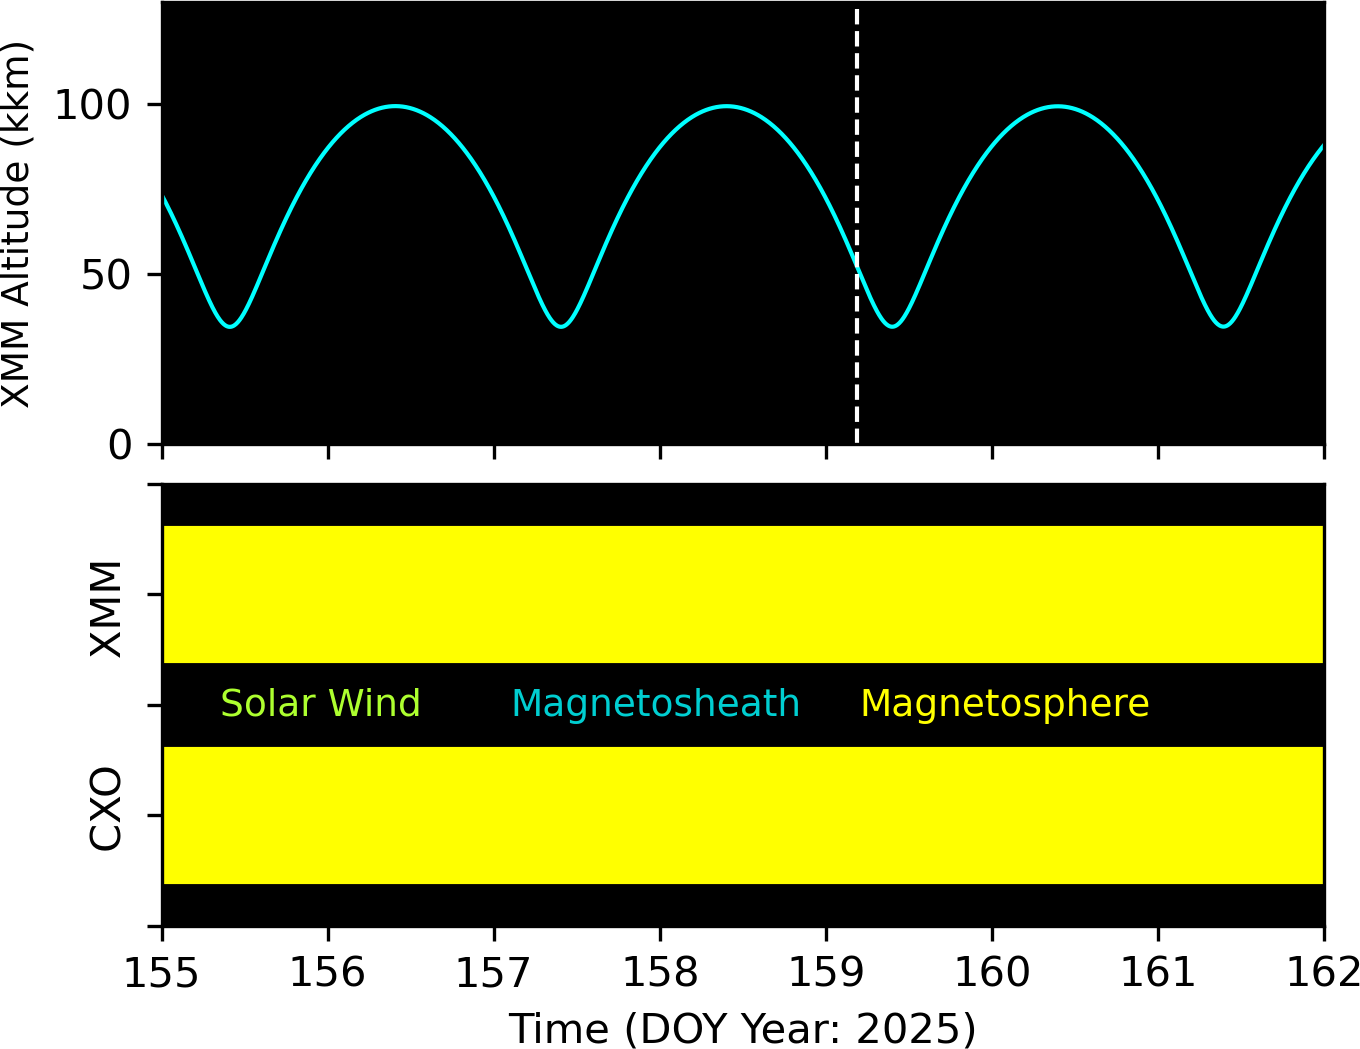
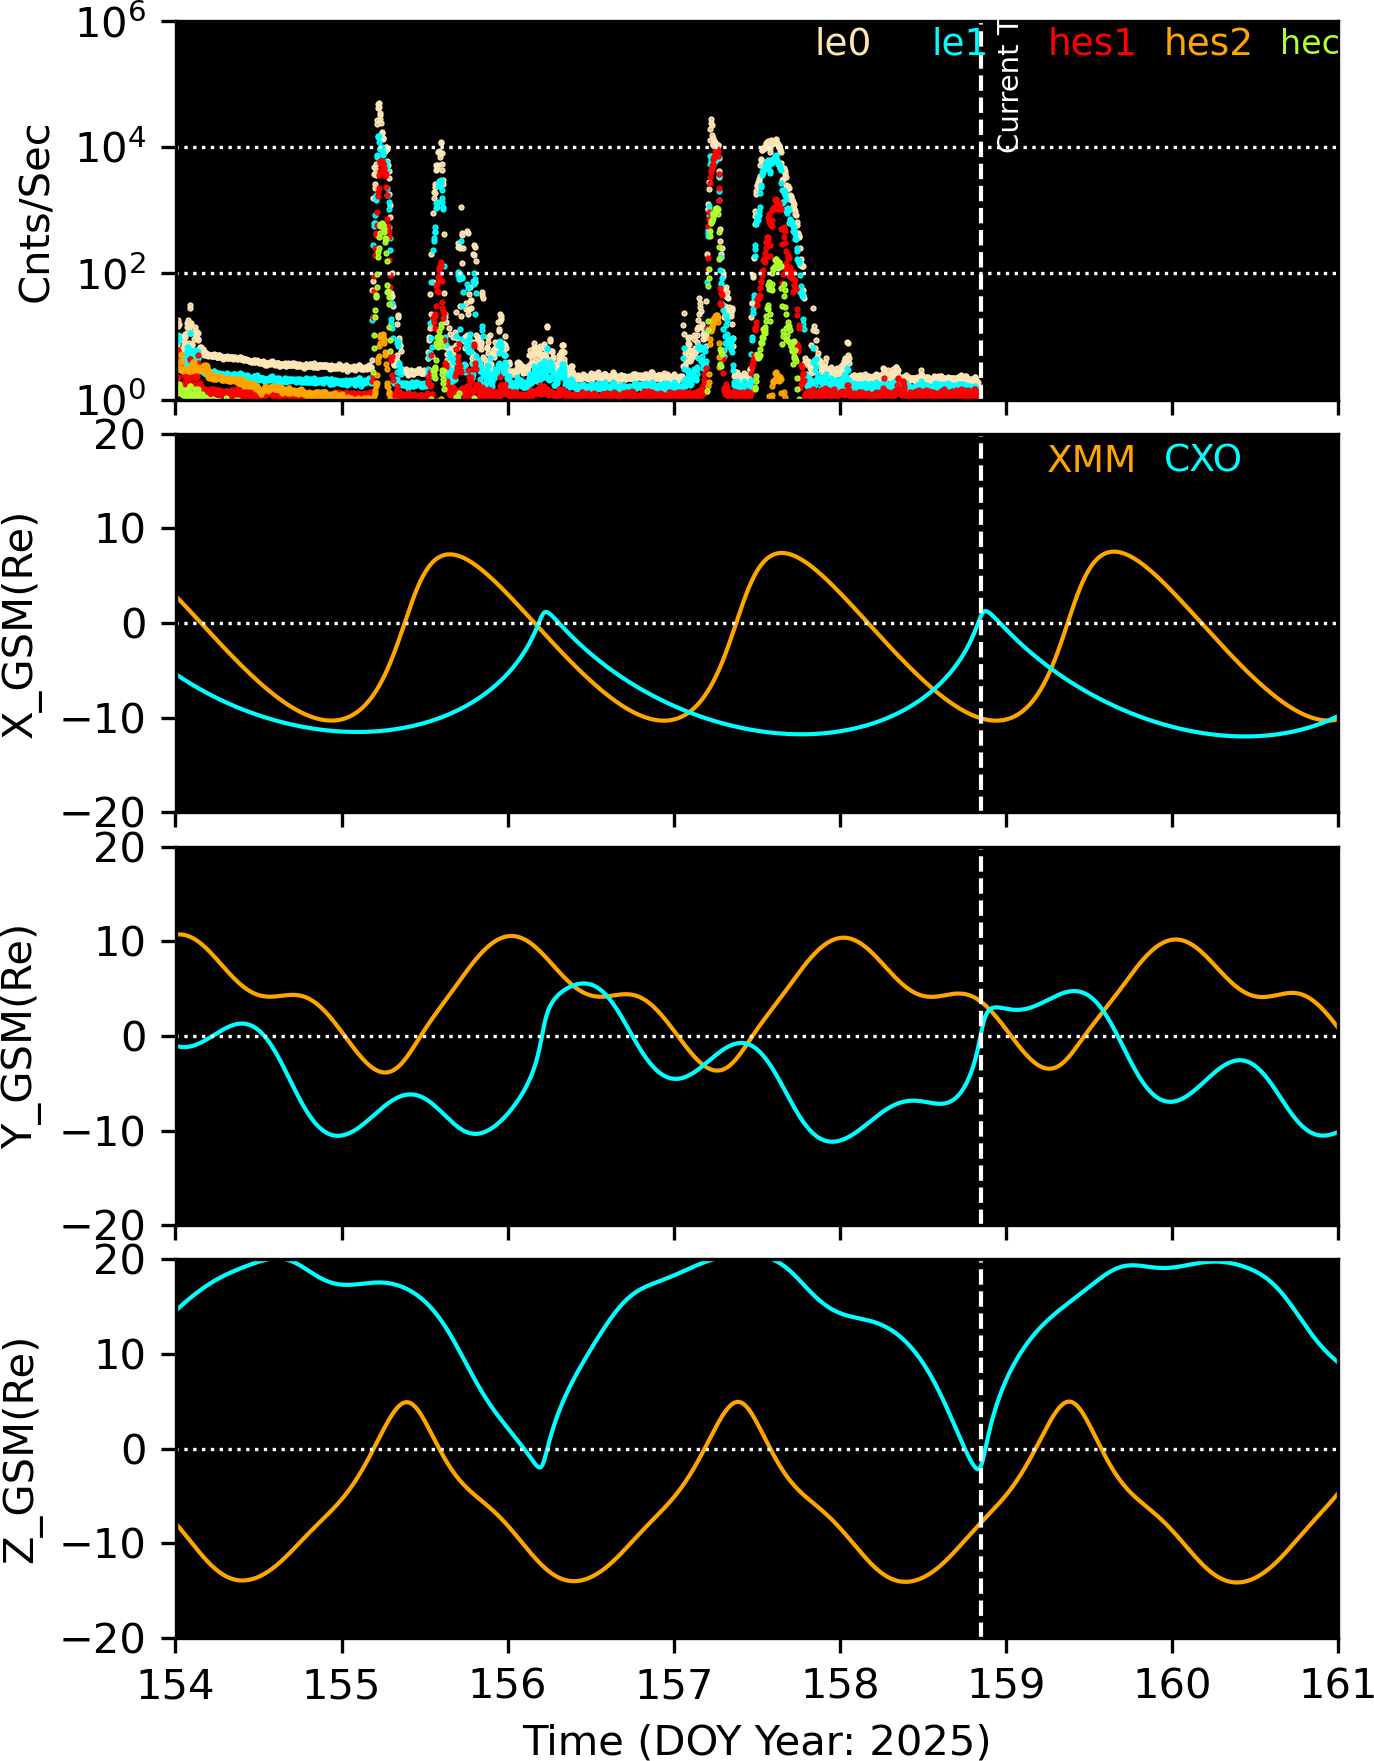
The following plots show the orbits of CXO and XMM in GSM coordinates. The left plot is in X-Y plane, and the right plot is in X-Z plane. If the orbit is in green, the satellite is in the solar wind area, if it is in light blue, the satellite is in magnetosheath, and if it is in yellow, the satellite is in magnetosphere.
The periods of the plotted orbits are +/-1.35 days from the current satellite positions (*), and the orange pentagon (*) mark the positions of one day ago.
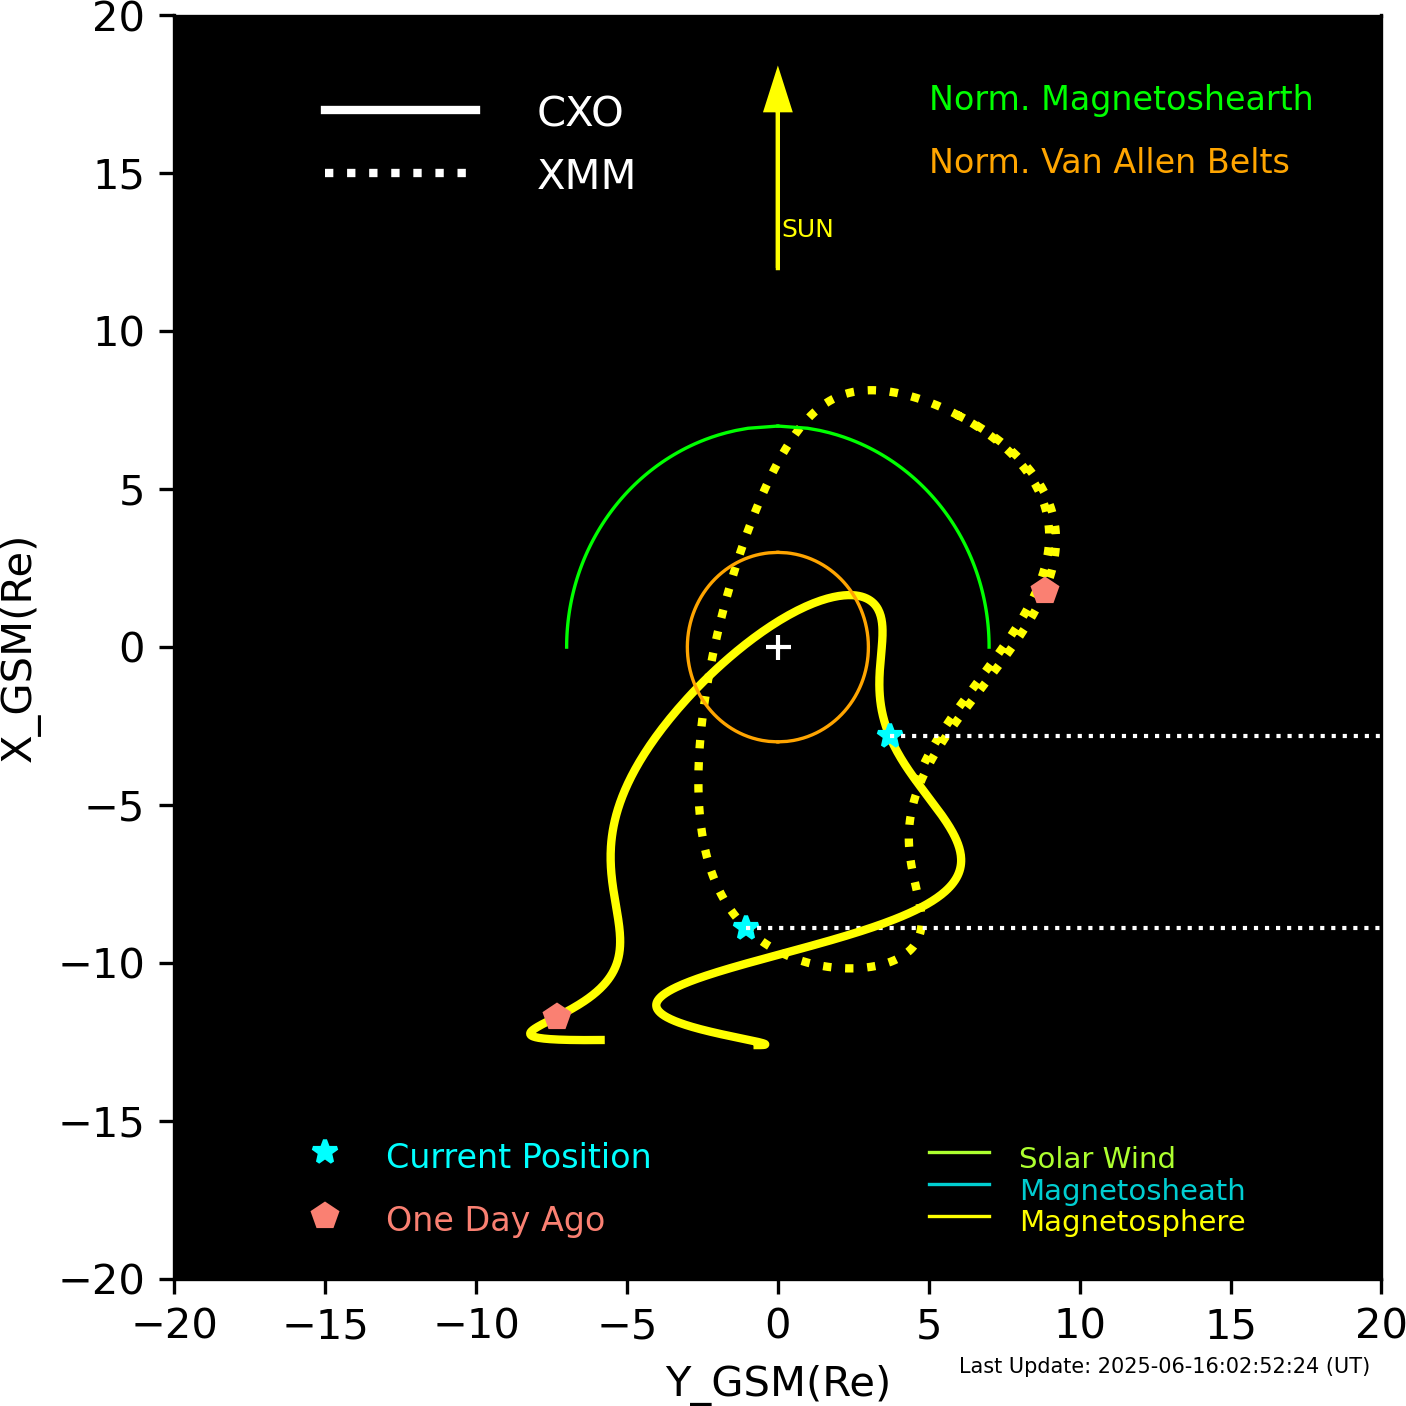
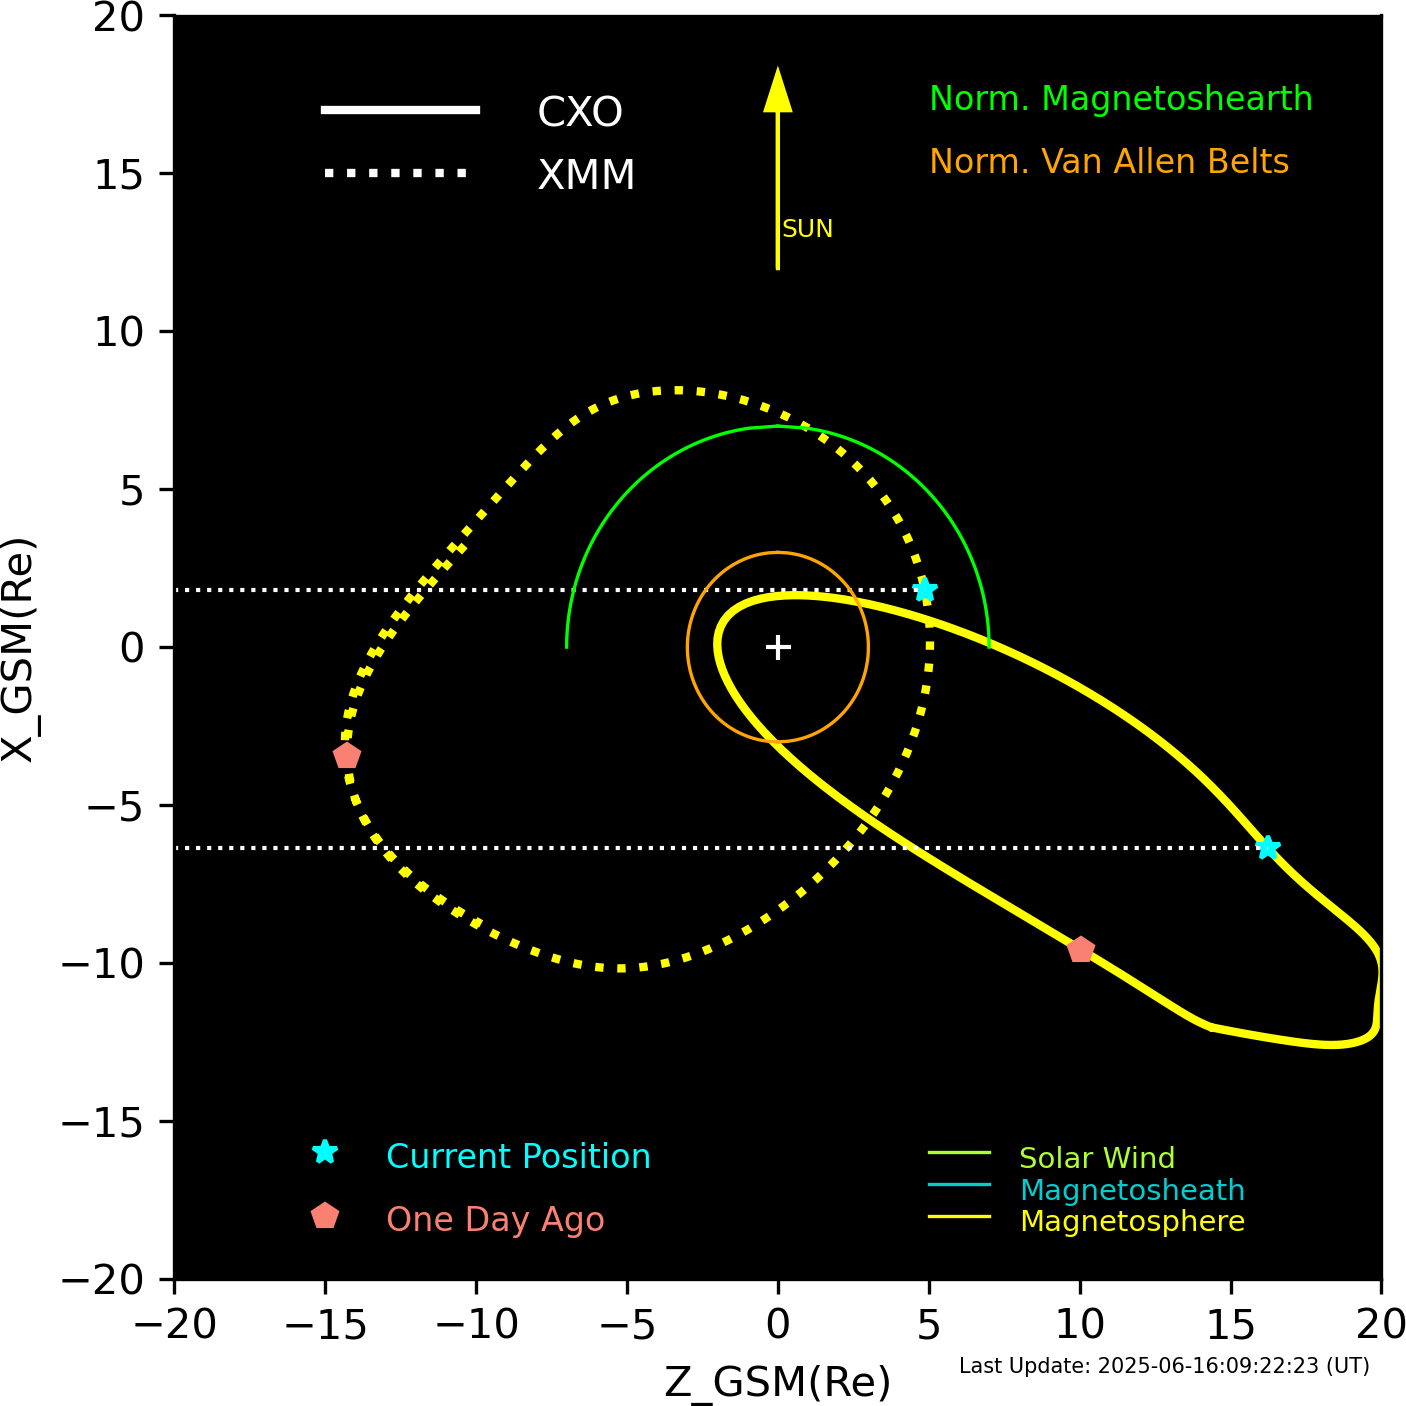
XMM and CXO orbits in GSM coordinates.
Email problems to: swolk
(Scott Wolk)
...it is all his fault