| Science Run Stop: | 2001:12:26:06:30 |
| Science Run Start: | 2001:12:28:00:00 |
| Interruption: | 135.8ks |
| Triggered by: | auto |
Go to:
ACE Plot (E38/E175, P47/P112/P310/P761/P1060, Anisotopy)
EPHIN Plot (P4/P41/E1300)
GOES-11 Plot (P1/P2/P5)
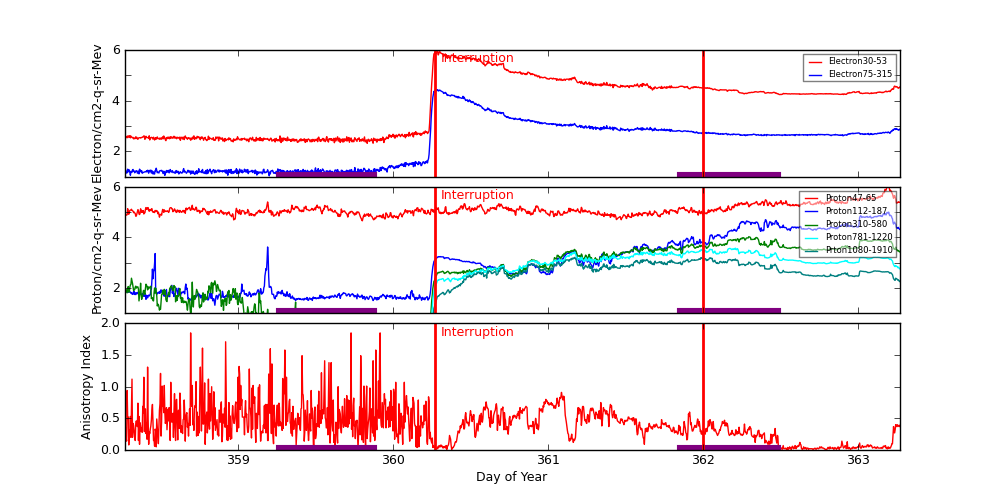
ACE radiation data are plotted around periods when science runs were interrupted. Plots start exactly 2 days before the interruption started. The top panel shows differential fluxes of electrons 38-53 and 175-315 (particles/cm2-s-ster-MeV), the middle panel shows differential fluxes of protons 47-65, 112-187, and 310-580 (particles/cm2-s-ster-MeV), and the bottom panel shows anisotropy ratio. The original data are prepared by the U.S. Dept. of Commerce, NOAA, Space Environment Center.
Data Period  (dom): 358.2708 - 363.2708
Interruption (dom): 360.2708 - 362.0000
			Avg		 Max		Time	Min		Time		Value at Interruption Started
--------------------------------------------------------------------------------------------------------------------------
e38 		6.380e+04+/-1.392e+05	8.830e+05	360.285 	2.060e+02	359.833		3.490e+04
e175		1.453e+03+/-3.878e+03	2.700e+04	360.285 	1.070e+01	359.201		7.610e+02
p47 		1.444e+05+/-1.030e+05	1.220e+06	363.198 	4.490e+04	359.802		2.420e+05
p112		9.035e+03+/-1.682e+04	9.910e+04	363.198 	2.080e+01	358.851		2.030e+04
p310		2.023e+03+/-2.494e+03	1.060e+04	362.295 	3.270e+00	359.465		2.710e+03
p761		8.779e+02+/-9.564e+02	3.750e+03	362.208 	7.090e-01	359.201		5.860e+02
p1060		3.891e+02+/-4.282e+02	1.610e+03	361.174 	1.380e-01	359.236		1.820e+02
anisotropy	4.000e-01+/-2.926e-01	2.000e+00	358.924 	1.000e-02	360.347		3.900e-01

Hardness:
e38/e175	3.830e+01+/-1.819e+01	8.802e+01	360.712 	8.182e+00	360.236		4.586e+01
p47/p1060	1.317e+05+/-1.807e+05	1.147e+06	359.191 	5.462e+01	361.986		1.330e+03
p112/p1060	1.216e+02+/-6.086e+02	1.908e+04	359.191 	6.483e-01	360.983		1.115e+02
p310/p1060	3.691e+01+/-8.008e+01	7.138e+02	358.851 	1.177e+00	360.792		1.489e+01
p761/p1060	2.935e+00+/-1.084e+00	9.085e+00	359.562 	9.684e-01	360.549		3.220e+00

Steepest Rise
------------
	Time		Slope(in log per hr)
----------------------------------------
e1  	360.2674		998285.6202
e175	360.2535		30535.3719
p47 	363.1806		775204.3643
p112	363.0000		52920.2979
p310	362.3368		10392.0585
p761	362.3368		3204.0180
p1060	362.3403		1162.8065
Two vertical red lines indicate the start and the end of the interruption. Purple hatched areas indicate that the satellite is in the radiation belt.
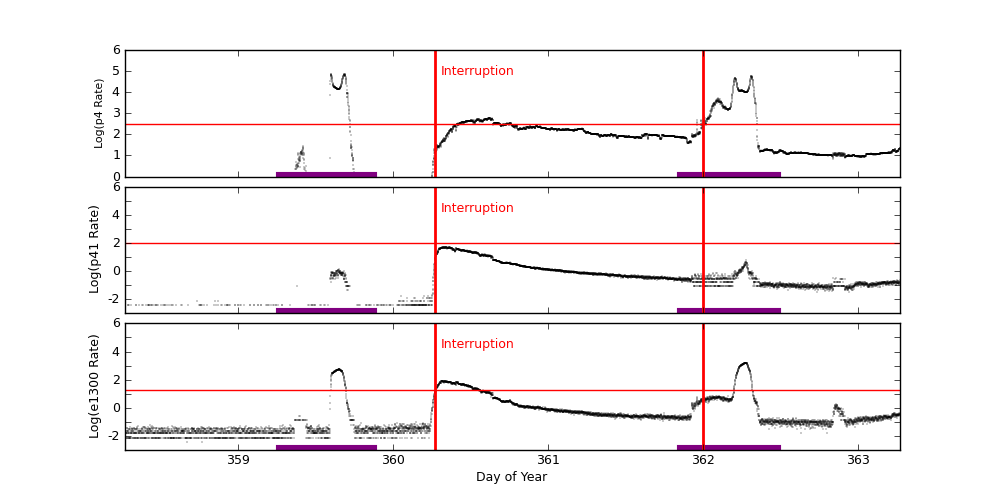
EPHIN Data are used to trigger science run interruptions. The trigger levels are:
| P4 | 300 | Counts/cm2 sec sr MeV |
| P41 | 10 | Counts/cm2 sec sr MeV |
| E1300 | 20 | Counts/cm2 sec sr MeV |
		Avg			Max		Time		Min		Time		Value at Interruption Started
--------------------------------------------------------------------------------------------------------------------------
p4	1.426e+03 +/- 6.726e+03		7.024e+04	359.600		1.483e-03	358.716		1.270e+01
p41	2.365e+00 +/- 7.800e+00		5.471e+01	360.330		1.000e-04	358.176		7.029e+00
e1300	2.740e+01 +/- 1.476e+02		1.654e+03	362.275		1.000e-04	358.198		1.004e+01
Two vertical red lines indicate the start and the end of the interruption. Red horizontal lines indicate SCS 107 limits. Purple hatched areas indicate that the satellite is in the radiation belt.
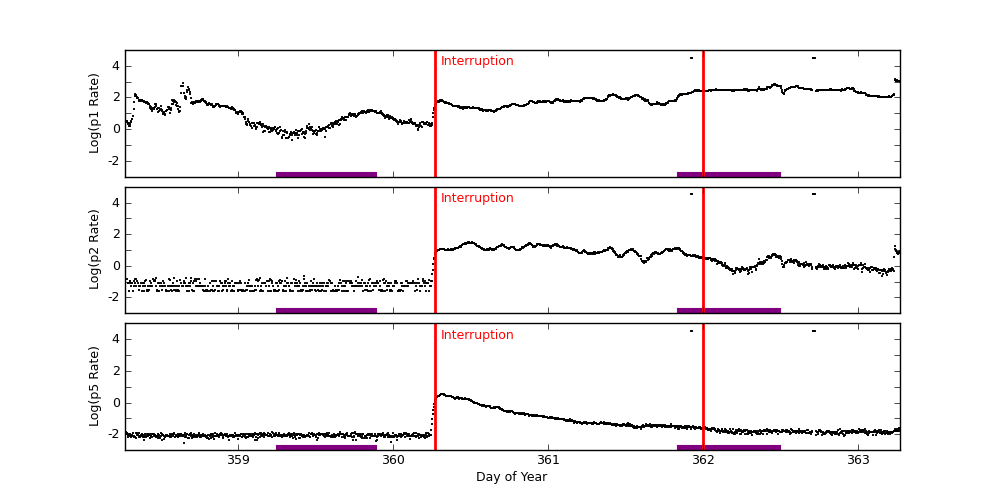
GOES-11 data are taken from NOAA site (http://goes.ngdc.noaa.gov).
| P1 | .8 - 4.0 | MeV protons (Counts/cm2 sec sr MeV) Uncorrected |
| P2 | 4.0 - 9.0 | MeV protons (Counts/cm2 sec sr MeV) Uncorrected |
| P5 | 40.0 - 80.0 | MeV protons (Counts/cm2 sec sr MeV) Uncorrected |
		Avg			Max		Time		Min		Time		Value at Interruption Started
--------------------------------------------------------------------------------------------------------------------------
p1	2.741e+02 +/- 2.271e+03		3.270e+04	361.924		2.000e-01	359.347		3.040e+01
p2	1.718e+02 +/- 2.331e+03		3.270e+04	361.924		2.580e-02	358.295		6.010e+00
p5	1.590e+02 +/- 2.274e+03		3.270e+04	361.924		2.940e-03	358.649		1.050e+00
Two vertical red lines indicate the start and the end of the interruption. Red horizontal lines indicate SCS 107 limits. Purple hatched areas indicate that the satellite is in the radiation belt.