| Science Run Stop: | 2002:08:18:18:43 |
| Science Run Start: | 2002:08:19:19:48 |
| Interruption: | 90.0ks |
| Triggered by: | manual |
Go to:
ACE Plot (E38/E175, P47/P112/P310/P761/P1060, Anisotopy)
EPHIN Plot (P4/P41/E1300)
GOES-11 Plot (P1/P2/P5)
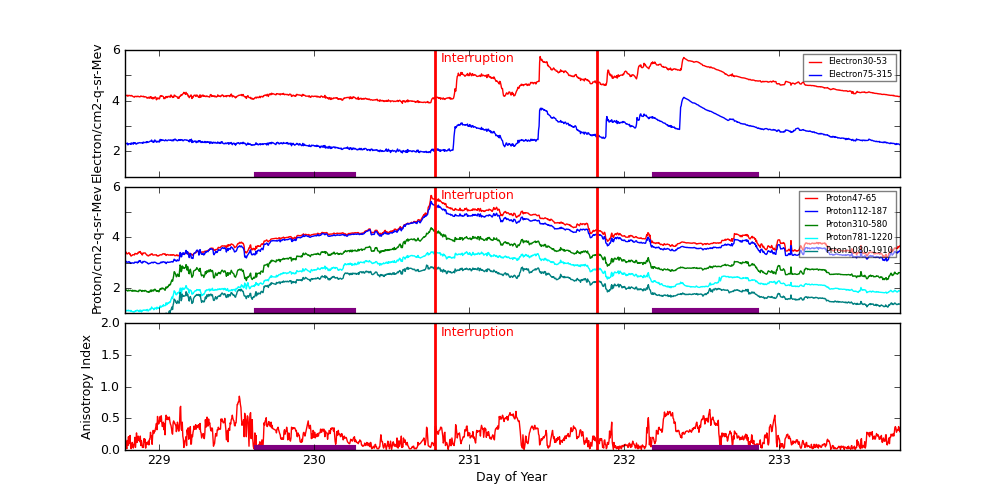
ACE radiation data are plotted around periods when science runs were interrupted. Plots start exactly 2 days before the interruption started. The top panel shows differential fluxes of electrons 38-53 and 175-315 (particles/cm2-s-ster-MeV), the middle panel shows differential fluxes of protons 47-65, 112-187, and 310-580 (particles/cm2-s-ster-MeV), and the bottom panel shows anisotropy ratio. The original data are prepared by the U.S. Dept. of Commerce, NOAA, Space Environment Center.
Data Period  (dom): 228.7799 - 233.7799
Interruption (dom): 230.7799 - 231.8250
			Avg		 Max		Time	Min		Time		Value at Interruption Started
--------------------------------------------------------------------------------------------------------------------------
e38 		6.620e+04+/-8.542e+04	5.520e+05	231.458 	7.820e+03	230.569		1.450e+04
e175		9.002e+02+/-1.644e+03	1.350e+04	232.385 	8.620e+01	230.569		1.820e+02
p47 		2.915e+04+/-5.276e+04	4.480e+05	230.757 	1.590e+03	233.694		4.550e+03
p112		1.858e+04+/-3.097e+04	2.620e+05	230.754 	8.870e+02	228.931		2.920e+03
p310		2.523e+03+/-3.431e+03	2.380e+04	230.757 	6.800e+01	228.934		4.020e+02
p761		6.120e+02+/-7.019e+02	2.960e+03	230.781 	1.130e+01	228.833		7.620e+01
p1060		1.836e+02+/-1.833e+02	8.060e+02	230.726 	3.400e+00	228.889		2.320e+01
anisotropy	2.231e-01+/-1.514e-01	8.500e-01	229.517 	1.000e-02	229.629		2.900e-01

Hardness:
e38/e175	8.827e+01+/-3.076e+01	2.206e+02	232.351 	2.434e+01	231.889		7.967e+01
p47/p1060	1.408e+02+/-1.158e+02	7.363e+02	228.871 	3.228e+01	230.208		1.961e+02
p112/p1060	8.799e+01+/-5.502e+01	3.808e+02	230.754 	2.887e+01	230.215		1.259e+02
p310/p1060	1.209e+01+/-4.070e+00	3.510e+01	230.757 	4.837e+00	229.621		1.733e+01
p761/p1060	3.017e+00+/-7.983e-01	5.594e+00	231.264 	1.237e+00	229.521		3.284e+00

Steepest Rise
------------
	Time		Slope(in log per hr)
----------------------------------------
e1  	231.4410		600126.7620
e175	232.3681		15302.5724
p47 	230.7396		441604.9758
p112	230.7361		226322.5501
p310	230.7083		17520.1974
p761	230.7153		2988.0337
p1060	230.7083		967.2109
Two vertical red lines indicate the start and the end of the interruption. Purple hatched areas indicate that the satellite is in the radiation belt.
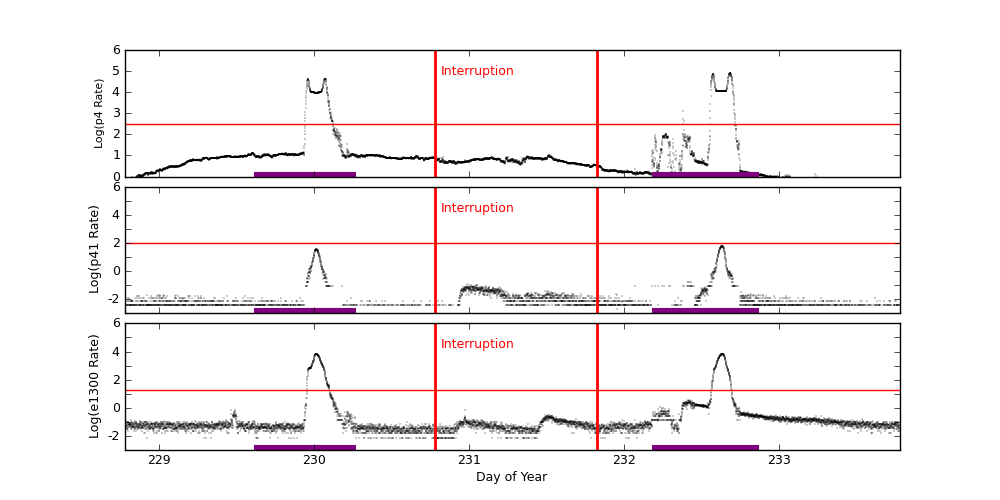
EPHIN Data are used to trigger science run interruptions. The trigger levels are:
| P4 | 300 | Counts/cm2 sec sr MeV |
| P41 | 10 | Counts/cm2 sec sr MeV |
| E1300 | 20 | Counts/cm2 sec sr MeV |
		Avg			Max		Time		Min		Time		Value at Interruption Started
--------------------------------------------------------------------------------------------------------------------------
p4	1.360e+03 +/- 7.148e+03		8.048e+04	232.682		2.373e-01	233.767		7.821e+00
p41	6.353e-01 +/- 4.676e+00		6.301e+01	232.633		1.000e-04	228.765		1.000e-04
e1300	1.174e+02 +/- 7.149e+02		6.650e+03	232.634		1.000e-04	229.628		2.275e-02
Two vertical red lines indicate the start and the end of the interruption. Red horizontal lines indicate SCS 107 limits. Purple hatched areas indicate that the satellite is in the radiation belt.
GOES-11 data are taken from NOAA site (http://goes.ngdc.noaa.gov).
| P1 | .8 - 4.0 | MeV protons (Counts/cm2 sec sr MeV) Uncorrected |
| P2 | 4.0 - 9.0 | MeV protons (Counts/cm2 sec sr MeV) Uncorrected |
| P5 | 40.0 - 80.0 | MeV protons (Counts/cm2 sec sr MeV) Uncorrected |
		Avg			Max		Time		Min		Time		Value at Interruption Started
--------------------------------------------------------------------------------------------------------------------------
p1	1.332e+02 +/- 3.015e+02		2.840e+03	229.333		2.130e+00	229.260		5.410e+02
p2	1.114e+00 +/- 1.281e+00		7.740e+00	231.274		2.580e-02	228.830		5.060e+00
p5	8.199e-03 +/- 2.071e-03		1.760e-02	231.128		2.940e-03	231.854		6.710e-03
Two vertical red lines indicate the start and the end of the interruption. Red horizontal lines indicate SCS 107 limits. Purple hatched areas indicate that the satellite is in the radiation belt.
