| Science Run Stop: | 2002:11:27:00:02 |
| Science Run Start: | 2002:11:28:03:30 |
| Interruption: | 98.0ks |
| Triggered by: | manual |
Go to:
ACE Plot (E38/E175, P47/P112/P310/P761/P1060, Anisotopy)
EPHIN Plot (P4/P41/E1300)
GOES-11 Plot (P1/P2/P5)
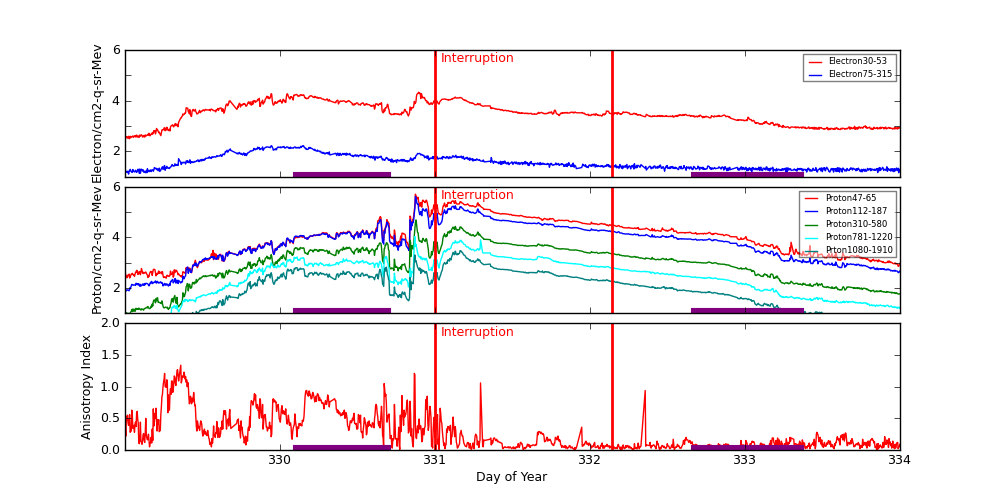
ACE radiation data are plotted around periods when science runs were interrupted. Plots start exactly 2 days before the interruption started. The top panel shows differential fluxes of electrons 38-53 and 175-315 (particles/cm2-s-ster-MeV), the middle panel shows differential fluxes of protons 47-65, 112-187, and 310-580 (particles/cm2-s-ster-MeV), and the bottom panel shows anisotropy ratio. The original data are prepared by the U.S. Dept. of Commerce, NOAA, Space Environment Center.
Data Period  (dom): 329.0014 - 334.0014
Interruption (dom): 331.0014 - 332.1458
			Avg		 Max		Time	Min		Time		Value at Interruption Started
--------------------------------------------------------------------------------------------------------------------------
e38 		4.584e+03+/-4.162e+03	2.150e+04	330.896 	3.120e+02	329.031		8.420e+02
e175		4.474e+01+/-3.459e+01	1.660e+02	330.153 	1.250e+01	329.024		1.940e+01
p47 		3.365e+04+/-6.027e+04	5.080e+05	330.875 	2.430e+02	329.267		9.270e+02
p112		1.970e+04+/-3.517e+04	4.120e+05	330.875 	7.530e+01	329.007		4.620e+02
p310		2.662e+03+/-4.370e+03	4.890e+04	330.878 	8.710e+00	329.007		5.890e+01
p761		7.492e+02+/-1.144e+03	1.070e+04	330.872 	1.250e+00	329.003		1.580e+01
p1060		2.460e+02+/-3.932e+02	2.980e+03	331.163 	3.800e-01	329.017		5.080e+00
anisotropy	2.714e-01+/-2.824e-01	2.000e+00	332.948 	1.000e-02	330.774		9.000e-02

Hardness:
e38/e175	9.431e+01+/-4.399e+01	2.722e+02	330.896 	1.938e+01	329.031		4.340e+01
p47/p1060	1.751e+02+/-1.281e+02	9.545e+02	329.108 	1.241e+01	330.066		1.825e+02
p112/p1060	9.377e+01+/-4.724e+01	3.780e+02	330.875 	1.342e+01	330.066		9.094e+01
p310/p1060	1.255e+01+/-3.894e+00	4.041e+01	330.878 	4.503e+00	330.076		1.159e+01
p761/p1060	3.477e+00+/-9.776e-01	1.313e+01	329.340 	1.879e+00	329.076		3.110e+00

Steepest Rise
------------
	Time		Slope(in log per hr)
----------------------------------------
e1  	330.8785		19439.8248
e175	329.7222		108.5990
p47 	330.8576		526315.2557
p112	330.8576		434876.0800
p310	330.8611		51155.5389
p761	330.8542		12639.4861
p1060	330.8542		2376.8186
Two vertical red lines indicate the start and the end of the interruption. Purple hatched areas indicate that the satellite is in the radiation belt.
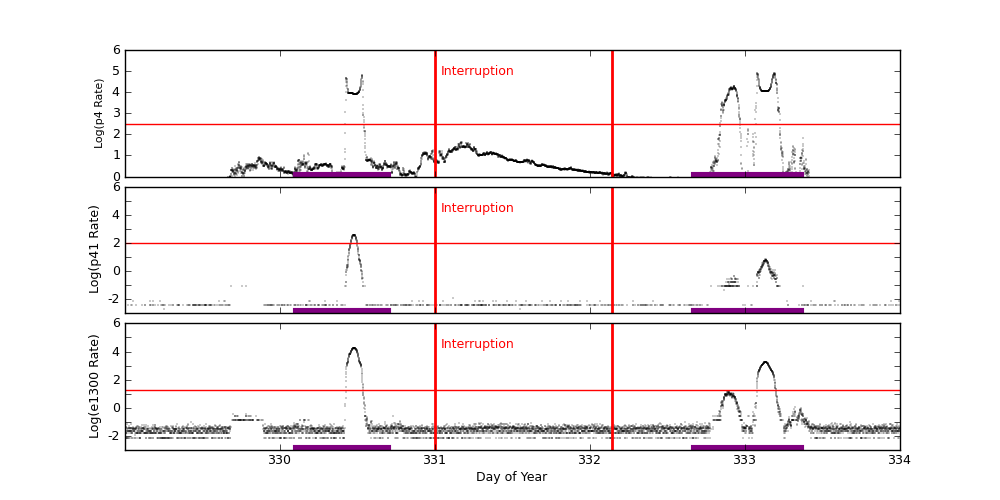
EPHIN Data are used to trigger science run interruptions. The trigger levels are:
| P4 | 300 | Counts/cm2 sec sr MeV |
| P41 | 10 | Counts/cm2 sec sr MeV |
| E1300 | 20 | Counts/cm2 sec sr MeV |
		Avg			Max		Time		Min		Time		Value at Interruption Started
--------------------------------------------------------------------------------------------------------------------------
p4	1.314e+03 +/- 6.600e+03		8.395e+04	333.191		2.966e-03	328.931		4.864e+00
p41	2.466e+00 +/- 2.570e+01		3.916e+02	330.477		1.000e-04	328.926		1.000e-04
e1300	1.809e+02 +/- 1.426e+03		1.763e+04	330.479		1.000e-04	328.948		1.517e-02
Two vertical red lines indicate the start and the end of the interruption. Red horizontal lines indicate SCS 107 limits. Purple hatched areas indicate that the satellite is in the radiation belt.
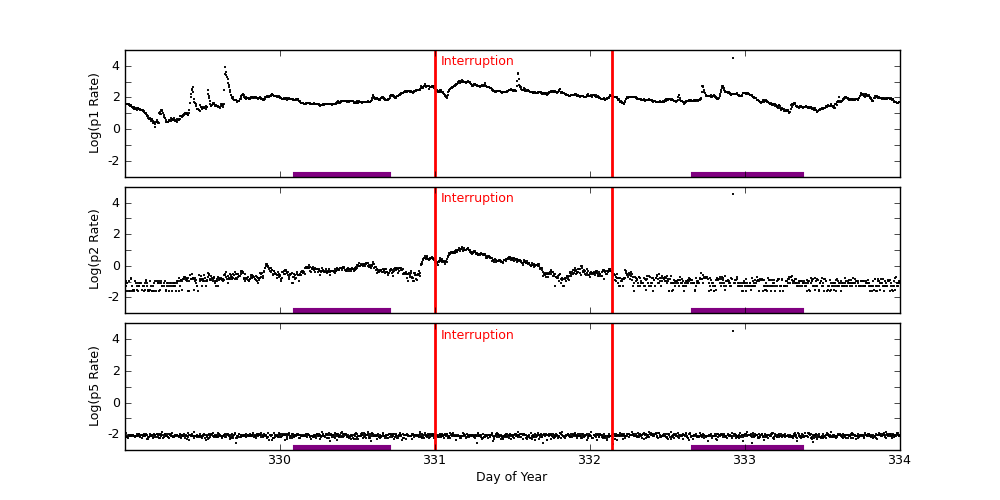
GOES-11 data are taken from NOAA site (http://goes.ngdc.noaa.gov).
| P1 | .8 - 4.0 | MeV protons (Counts/cm2 sec sr MeV) Uncorrected |
| P2 | 4.0 - 9.0 | MeV protons (Counts/cm2 sec sr MeV) Uncorrected |
| P5 | 40.0 - 80.0 | MeV protons (Counts/cm2 sec sr MeV) Uncorrected |
		Avg			Max		Time		Min		Time		Value at Interruption Started
--------------------------------------------------------------------------------------------------------------------------
p1	1.839e+02 +/- 9.240e+02		3.270e+04	332.924		1.330e+00	329.198		3.630e+02
p2	2.406e+01 +/- 8.708e+02		3.270e+04	332.924		2.580e-02	329.014		1.830e+00
p5	2.272e+01 +/- 8.614e+02		3.270e+04	332.924		2.520e-03	332.153		8.550e-03
Two vertical red lines indicate the start and the end of the interruption. Red horizontal lines indicate SCS 107 limits. Purple hatched areas indicate that the satellite is in the radiation belt.