| Science Run Stop: | 2003:05:08:20:08 |
| Science Run Start: | 2003:05:10:02:39 |
| Interruption: | 52.7ks |
| Triggered by: | auto |
Go to:
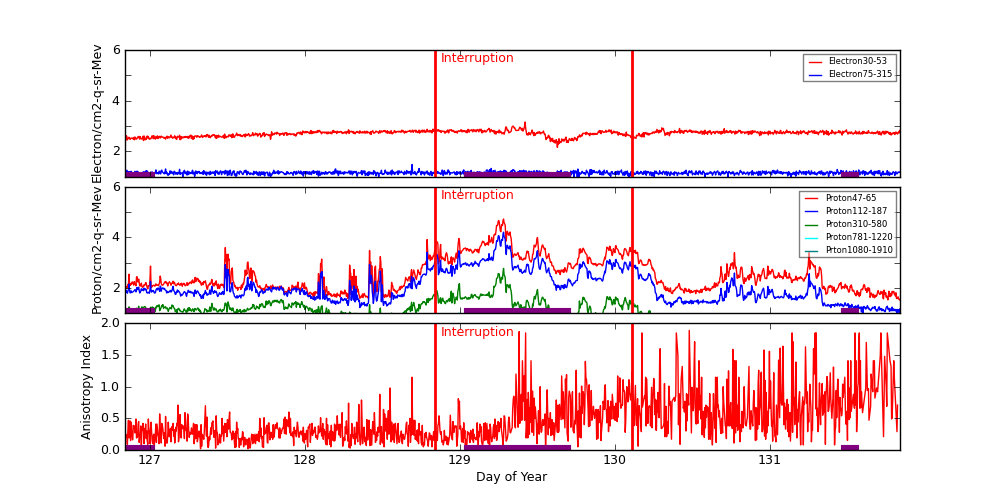
ACE Plot (E38/E175, P47/P112/P310/P761/P1060, Anisotopy)
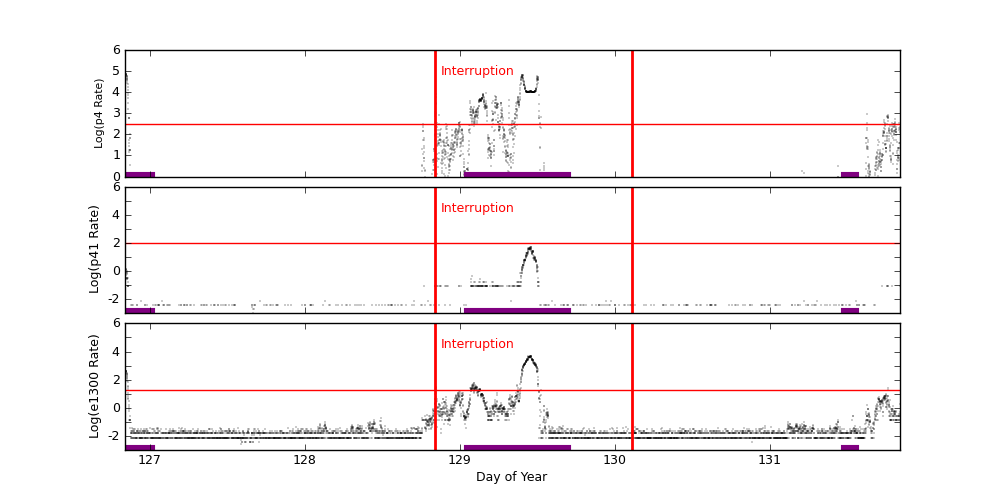
EPHIN Plot (P4/P41/E1300)
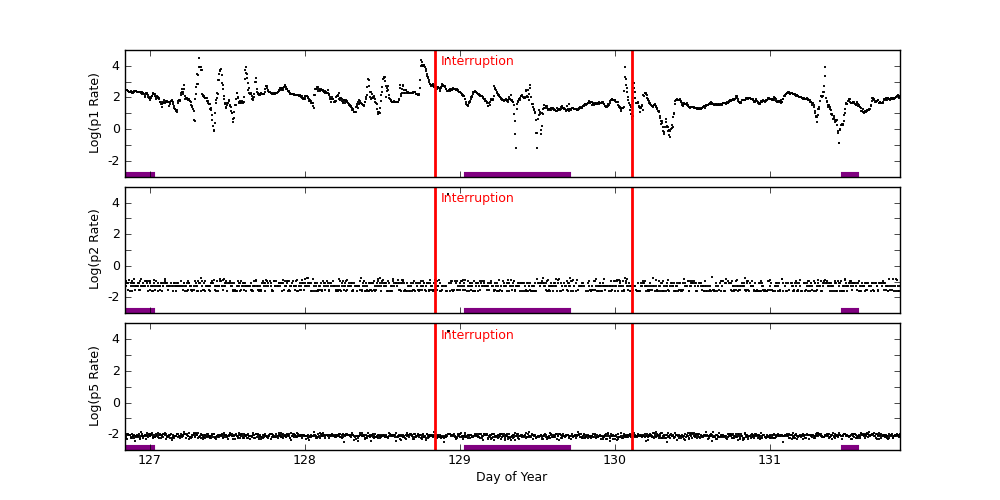
GOES-11 Plot (P1/P2/P5)
ACE radiation data are plotted around periods when science runs were interrupted. Plots start exactly 2 days before the interruption started. The top panel shows differential fluxes of electrons 38-53 and 175-315 (particles/cm2-s-ster-MeV), the middle panel shows differential fluxes of protons 47-65, 112-187, and 310-580 (particles/cm2-s-ster-MeV), and the bottom panel shows anisotropy ratio. The original data are prepared by the U.S. Dept. of Commerce, NOAA, Space Environment Center.
Data Period  (dom): 126.8389 - 131.8389
Interruption (dom): 128.8389 - 130.1104
			Avg		 Max		Time	Min		Time		Value at Interruption Started
--------------------------------------------------------------------------------------------------------------------------
e38 		5.196e+02+/-1.181e+02	1.430e+03	129.420 	1.420e+02	129.629		6.670e+02
e175		1.410e+01+/-1.851e+00	2.980e+01	128.691 	8.500e+00	127.778		1.480e+01
p47 		1.340e+03+/-4.132e+03	5.270e+04	129.281 	3.270e+01	128.323		3.350e+01
p112		3.729e+02+/-1.114e+03	1.590e+04	129.281 	1.020e+01	131.819		1.460e+01
p310		1.856e+01+/-3.689e+01	5.940e+02	129.281 	5.820e-01	131.688		1.890e+00
p761		2.594e+00+/-2.132e+00	1.130e+01	129.246 	1.570e-01	131.722		4.750e-01
p1060		8.917e-01+/-7.601e-01	7.160e+00	129.281 	3.820e-02	131.736		9.160e-02
anisotropy	4.850e-01+/-3.859e-01	2.000e+00	129.389 	2.000e-02	127.326		-1.000e+00

Hardness:
e38/e175	3.733e+01+/-9.194e+00	1.014e+02	129.420 	8.452e+00	129.629		4.507e+01
p47/p1060	1.629e+03+/-2.433e+03	1.501e+04	130.778 	2.388e+01	127.816		3.657e+02
p112/p1060	4.357e+02+/-6.501e+02	4.093e+03	129.326 	1.135e+01	131.601		1.594e+02
p310/p1060	2.089e+01+/-1.979e+01	1.217e+02	129.292 	1.572e+00	131.601		2.063e+01
p761/p1060	3.203e+00+/-1.681e+00	1.763e+01	129.639 	2.849e-01	131.601		5.186e+00

Steepest Rise
------------
	Time		Slope(in log per hr)
----------------------------------------
e1  	129.3854		964.7913
e175	129.3819		20.1598
p47 	129.2326		47495.5719
p112	129.2326		12251.8896
p310	129.2292		386.0365
p761	129.2292		9.1079
p1060	129.2292		4.9008
Two vertical red lines indicate the start and the end of the interruption. Purple hatched areas indicate that the satellite is in the radiation belt.
EPHIN Data are used to trigger science run interruptions. The trigger levels are:
| P4 | 300 | Counts/cm2 sec sr MeV |
| P41 | 10 | Counts/cm2 sec sr MeV |
| E1300 | 20 | Counts/cm2 sec sr MeV |
		Avg			Max		Time		Min		Time		Value at Interruption Started
--------------------------------------------------------------------------------------------------------------------------
p4	1.139e+03 +/- 6.597e+03		7.198e+04	126.840		9.886e-04	127.589		4.024e+02
p41	3.338e-01 +/- 3.073e+00		5.539e+01	129.456		1.000e-04	126.860		1.000e-04
e1300	4.473e+01 +/- 3.481e+02		4.927e+03	129.455		1.000e-04	126.867		7.622e-01
Two vertical red lines indicate the start and the end of the interruption. Red horizontal lines indicate SCS 107 limits. Purple hatched areas indicate that the satellite is in the radiation belt.
GOES-11 data are taken from NOAA site (http://goes.ngdc.noaa.gov).
| P1 | .8 - 4.0 | MeV protons (Counts/cm2 sec sr MeV) Uncorrected |
| P2 | 4.0 - 9.0 | MeV protons (Counts/cm2 sec sr MeV) Uncorrected |
| P5 | 40.0 - 80.0 | MeV protons (Counts/cm2 sec sr MeV) Uncorrected |
		Avg			Max		Time		Min		Time		Value at Interruption Started
--------------------------------------------------------------------------------------------------------------------------
p1	3.330e+02 +/- 1.718e+03		3.270e+04	128.924		6.670e-02	129.361		5.780e+02
p2	2.628e+01 +/- 9.256e+02		3.270e+04	128.924		2.580e-02	126.872		2.580e-02
p5	4.542e+01 +/- 1.218e+03		3.270e+04	128.924		3.360e-03	128.253		8.990e-03
Two vertical red lines indicate the start and the end of the interruption. Red horizontal lines indicate SCS 107 limits. Purple hatched areas indicate that the satellite is in the radiation belt.